
|
|||||
|
 | |
| |
| |
| |
| |
| |
|
Gene: CHAC1 |
Gene summary for CHAC1 |
| Gene information | Species | Human | Gene symbol | CHAC1 | Gene ID | 79094 |
| Gene name | ChaC glutathione specific gamma-glutamylcyclotransferase 1 | |
| Gene Alias | CHAC1 | |
| Cytomap | 15q15.1 | |
| Gene Type | protein-coding | GO ID | GO:0006508 | UniProtAcc | Q9BUX1 |
Top |
Malignant transformation analysis |
| Identification of the aberrant gene expression in precancerous and cancerous lesions by comparing the gene expression of stem-like cells in diseased tissues with normal stem cells |
| Entrez ID | Symbol | Replicates | Species | Organ | Tissue | Adj P-value | Log2FC | Malignancy |
| 79094 | CHAC1 | P1T-E | Human | Esophagus | ESCC | 3.11e-04 | 4.49e-01 | 0.0875 |
| 79094 | CHAC1 | P4T-E | Human | Esophagus | ESCC | 4.50e-12 | 6.63e-01 | 0.1323 |
| 79094 | CHAC1 | P5T-E | Human | Esophagus | ESCC | 4.41e-07 | 2.50e-01 | 0.1327 |
| 79094 | CHAC1 | P12T-E | Human | Esophagus | ESCC | 9.35e-10 | 2.94e-01 | 0.1122 |
| 79094 | CHAC1 | P16T-E | Human | Esophagus | ESCC | 3.89e-12 | 3.40e-01 | 0.1153 |
| 79094 | CHAC1 | P23T-E | Human | Esophagus | ESCC | 4.47e-06 | 4.29e-01 | 0.108 |
| 79094 | CHAC1 | P26T-E | Human | Esophagus | ESCC | 3.97e-04 | 2.74e-01 | 0.1276 |
| 79094 | CHAC1 | P27T-E | Human | Esophagus | ESCC | 8.40e-04 | 1.22e-01 | 0.1055 |
| 79094 | CHAC1 | P28T-E | Human | Esophagus | ESCC | 3.75e-03 | 1.64e-01 | 0.1149 |
| 79094 | CHAC1 | P32T-E | Human | Esophagus | ESCC | 1.88e-04 | 1.70e-01 | 0.1666 |
| 79094 | CHAC1 | P39T-E | Human | Esophagus | ESCC | 8.56e-12 | 3.39e-01 | 0.0894 |
| 79094 | CHAC1 | P47T-E | Human | Esophagus | ESCC | 1.66e-02 | 1.94e-01 | 0.1067 |
| 79094 | CHAC1 | P48T-E | Human | Esophagus | ESCC | 1.66e-02 | 7.05e-02 | 0.0959 |
| 79094 | CHAC1 | P52T-E | Human | Esophagus | ESCC | 3.50e-02 | 1.82e-01 | 0.1555 |
| 79094 | CHAC1 | P54T-E | Human | Esophagus | ESCC | 1.51e-02 | 1.76e-01 | 0.0975 |
| 79094 | CHAC1 | P56T-E | Human | Esophagus | ESCC | 2.12e-05 | 5.88e-01 | 0.1613 |
| 79094 | CHAC1 | P61T-E | Human | Esophagus | ESCC | 6.74e-23 | 7.79e-01 | 0.099 |
| 79094 | CHAC1 | P74T-E | Human | Esophagus | ESCC | 6.79e-07 | 6.22e-01 | 0.1479 |
| 79094 | CHAC1 | P75T-E | Human | Esophagus | ESCC | 9.53e-09 | 3.00e-01 | 0.1125 |
| 79094 | CHAC1 | P82T-E | Human | Esophagus | ESCC | 1.47e-03 | 6.91e-01 | 0.1072 |
| Page: 1 2 |
| Tissue | Expression Dynamics | Abbreviation |
| Esophagus | 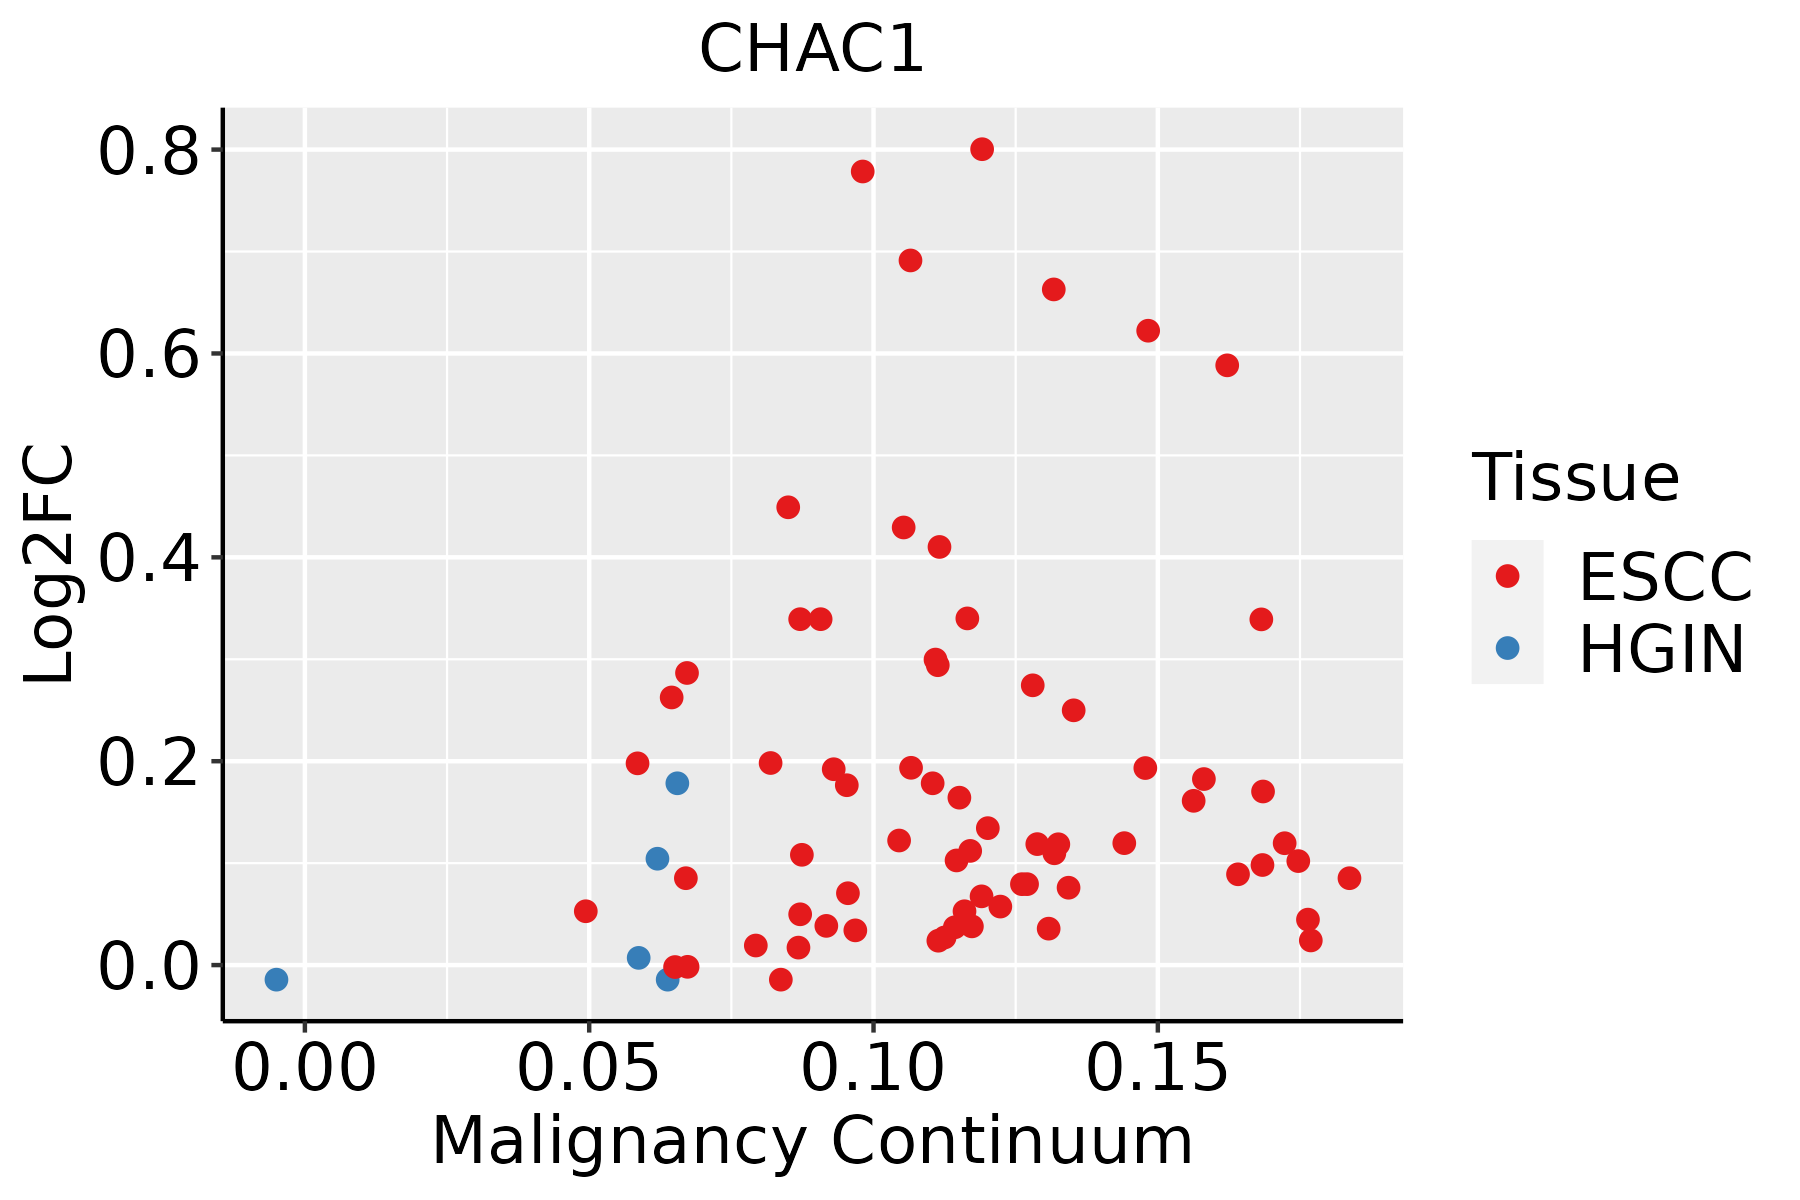 | ESCC: Esophageal squamous cell carcinoma |
| HGIN: High-grade intraepithelial neoplasias | ||
| LGIN: Low-grade intraepithelial neoplasias |
| ∗log2FC in expression of this searched gene in stem-like cells from each diseased tissue sample relative to stem-like cells in normal samples in each tissue plotted against the malignancy continuum. Samples are colored based on if they are from different disease stage. |
Top |
Malignant transformation related pathway analysis |
| Find out the enriched GO biological processes and KEGG pathways involved in transition from healthy to precancer to cancer |
| Tissue | Disease Stage | Enriched GO biological Processes |
| Colorectum | AD |  |
| Colorectum | SER |  |
| Colorectum | MSS |  |
| Colorectum | MSI-H |  |
| Colorectum | FAP |  |
| ∗Top 15 enriched GO BP terms are showed in the bar plot of each disease state in each tissue. Each row represents a significant GO biological process which is colored according to the -log10(p.adjust). |
| Page: 1 2 3 4 5 6 7 8 9 |
| GO ID | Tissue | Disease Stage | Description | Gene Ratio | Bg Ratio | pvalue | p.adjust | Count |
| GO:0097193111 | Esophagus | ESCC | intrinsic apoptotic signaling pathway | 222/8552 | 288/18723 | 5.87e-28 | 2.02e-25 | 222 |
| GO:0034976111 | Esophagus | ESCC | response to endoplasmic reticulum stress | 192/8552 | 256/18723 | 7.15e-22 | 1.30e-19 | 192 |
| GO:0035966111 | Esophagus | ESCC | response to topologically incorrect protein | 125/8552 | 159/18723 | 1.44e-17 | 1.27e-15 | 125 |
| GO:0006986111 | Esophagus | ESCC | response to unfolded protein | 107/8552 | 137/18723 | 7.01e-15 | 3.87e-13 | 107 |
| GO:005160418 | Esophagus | ESCC | protein maturation | 189/8552 | 294/18723 | 7.64e-11 | 2.39e-09 | 189 |
| GO:0070059111 | Esophagus | ESCC | intrinsic apoptotic signaling pathway in response to endoplasmic reticulum stress | 50/8552 | 63/18723 | 4.37e-08 | 7.96e-07 | 50 |
| GO:00067906 | Esophagus | ESCC | sulfur compound metabolic process | 201/8552 | 339/18723 | 2.64e-07 | 3.94e-06 | 201 |
| GO:00442725 | Esophagus | ESCC | sulfur compound biosynthetic process | 96/8552 | 148/18723 | 1.86e-06 | 2.16e-05 | 96 |
| GO:00072197 | Esophagus | ESCC | Notch signaling pathway | 106/8552 | 172/18723 | 1.74e-05 | 1.55e-04 | 106 |
| GO:001648514 | Esophagus | ESCC | protein processing | 134/8552 | 225/18723 | 1.81e-05 | 1.60e-04 | 134 |
| GO:00065757 | Esophagus | ESCC | cellular modified amino acid metabolic process | 112/8552 | 188/18723 | 8.31e-05 | 6.06e-04 | 112 |
| GO:0045746 | Esophagus | ESCC | negative regulation of Notch signaling pathway | 28/8552 | 36/18723 | 8.62e-05 | 6.22e-04 | 28 |
| GO:00423986 | Esophagus | ESCC | cellular modified amino acid biosynthetic process | 34/8552 | 46/18723 | 9.39e-05 | 6.70e-04 | 34 |
| GO:0045861111 | Esophagus | ESCC | negative regulation of proteolysis | 195/8552 | 351/18723 | 1.13e-04 | 7.85e-04 | 195 |
| GO:00085935 | Esophagus | ESCC | regulation of Notch signaling pathway | 59/8552 | 95/18723 | 9.12e-04 | 4.65e-03 | 59 |
| GO:000674912 | Esophagus | ESCC | glutathione metabolic process | 42/8552 | 64/18723 | 1.01e-03 | 5.12e-03 | 42 |
| GO:001095511 | Esophagus | ESCC | negative regulation of protein processing | 20/8552 | 29/18723 | 9.66e-03 | 3.34e-02 | 20 |
| GO:190331811 | Esophagus | ESCC | negative regulation of protein maturation | 20/8552 | 29/18723 | 9.66e-03 | 3.34e-02 | 20 |
| Page: 1 |
| Pathway ID | Tissue | Disease Stage | Description | Gene Ratio | Bg Ratio | pvalue | p.adjust | qvalue | Count |
| hsa0048018 | Esophagus | ESCC | Glutathione metabolism | 44/4205 | 57/8465 | 1.81e-05 | 9.03e-05 | 4.63e-05 | 44 |
| hsa0048019 | Esophagus | ESCC | Glutathione metabolism | 44/4205 | 57/8465 | 1.81e-05 | 9.03e-05 | 4.63e-05 | 44 |
| Page: 1 |
Top |
Cell-cell communication analysis |
| Identification of potential cell-cell interactions between two cell types and their ligand-receptor pairs for different disease states |
| Ligand | Receptor | LRpair | Pathway | Tissue | Disease Stage |
| Page: 1 |
Top |
Single-cell gene regulatory network inference analysis |
| Find out the significant the regulons (TFs) and the target genes of each regulon across cell types for different disease states |
| TF | Cell Type | Tissue | Disease Stage | Target Gene | RSS | Regulon Activity |
| ∗The dot plots of a searched regulon are shown for all cell subpopulations in each disease state of each tissue based on the regulon specific score inferred using pySCENIC and by calculating the average expression. |
| Page: 1 |
Top |
Somatic mutation of malignant transformation related genes |
| Annotation of somatic variants for genes involved in malignant transformation |
| Hugo Symbol | Variant Class | Variant Classification | dbSNP RS | HGVSc | HGVSp | HGVSp Short | SWISSPROT | BIOTYPE | SIFT | PolyPhen | Tumor Sample Barcode | Tissue | Histology | Sex | Age | Stage | Therapy Types | Drugs | Outcome |
| CHAC1 | SNV | Missense_Mutation | c.773N>C | p.Glu258Ala | p.E258A | Q9BUX1 | protein_coding | deleterious(0.01) | benign(0.091) | TCGA-B6-A0RL-01 | Breast | breast invasive carcinoma | Female | <65 | I/II | Unknown | Unknown | SD | |
| CHAC1 | insertion | Frame_Shift_Ins | novel | c.477_478insAT | p.Leu160IlefsTer22 | p.L160Ifs*22 | Q9BUX1 | protein_coding | TCGA-A2-A0D1-01 | Breast | breast invasive carcinoma | Female | >=65 | I/II | Chemotherapy | taxotere | SD | ||
| CHAC1 | insertion | Frame_Shift_Ins | novel | c.479_480insGCCCACCCTCAGCCTCCCAAAA | p.Gly161ProfsTer24 | p.G161Pfs*24 | Q9BUX1 | protein_coding | TCGA-A2-A0D1-01 | Breast | breast invasive carcinoma | Female | >=65 | I/II | Chemotherapy | taxotere | SD | ||
| CHAC1 | insertion | Frame_Shift_Ins | novel | c.770_771insTA | p.Glu258ThrfsTer66 | p.E258Tfs*66 | Q9BUX1 | protein_coding | TCGA-AO-A0JD-01 | Breast | breast invasive carcinoma | Female | <65 | III/IV | Chemotherapy | cyclophosphamide | SD | ||
| CHAC1 | SNV | Missense_Mutation | novel | c.520N>T | p.Asp174Tyr | p.D174Y | Q9BUX1 | protein_coding | deleterious(0.01) | probably_damaging(0.959) | TCGA-VS-A8EC-01 | Cervix | cervical & endocervical cancer | Female | <65 | III/IV | Chemotherapy | carboplatin | CR |
| CHAC1 | SNV | Missense_Mutation | c.428N>A | p.Gly143Glu | p.G143E | Q9BUX1 | protein_coding | tolerated(0.3) | benign(0.284) | TCGA-A6-5661-01 | Colorectum | colon adenocarcinoma | Female | >=65 | I/II | Unknown | Unknown | SD | |
| CHAC1 | SNV | Missense_Mutation | c.673G>A | p.Ala225Thr | p.A225T | Q9BUX1 | protein_coding | deleterious(0) | possibly_damaging(0.897) | TCGA-AA-3672-01 | Colorectum | colon adenocarcinoma | Female | >=65 | III/IV | Unknown | Unknown | SD | |
| CHAC1 | SNV | Missense_Mutation | c.617A>T | p.Gln206Leu | p.Q206L | Q9BUX1 | protein_coding | deleterious(0) | possibly_damaging(0.771) | TCGA-AA-A01K-01 | Colorectum | colon adenocarcinoma | Female | >=65 | III/IV | Chemotherapy | folinic | CR | |
| CHAC1 | SNV | Missense_Mutation | novel | c.385N>T | p.Asp129Tyr | p.D129Y | Q9BUX1 | protein_coding | deleterious(0.01) | probably_damaging(0.969) | TCGA-CA-6717-01 | Colorectum | colon adenocarcinoma | Male | <65 | I/II | Chemotherapy | oxaliplatin | CR |
| CHAC1 | SNV | Missense_Mutation | c.257N>T | p.Arg86Met | p.R86M | Q9BUX1 | protein_coding | deleterious(0) | possibly_damaging(0.722) | TCGA-G4-6302-01 | Colorectum | colon adenocarcinoma | Female | >=65 | I/II | Unknown | Unknown | SD |
| Page: 1 2 3 |
Top |
Related drugs of malignant transformation related genes |
| Identification of chemicals and drugs interact with genes involved in malignant transfromation |
| (DGIdb 4.0) |
| Entrez ID | Symbol | Category | Interaction Types | Drug Claim Name | Drug Name | PMIDs |
| Page: 1 |

Copyright 2023-Present -The University of Texas Health Science Center at Houston |