
|
|||||
|
 | |
| |
| |
| |
| |
| |
|
Gene: CFL2 |
Gene summary for CFL2 |
| Gene information | Species | Human | Gene symbol | CFL2 | Gene ID | 1073 |
| Gene name | cofilin 2 | |
| Gene Alias | NEM7 | |
| Cytomap | 14q13.1 | |
| Gene Type | protein-coding | GO ID | GO:0006928 | UniProtAcc | Q9Y281 |
Top |
Malignant transformation analysis |
| Identification of the aberrant gene expression in precancerous and cancerous lesions by comparing the gene expression of stem-like cells in diseased tissues with normal stem cells |
| Entrez ID | Symbol | Replicates | Species | Organ | Tissue | Adj P-value | Log2FC | Malignancy |
| 1073 | CFL2 | LZE4T | Human | Esophagus | ESCC | 1.03e-12 | 2.94e-01 | 0.0811 |
| 1073 | CFL2 | LZE7T | Human | Esophagus | ESCC | 9.25e-04 | 1.54e-01 | 0.0667 |
| 1073 | CFL2 | LZE8T | Human | Esophagus | ESCC | 1.01e-03 | 1.52e-01 | 0.067 |
| 1073 | CFL2 | LZE20T | Human | Esophagus | ESCC | 5.45e-05 | 8.25e-02 | 0.0662 |
| 1073 | CFL2 | LZE22T | Human | Esophagus | ESCC | 1.78e-04 | 6.98e-01 | 0.068 |
| 1073 | CFL2 | LZE24T | Human | Esophagus | ESCC | 5.54e-12 | 5.69e-01 | 0.0596 |
| 1073 | CFL2 | LZE6T | Human | Esophagus | ESCC | 4.99e-06 | 3.23e-01 | 0.0845 |
| 1073 | CFL2 | P2T-E | Human | Esophagus | ESCC | 2.55e-12 | 2.68e-01 | 0.1177 |
| 1073 | CFL2 | P4T-E | Human | Esophagus | ESCC | 2.38e-17 | 6.18e-01 | 0.1323 |
| 1073 | CFL2 | P5T-E | Human | Esophagus | ESCC | 1.57e-11 | 2.72e-01 | 0.1327 |
| 1073 | CFL2 | P8T-E | Human | Esophagus | ESCC | 1.67e-64 | 1.44e+00 | 0.0889 |
| 1073 | CFL2 | P9T-E | Human | Esophagus | ESCC | 5.03e-11 | 3.37e-01 | 0.1131 |
| 1073 | CFL2 | P10T-E | Human | Esophagus | ESCC | 4.83e-13 | 2.82e-01 | 0.116 |
| 1073 | CFL2 | P11T-E | Human | Esophagus | ESCC | 1.07e-09 | 3.55e-01 | 0.1426 |
| 1073 | CFL2 | P12T-E | Human | Esophagus | ESCC | 2.61e-61 | 1.30e+00 | 0.1122 |
| 1073 | CFL2 | P15T-E | Human | Esophagus | ESCC | 1.23e-23 | 6.58e-01 | 0.1149 |
| 1073 | CFL2 | P16T-E | Human | Esophagus | ESCC | 1.22e-04 | 7.03e-02 | 0.1153 |
| 1073 | CFL2 | P17T-E | Human | Esophagus | ESCC | 8.12e-04 | 2.55e-01 | 0.1278 |
| 1073 | CFL2 | P19T-E | Human | Esophagus | ESCC | 2.18e-09 | 8.18e-01 | 0.1662 |
| 1073 | CFL2 | P20T-E | Human | Esophagus | ESCC | 4.53e-03 | 1.37e-01 | 0.1124 |
| Page: 1 2 3 4 5 6 |
| Tissue | Expression Dynamics | Abbreviation |
| Esophagus |  | ESCC: Esophageal squamous cell carcinoma |
| HGIN: High-grade intraepithelial neoplasias | ||
| LGIN: Low-grade intraepithelial neoplasias | ||
| Liver | 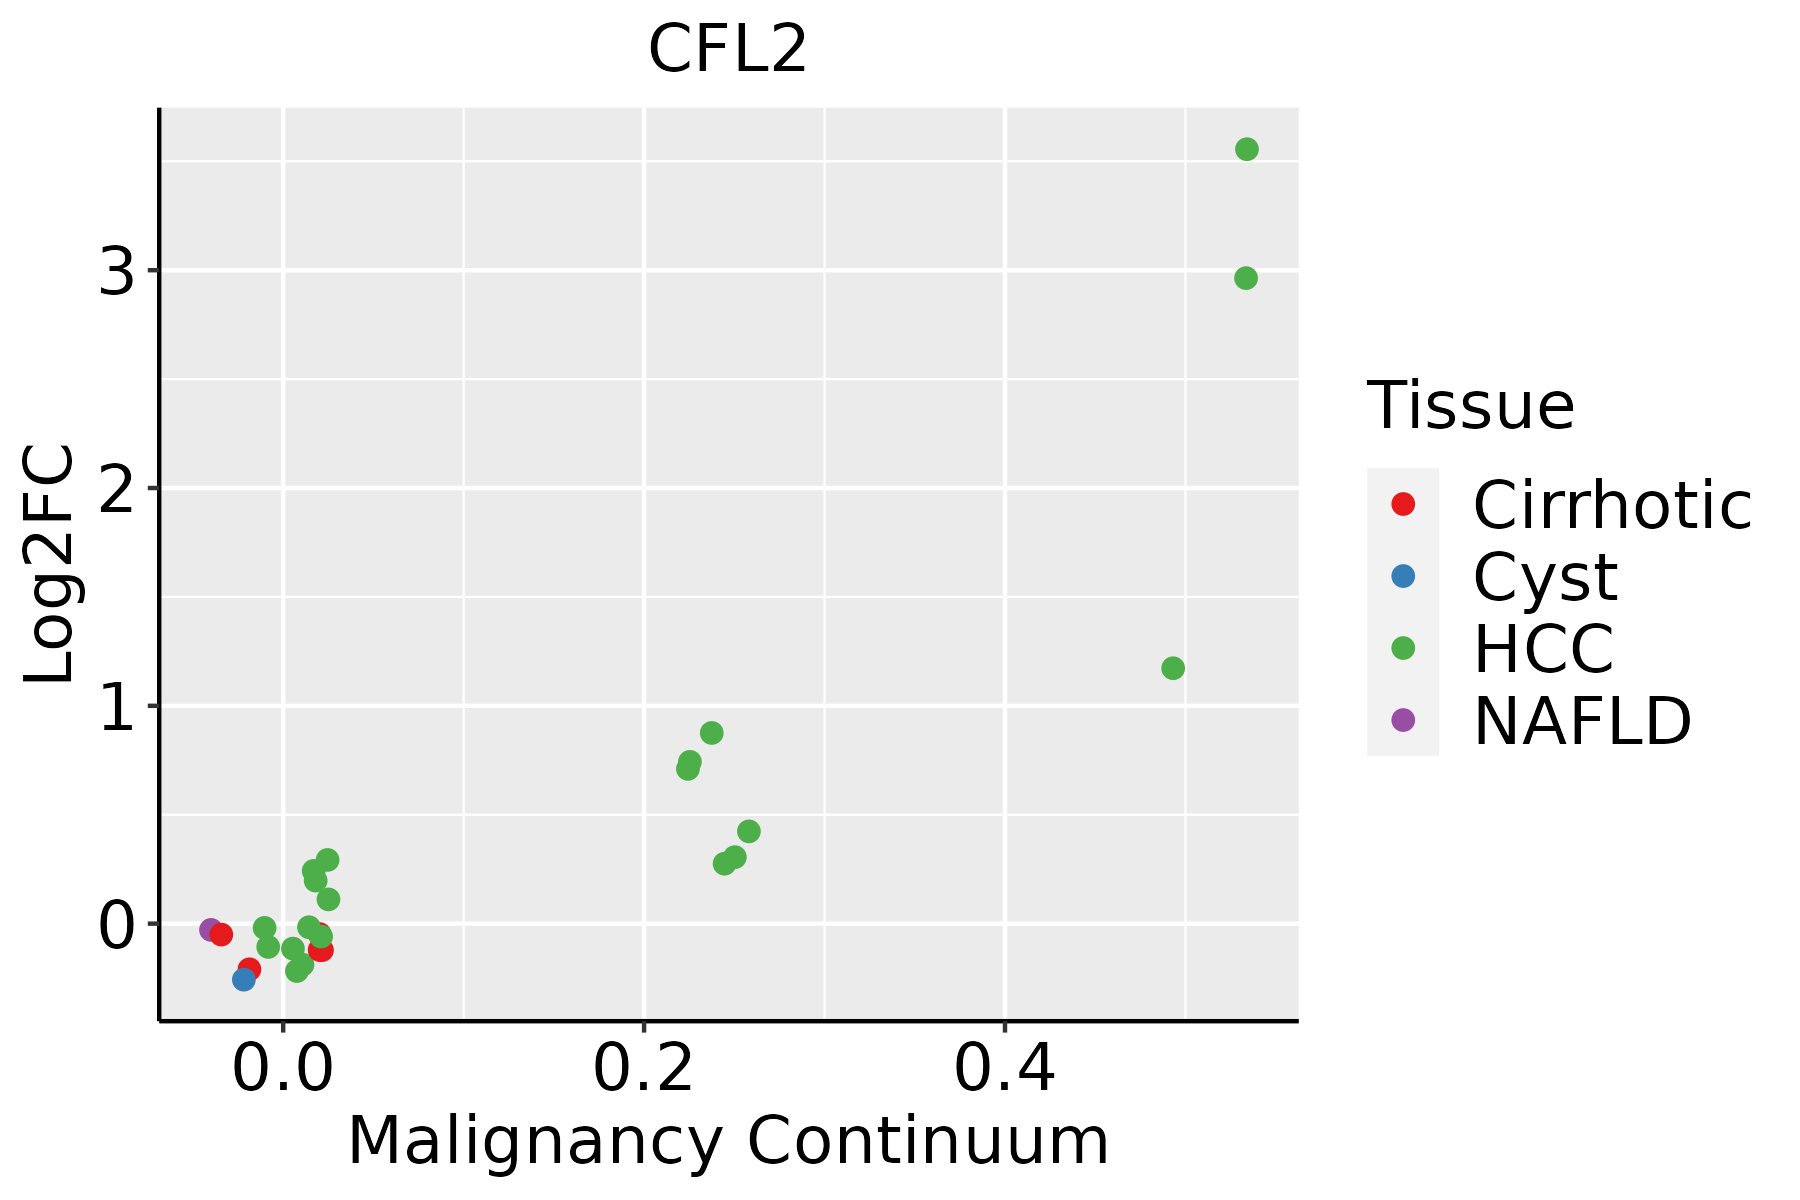 | HCC: Hepatocellular carcinoma |
| NAFLD: Non-alcoholic fatty liver disease | ||
| Oral Cavity | 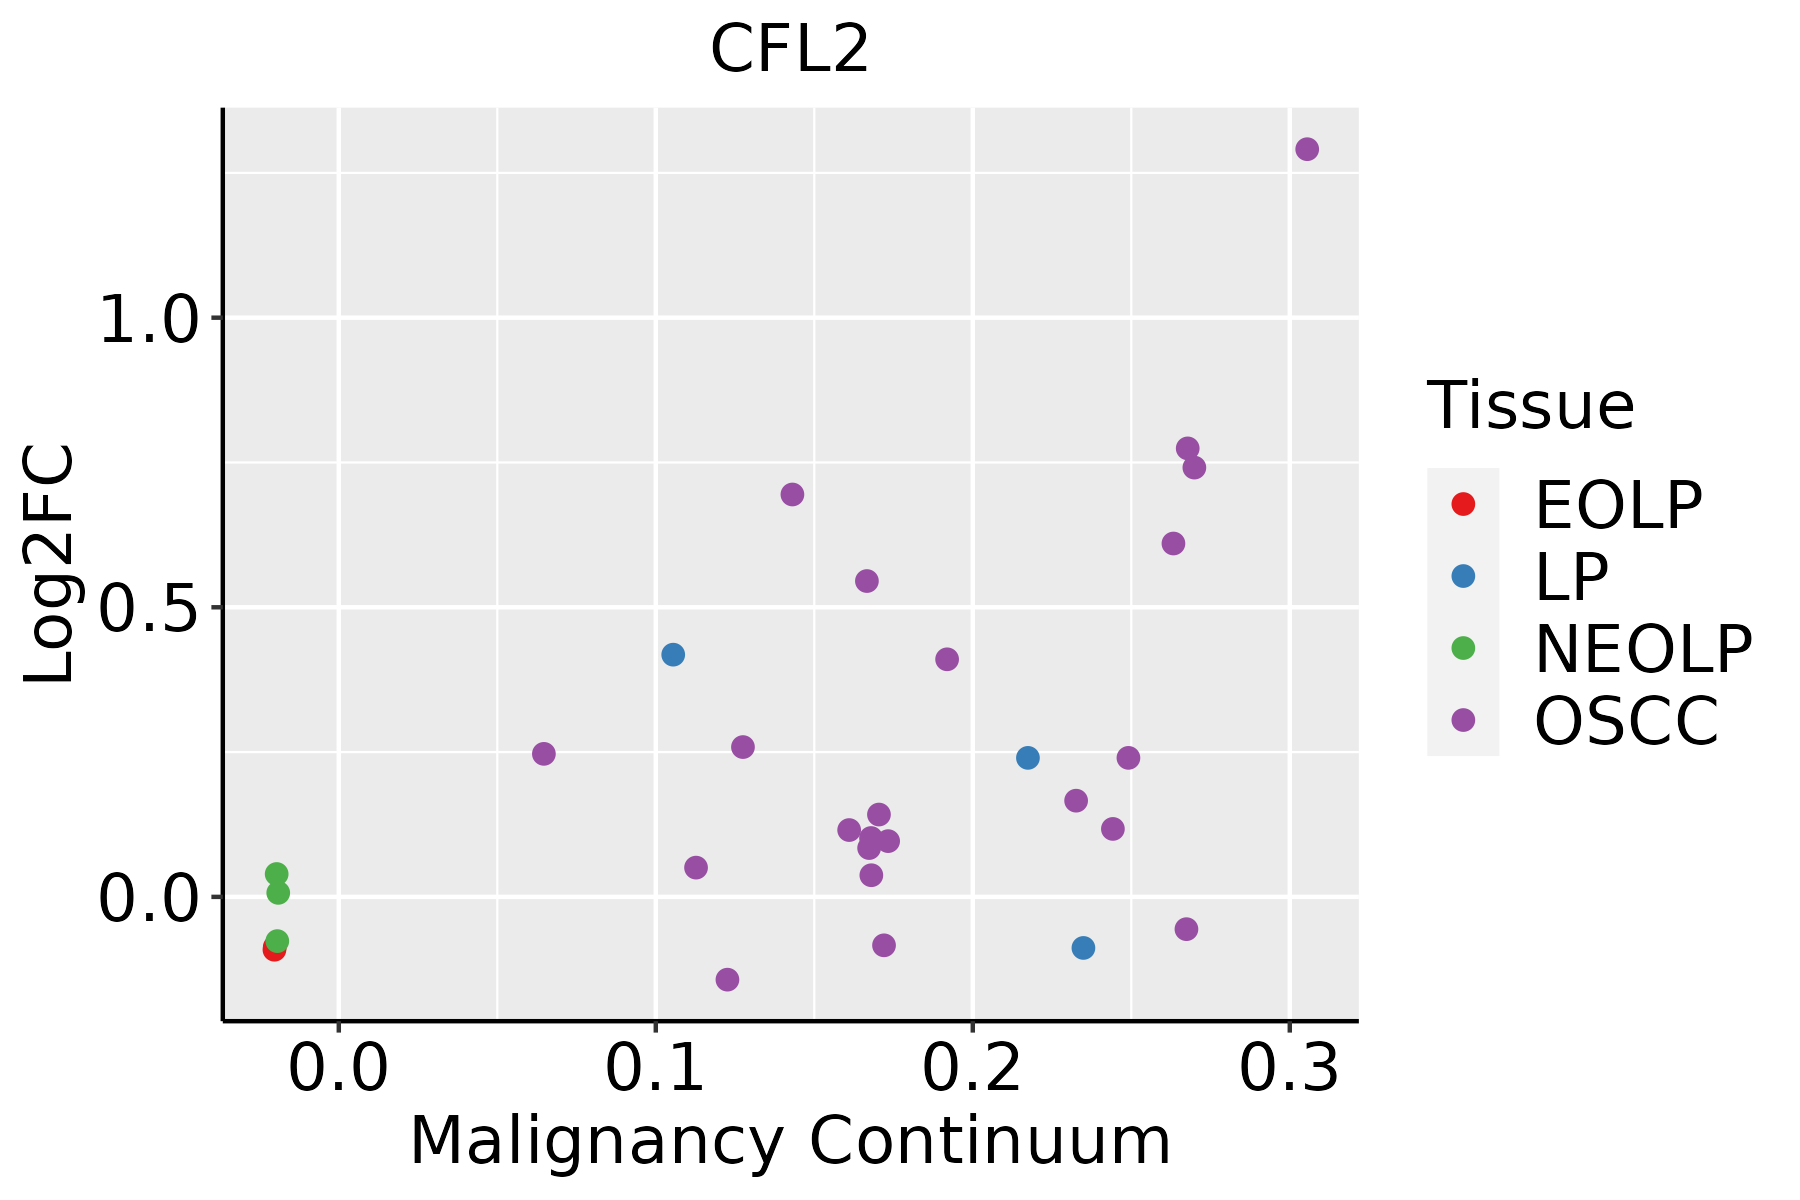 | EOLP: Erosive Oral lichen planus |
| LP: leukoplakia | ||
| NEOLP: Non-erosive oral lichen planus | ||
| OSCC: Oral squamous cell carcinoma | ||
| Thyroid |  | ATC: Anaplastic thyroid cancer |
| HT: Hashimoto's thyroiditis | ||
| PTC: Papillary thyroid cancer |
| ∗log2FC in expression of this searched gene in stem-like cells from each diseased tissue sample relative to stem-like cells in normal samples in each tissue plotted against the malignancy continuum. Samples are colored based on if they are from different disease stage. |
Top |
Malignant transformation related pathway analysis |
| Find out the enriched GO biological processes and KEGG pathways involved in transition from healthy to precancer to cancer |
| Tissue | Disease Stage | Enriched GO biological Processes |
| Colorectum | AD |  |
| Colorectum | SER |  |
| Colorectum | MSS |  |
| Colorectum | MSI-H |  |
| Colorectum | FAP |  |
| ∗Top 15 enriched GO BP terms are showed in the bar plot of each disease state in each tissue. Each row represents a significant GO biological process which is colored according to the -log10(p.adjust). |
| Page: 1 2 3 4 5 6 7 8 9 |
| GO ID | Tissue | Disease Stage | Description | Gene Ratio | Bg Ratio | pvalue | p.adjust | Count |
| GO:0022411111 | Esophagus | ESCC | cellular component disassembly | 305/8552 | 443/18723 | 1.94e-23 | 4.57e-21 | 305 |
| GO:003298416 | Esophagus | ESCC | protein-containing complex disassembly | 151/8552 | 224/18723 | 3.45e-11 | 1.15e-09 | 151 |
| GO:1902905111 | Esophagus | ESCC | positive regulation of supramolecular fiber organization | 142/8552 | 209/18723 | 5.51e-11 | 1.76e-09 | 142 |
| GO:1902903111 | Esophagus | ESCC | regulation of supramolecular fiber organization | 237/8552 | 383/18723 | 9.06e-11 | 2.75e-09 | 237 |
| GO:005149520 | Esophagus | ESCC | positive regulation of cytoskeleton organization | 147/8552 | 226/18723 | 2.93e-09 | 6.38e-08 | 147 |
| GO:000701527 | Esophagus | ESCC | actin filament organization | 259/8552 | 442/18723 | 2.37e-08 | 4.50e-07 | 259 |
| GO:003253520 | Esophagus | ESCC | regulation of cellular component size | 227/8552 | 383/18723 | 4.77e-08 | 8.60e-07 | 227 |
| GO:0032970111 | Esophagus | ESCC | regulation of actin filament-based process | 231/8552 | 397/18723 | 2.91e-07 | 4.20e-06 | 231 |
| GO:0032956111 | Esophagus | ESCC | regulation of actin cytoskeleton organization | 210/8552 | 358/18723 | 4.40e-07 | 6.00e-06 | 210 |
| GO:011005327 | Esophagus | ESCC | regulation of actin filament organization | 166/8552 | 278/18723 | 1.54e-06 | 1.85e-05 | 166 |
| GO:000815420 | Esophagus | ESCC | actin polymerization or depolymerization | 130/8552 | 218/18723 | 2.19e-05 | 1.88e-04 | 130 |
| GO:000806419 | Esophagus | ESCC | regulation of actin polymerization or depolymerization | 112/8552 | 188/18723 | 8.31e-05 | 6.06e-04 | 112 |
| GO:003083218 | Esophagus | ESCC | regulation of actin filament length | 112/8552 | 189/18723 | 1.13e-04 | 7.85e-04 | 112 |
| GO:00432446 | Esophagus | ESCC | regulation of protein-containing complex disassembly | 75/8552 | 121/18723 | 2.17e-04 | 1.36e-03 | 75 |
| GO:006053716 | Esophagus | ESCC | muscle tissue development | 211/8552 | 403/18723 | 3.84e-03 | 1.56e-02 | 211 |
| GO:00436245 | Esophagus | ESCC | cellular protein complex disassembly | 78/8552 | 136/18723 | 4.00e-03 | 1.62e-02 | 78 |
| GO:003103219 | Esophagus | ESCC | actomyosin structure organization | 108/8552 | 196/18723 | 4.86e-03 | 1.88e-02 | 108 |
| GO:001470615 | Esophagus | ESCC | striated muscle tissue development | 197/8552 | 384/18723 | 1.46e-02 | 4.74e-02 | 197 |
| GO:00224117 | Liver | Cirrhotic | cellular component disassembly | 182/4634 | 443/18723 | 1.59e-14 | 1.54e-12 | 182 |
| GO:000701512 | Liver | Cirrhotic | actin filament organization | 171/4634 | 442/18723 | 3.93e-11 | 2.30e-09 | 171 |
| Page: 1 2 3 4 5 6 7 8 9 |
| Pathway ID | Tissue | Disease Stage | Description | Gene Ratio | Bg Ratio | pvalue | p.adjust | qvalue | Count |
| hsa05170210 | Esophagus | ESCC | Human immunodeficiency virus 1 infection | 147/4205 | 212/8465 | 3.37e-09 | 3.53e-08 | 1.81e-08 | 147 |
| hsa0466620 | Esophagus | ESCC | Fc gamma R-mediated phagocytosis | 63/4205 | 97/8465 | 1.63e-03 | 4.89e-03 | 2.50e-03 | 63 |
| hsa0436016 | Esophagus | ESCC | Axon guidance | 108/4205 | 182/8465 | 5.13e-03 | 1.30e-02 | 6.67e-03 | 108 |
| hsa0481028 | Esophagus | ESCC | Regulation of actin cytoskeleton | 133/4205 | 229/8465 | 5.94e-03 | 1.48e-02 | 7.56e-03 | 133 |
| hsa051339 | Esophagus | ESCC | Pertussis | 48/4205 | 76/8465 | 1.21e-02 | 2.77e-02 | 1.42e-02 | 48 |
| hsa0517038 | Esophagus | ESCC | Human immunodeficiency virus 1 infection | 147/4205 | 212/8465 | 3.37e-09 | 3.53e-08 | 1.81e-08 | 147 |
| hsa04666110 | Esophagus | ESCC | Fc gamma R-mediated phagocytosis | 63/4205 | 97/8465 | 1.63e-03 | 4.89e-03 | 2.50e-03 | 63 |
| hsa0436017 | Esophagus | ESCC | Axon guidance | 108/4205 | 182/8465 | 5.13e-03 | 1.30e-02 | 6.67e-03 | 108 |
| hsa04810112 | Esophagus | ESCC | Regulation of actin cytoskeleton | 133/4205 | 229/8465 | 5.94e-03 | 1.48e-02 | 7.56e-03 | 133 |
| hsa0513314 | Esophagus | ESCC | Pertussis | 48/4205 | 76/8465 | 1.21e-02 | 2.77e-02 | 1.42e-02 | 48 |
| hsa0481021 | Liver | Cirrhotic | Regulation of actin cytoskeleton | 100/2530 | 229/8465 | 5.28e-06 | 5.50e-05 | 3.39e-05 | 100 |
| hsa05133 | Liver | Cirrhotic | Pertussis | 37/2530 | 76/8465 | 4.17e-04 | 2.57e-03 | 1.58e-03 | 37 |
| hsa0481031 | Liver | Cirrhotic | Regulation of actin cytoskeleton | 100/2530 | 229/8465 | 5.28e-06 | 5.50e-05 | 3.39e-05 | 100 |
| hsa051331 | Liver | Cirrhotic | Pertussis | 37/2530 | 76/8465 | 4.17e-04 | 2.57e-03 | 1.58e-03 | 37 |
| hsa0481041 | Liver | HCC | Regulation of actin cytoskeleton | 134/4020 | 229/8465 | 4.48e-04 | 1.94e-03 | 1.08e-03 | 134 |
| hsa051709 | Liver | HCC | Human immunodeficiency virus 1 infection | 125/4020 | 212/8465 | 4.51e-04 | 1.94e-03 | 1.08e-03 | 125 |
| hsa051332 | Liver | HCC | Pertussis | 48/4020 | 76/8465 | 4.17e-03 | 1.27e-02 | 7.06e-03 | 48 |
| hsa0466610 | Liver | HCC | Fc gamma R-mediated phagocytosis | 58/4020 | 97/8465 | 9.65e-03 | 2.52e-02 | 1.40e-02 | 58 |
| hsa0481051 | Liver | HCC | Regulation of actin cytoskeleton | 134/4020 | 229/8465 | 4.48e-04 | 1.94e-03 | 1.08e-03 | 134 |
| hsa0517012 | Liver | HCC | Human immunodeficiency virus 1 infection | 125/4020 | 212/8465 | 4.51e-04 | 1.94e-03 | 1.08e-03 | 125 |
| Page: 1 2 |
Top |
Cell-cell communication analysis |
| Identification of potential cell-cell interactions between two cell types and their ligand-receptor pairs for different disease states |
| Ligand | Receptor | LRpair | Pathway | Tissue | Disease Stage |
| Page: 1 |
Top |
Single-cell gene regulatory network inference analysis |
| Find out the significant the regulons (TFs) and the target genes of each regulon across cell types for different disease states |
| TF | Cell Type | Tissue | Disease Stage | Target Gene | RSS | Regulon Activity |
| CFL2 | TFC | Thyroid | Healthy | MT2P1,SNRNP27,RBMX2, etc. | 3.13e-01 |  |
| ∗The dot plots of a searched regulon are shown for all cell subpopulations in each disease state of each tissue based on the regulon specific score inferred using pySCENIC and by calculating the average expression. |
| Page: 1 |
Top |
Somatic mutation of malignant transformation related genes |
| Annotation of somatic variants for genes involved in malignant transformation |
| Hugo Symbol | Variant Class | Variant Classification | dbSNP RS | HGVSc | HGVSp | HGVSp Short | SWISSPROT | BIOTYPE | SIFT | PolyPhen | Tumor Sample Barcode | Tissue | Histology | Sex | Age | Stage | Therapy Types | Drugs | Outcome |
| CFL2 | SNV | Missense_Mutation | novel | c.71N>A | p.Ser24Tyr | p.S24Y | Q9Y281 | protein_coding | tolerated(0.11) | possibly_damaging(0.71) | TCGA-AN-A046-01 | Breast | breast invasive carcinoma | Female | >=65 | I/II | Unknown | Unknown | SD |
| CFL2 | SNV | Missense_Mutation | novel | c.65N>C | p.Lys22Thr | p.K22T | Q9Y281 | protein_coding | deleterious(0) | possibly_damaging(0.795) | TCGA-AZ-4315-01 | Colorectum | colon adenocarcinoma | Male | <65 | I/II | Unknown | Unknown | SD |
| CFL2 | SNV | Missense_Mutation | novel | c.188C>A | p.Thr63Asn | p.T63N | Q9Y281 | protein_coding | tolerated(0.11) | benign(0.019) | TCGA-CA-6717-01 | Colorectum | colon adenocarcinoma | Male | <65 | I/II | Chemotherapy | oxaliplatin | CR |
| CFL2 | SNV | Missense_Mutation | novel | c.95G>T | p.Arg32Ile | p.R32I | Q9Y281 | protein_coding | deleterious(0) | probably_damaging(0.96) | TCGA-A5-A0G2-01 | Endometrium | uterine corpus endometrioid carcinoma | Female | <65 | III/IV | Unknown | Unknown | SD |
| CFL2 | SNV | Missense_Mutation | c.93G>T | p.Lys31Asn | p.K31N | Q9Y281 | protein_coding | deleterious(0.03) | benign(0.354) | TCGA-AP-A056-01 | Endometrium | uterine corpus endometrioid carcinoma | Female | <65 | I/II | Unknown | Unknown | SD | |
| CFL2 | SNV | Missense_Mutation | c.114N>A | p.Phe38Leu | p.F38L | Q9Y281 | protein_coding | deleterious(0.04) | benign(0.432) | TCGA-AP-A0LM-01 | Endometrium | uterine corpus endometrioid carcinoma | Female | <65 | III/IV | Chemotherapy | cisplatin | SD | |
| CFL2 | SNV | Missense_Mutation | rs757526740 | c.440C>T | p.Ser147Leu | p.S147L | Q9Y281 | protein_coding | tolerated(0.4) | benign(0.142) | TCGA-BS-A0UF-01 | Endometrium | uterine corpus endometrioid carcinoma | Female | >=65 | I/II | Unknown | Unknown | SD |
| CFL2 | SNV | Missense_Mutation | c.22N>C | p.Asn8His | p.N8H | Q9Y281 | protein_coding | tolerated(0.18) | benign(0.007) | TCGA-D1-A16Y-01 | Endometrium | uterine corpus endometrioid carcinoma | Female | <65 | I/II | Unknown | Unknown | SD | |
| CFL2 | SNV | Missense_Mutation | c.410N>C | p.Val137Ala | p.V137A | Q9Y281 | protein_coding | tolerated(0.88) | benign(0.019) | TCGA-D1-A17H-01 | Endometrium | uterine corpus endometrioid carcinoma | Female | <65 | I/II | Unknown | Unknown | SD | |
| CFL2 | SNV | Missense_Mutation | c.209N>A | p.Ser70Tyr | p.S70Y | Q9Y281 | protein_coding | tolerated(0.07) | benign(0.015) | TCGA-D1-A17Q-01 | Endometrium | uterine corpus endometrioid carcinoma | Female | <65 | I/II | Unknown | Unknown | SD |
| Page: 1 2 |
Top |
Related drugs of malignant transformation related genes |
| Identification of chemicals and drugs interact with genes involved in malignant transfromation |
| (DGIdb 4.0) |
| Entrez ID | Symbol | Category | Interaction Types | Drug Claim Name | Drug Name | PMIDs |
| Page: 1 |

Copyright 2023-Present -The University of Texas Health Science Center at Houston |