
|
|||||
|
 | |
| |
| |
| |
| |
| |
|
Gene: CFL1 |
Gene summary for CFL1 |
| Gene information | Species | Human | Gene symbol | CFL1 | Gene ID | 1072 |
| Gene name | cofilin 1 | |
| Gene Alias | CFL | |
| Cytomap | 11q13.1 | |
| Gene Type | protein-coding | GO ID | GO:0000226 | UniProtAcc | P23528 |
Top |
Malignant transformation analysis |
| Identification of the aberrant gene expression in precancerous and cancerous lesions by comparing the gene expression of stem-like cells in diseased tissues with normal stem cells |
| Entrez ID | Symbol | Replicates | Species | Organ | Tissue | Adj P-value | Log2FC | Malignancy |
| 1072 | CFL1 | CA_HPV_1 | Human | Cervix | CC | 6.93e-16 | 1.85e-01 | 0.0264 |
| 1072 | CFL1 | CA_HPV_3 | Human | Cervix | CC | 4.60e-02 | 5.68e-02 | 0.0414 |
| 1072 | CFL1 | N_HPV_1 | Human | Cervix | N_HPV | 1.23e-04 | 1.77e-01 | 0.0079 |
| 1072 | CFL1 | N_HPV_2 | Human | Cervix | N_HPV | 2.75e-03 | 2.35e-01 | -0.0131 |
| 1072 | CFL1 | CCI_1 | Human | Cervix | CC | 7.77e-25 | -1.21e+00 | 0.528 |
| 1072 | CFL1 | CCI_2 | Human | Cervix | CC | 2.09e-02 | -2.01e-01 | 0.5249 |
| 1072 | CFL1 | CCI_3 | Human | Cervix | CC | 1.94e-27 | -1.12e+00 | 0.516 |
| 1072 | CFL1 | CCII_1 | Human | Cervix | CC | 2.13e-45 | -1.25e+00 | 0.3249 |
| 1072 | CFL1 | Tumor | Human | Cervix | CC | 9.03e-09 | 2.88e-01 | 0.1241 |
| 1072 | CFL1 | sample1 | Human | Cervix | CC | 5.76e-03 | 2.83e-01 | 0.0959 |
| 1072 | CFL1 | sample3 | Human | Cervix | CC | 1.28e-07 | 2.49e-01 | 0.1387 |
| 1072 | CFL1 | H2 | Human | Cervix | HSIL_HPV | 6.31e-04 | -2.79e-01 | 0.0632 |
| 1072 | CFL1 | L1 | Human | Cervix | CC | 4.84e-05 | 1.38e-01 | 0.0802 |
| 1072 | CFL1 | T3 | Human | Cervix | CC | 2.73e-03 | 2.55e-01 | 0.1389 |
| 1072 | CFL1 | HTA11_3410_2000001011 | Human | Colorectum | AD | 7.52e-97 | 2.03e+00 | 0.0155 |
| 1072 | CFL1 | HTA11_2487_2000001011 | Human | Colorectum | SER | 1.56e-75 | 3.79e+00 | -0.1808 |
| 1072 | CFL1 | HTA11_2951_2000001011 | Human | Colorectum | AD | 2.06e-26 | 2.33e+00 | 0.0216 |
| 1072 | CFL1 | HTA11_1938_2000001011 | Human | Colorectum | AD | 4.65e-65 | 3.50e+00 | -0.0811 |
| 1072 | CFL1 | HTA11_78_2000001011 | Human | Colorectum | AD | 7.63e-65 | 2.28e+00 | -0.1088 |
| 1072 | CFL1 | HTA11_347_2000001011 | Human | Colorectum | AD | 2.76e-121 | 3.33e+00 | -0.1954 |
| Page: 1 2 3 4 5 6 7 8 9 10 11 12 13 14 15 |
| Tissue | Expression Dynamics | Abbreviation |
| Cervix | 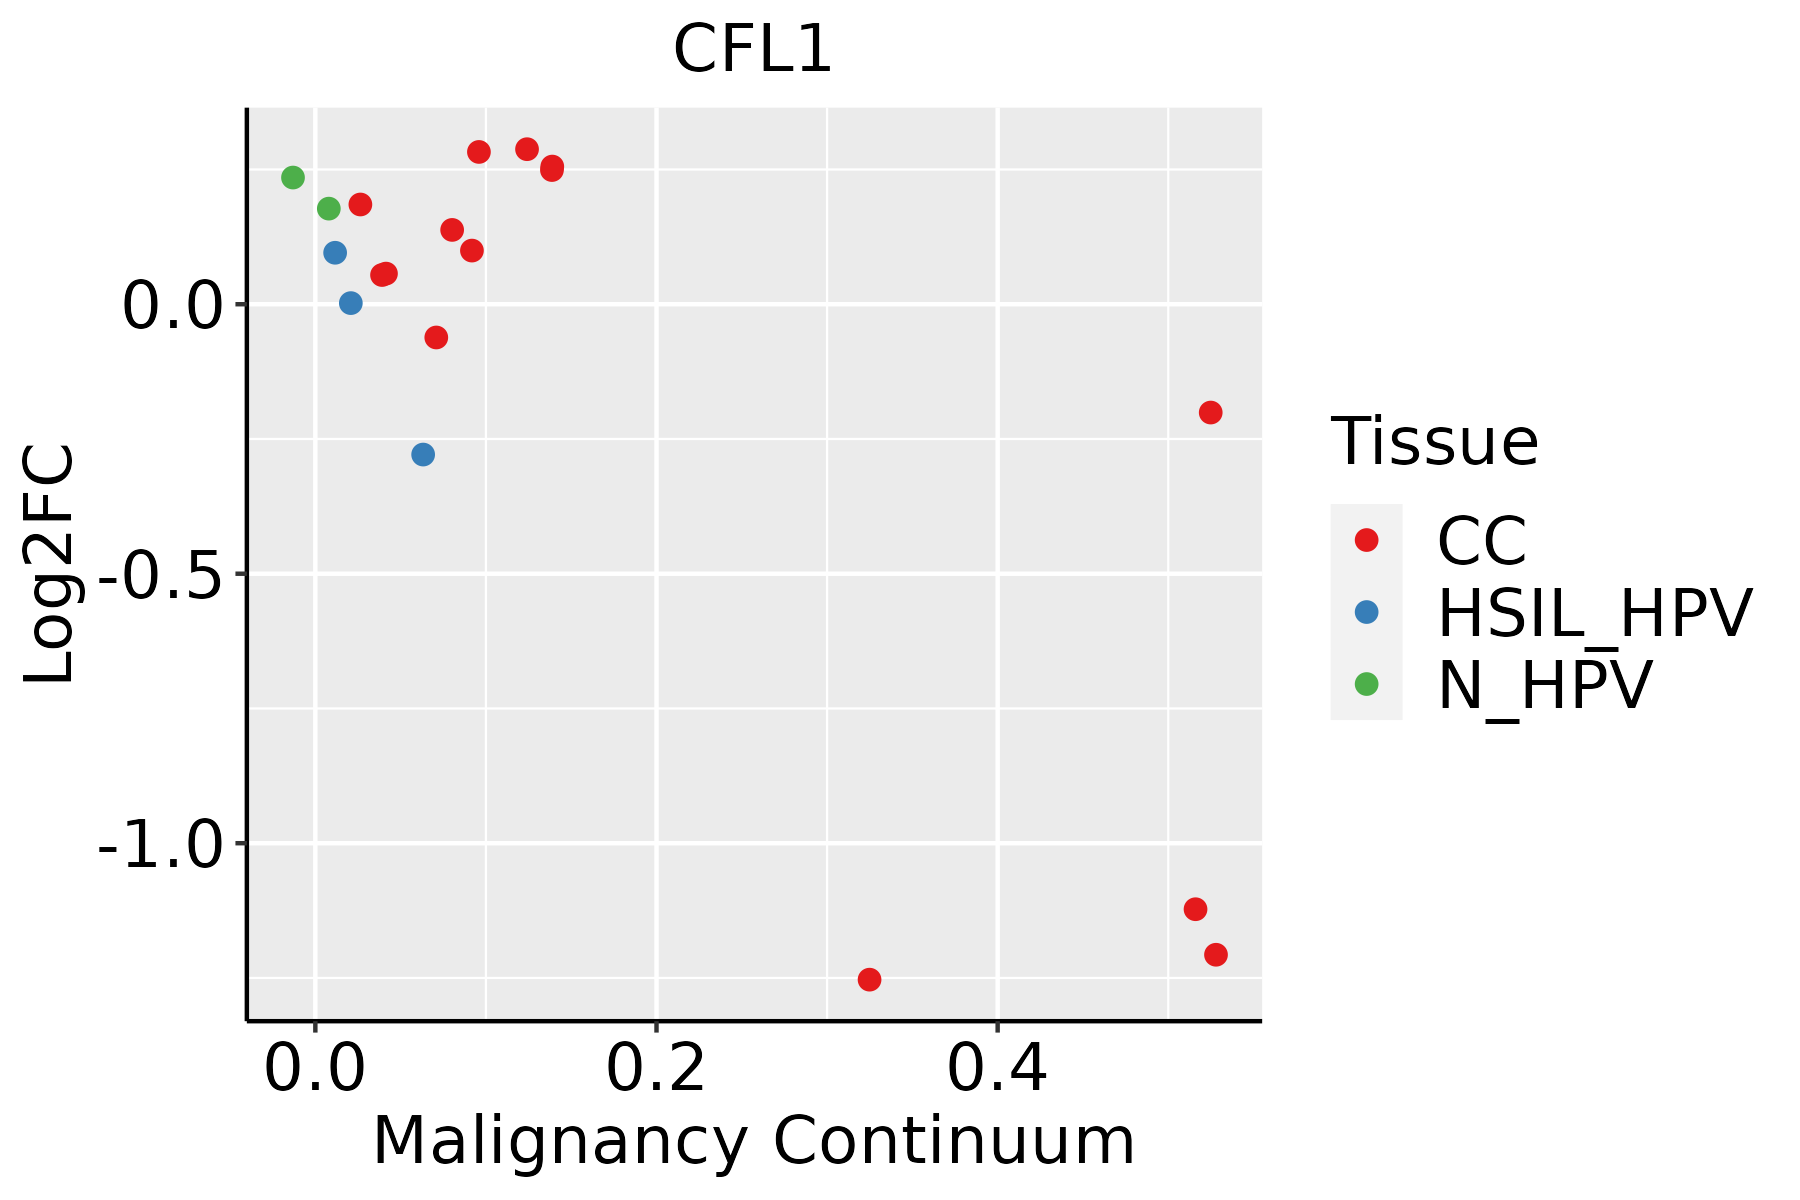 | CC: Cervix cancer |
| HSIL_HPV: HPV-infected high-grade squamous intraepithelial lesions | ||
| N_HPV: HPV-infected normal cervix | ||
| Colorectum (GSE201348) |  | FAP: Familial adenomatous polyposis |
| CRC: Colorectal cancer | ||
| Colorectum (HTA11) |  | AD: Adenomas |
| SER: Sessile serrated lesions | ||
| MSI-H: Microsatellite-high colorectal cancer | ||
| MSS: Microsatellite stable colorectal cancer | ||
| Endometrium |  | AEH: Atypical endometrial hyperplasia |
| EEC: Endometrioid Cancer | ||
| Esophagus |  | ESCC: Esophageal squamous cell carcinoma |
| HGIN: High-grade intraepithelial neoplasias | ||
| LGIN: Low-grade intraepithelial neoplasias | ||
| Liver |  | HCC: Hepatocellular carcinoma |
| NAFLD: Non-alcoholic fatty liver disease | ||
| Lung |  | AAH: Atypical adenomatous hyperplasia |
| AIS: Adenocarcinoma in situ | ||
| IAC: Invasive lung adenocarcinoma | ||
| MIA: Minimally invasive adenocarcinoma | ||
| Oral Cavity |  | EOLP: Erosive Oral lichen planus |
| LP: leukoplakia | ||
| NEOLP: Non-erosive oral lichen planus | ||
| OSCC: Oral squamous cell carcinoma | ||
| Prostate |  | BPH: Benign Prostatic Hyperplasia |
| Skin | 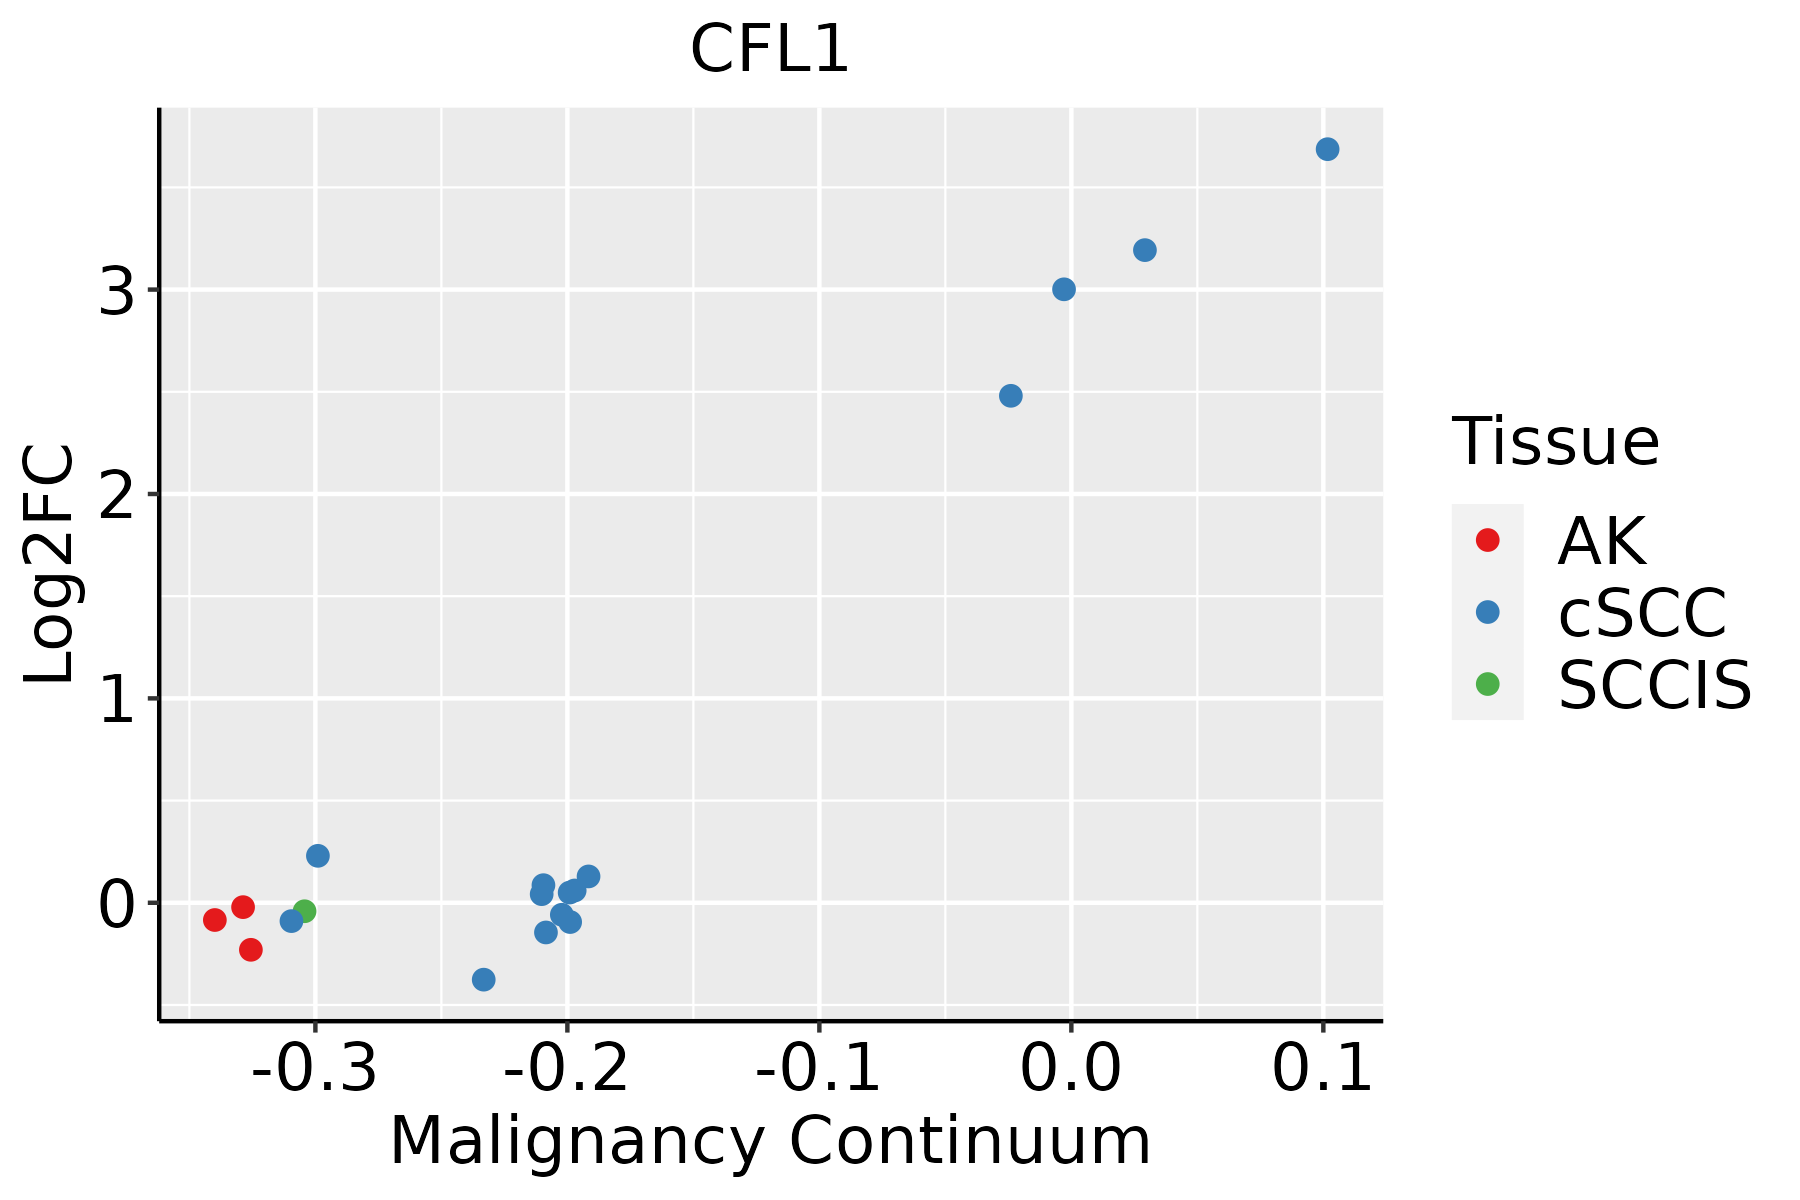 | AK: Actinic keratosis |
| cSCC: Cutaneous squamous cell carcinoma | ||
| SCCIS:squamous cell carcinoma in situ | ||
| Thyroid |  | ATC: Anaplastic thyroid cancer |
| HT: Hashimoto's thyroiditis | ||
| PTC: Papillary thyroid cancer |
| ∗log2FC in expression of this searched gene in stem-like cells from each diseased tissue sample relative to stem-like cells in normal samples in each tissue plotted against the malignancy continuum. Samples are colored based on if they are from different disease stage. |
Top |
Malignant transformation related pathway analysis |
| Find out the enriched GO biological processes and KEGG pathways involved in transition from healthy to precancer to cancer |
| Tissue | Disease Stage | Enriched GO biological Processes |
| Colorectum | AD |  |
| Colorectum | SER |  |
| Colorectum | MSS |  |
| Colorectum | MSI-H |  |
| Colorectum | FAP |  |
| ∗Top 15 enriched GO BP terms are showed in the bar plot of each disease state in each tissue. Each row represents a significant GO biological process which is colored according to the -log10(p.adjust). |
| Page: 1 2 3 4 5 6 7 8 9 |
| GO ID | Tissue | Disease Stage | Description | Gene Ratio | Bg Ratio | pvalue | p.adjust | Count |
| GO:001603210 | Cervix | CC | viral process | 109/2311 | 415/18723 | 5.40e-15 | 6.46e-12 | 109 |
| GO:000701510 | Cervix | CC | actin filament organization | 109/2311 | 442/18723 | 4.92e-13 | 2.45e-10 | 109 |
| GO:002260410 | Cervix | CC | regulation of cell morphogenesis | 84/2311 | 309/18723 | 1.00e-12 | 4.29e-10 | 84 |
| GO:004440310 | Cervix | CC | biological process involved in symbiotic interaction | 71/2311 | 290/18723 | 7.94e-09 | 6.98e-07 | 71 |
| GO:00072656 | Cervix | CC | Ras protein signal transduction | 79/2311 | 337/18723 | 9.49e-09 | 7.77e-07 | 79 |
| GO:00163587 | Cervix | CC | dendrite development | 58/2311 | 243/18723 | 4.52e-07 | 1.76e-05 | 58 |
| GO:00081549 | Cervix | CC | actin polymerization or depolymerization | 51/2311 | 218/18723 | 4.05e-06 | 1.05e-04 | 51 |
| GO:00109757 | Cervix | CC | regulation of neuron projection development | 88/2311 | 445/18723 | 4.26e-06 | 1.09e-04 | 88 |
| GO:00609965 | Cervix | CC | dendritic spine development | 28/2311 | 99/18723 | 1.61e-05 | 3.15e-04 | 28 |
| GO:00072666 | Cervix | CC | Rho protein signal transduction | 35/2311 | 137/18723 | 1.77e-05 | 3.33e-04 | 35 |
| GO:00096158 | Cervix | CC | response to virus | 73/2311 | 367/18723 | 2.22e-05 | 3.95e-04 | 73 |
| GO:00516567 | Cervix | CC | establishment of organelle localization | 76/2311 | 390/18723 | 3.17e-05 | 5.21e-04 | 76 |
| GO:002241110 | Cervix | CC | cellular component disassembly | 83/2311 | 443/18723 | 6.04e-05 | 8.68e-04 | 83 |
| GO:00459955 | Cervix | CC | regulation of embryonic development | 19/2311 | 64/18723 | 1.78e-04 | 2.09e-03 | 19 |
| GO:00488135 | Cervix | CC | dendrite morphogenesis | 30/2311 | 146/18723 | 3.27e-03 | 2.13e-02 | 30 |
| GO:01060277 | Cervix | CC | neuron projection organization | 21/2311 | 93/18723 | 4.10e-03 | 2.54e-02 | 21 |
| GO:00329847 | Cervix | CC | protein-containing complex disassembly | 41/2311 | 224/18723 | 6.13e-03 | 3.48e-02 | 41 |
| GO:00510143 | Cervix | CC | actin filament severing | 6/2311 | 16/18723 | 9.35e-03 | 4.66e-02 | 6 |
| GO:00610014 | Cervix | CC | regulation of dendritic spine morphogenesis | 12/2311 | 47/18723 | 1.01e-02 | 4.91e-02 | 12 |
| GO:004440315 | Cervix | HSIL_HPV | biological process involved in symbiotic interaction | 33/737 | 290/18723 | 4.67e-08 | 3.59e-06 | 33 |
| Page: 1 2 3 4 5 6 7 8 9 10 11 12 13 14 15 16 17 18 19 20 21 22 23 24 25 26 27 28 |
| Pathway ID | Tissue | Disease Stage | Description | Gene Ratio | Bg Ratio | pvalue | p.adjust | qvalue | Count |
| hsa0481016 | Cervix | CC | Regulation of actin cytoskeleton | 64/1267 | 229/8465 | 2.24e-07 | 2.59e-06 | 1.53e-06 | 64 |
| hsa0466612 | Cervix | CC | Fc gamma R-mediated phagocytosis | 31/1267 | 97/8465 | 1.78e-05 | 1.42e-04 | 8.40e-05 | 31 |
| hsa0517016 | Cervix | CC | Human immunodeficiency virus 1 infection | 55/1267 | 212/8465 | 1.80e-05 | 1.42e-04 | 8.40e-05 | 55 |
| hsa043609 | Cervix | CC | Axon guidance | 47/1267 | 182/8465 | 8.13e-05 | 5.38e-04 | 3.18e-04 | 47 |
| hsa051337 | Cervix | CC | Pertussis | 21/1267 | 76/8465 | 3.08e-03 | 1.19e-02 | 7.03e-03 | 21 |
| hsa0481017 | Cervix | CC | Regulation of actin cytoskeleton | 64/1267 | 229/8465 | 2.24e-07 | 2.59e-06 | 1.53e-06 | 64 |
| hsa0466613 | Cervix | CC | Fc gamma R-mediated phagocytosis | 31/1267 | 97/8465 | 1.78e-05 | 1.42e-04 | 8.40e-05 | 31 |
| hsa0517017 | Cervix | CC | Human immunodeficiency virus 1 infection | 55/1267 | 212/8465 | 1.80e-05 | 1.42e-04 | 8.40e-05 | 55 |
| hsa0436012 | Cervix | CC | Axon guidance | 47/1267 | 182/8465 | 8.13e-05 | 5.38e-04 | 3.18e-04 | 47 |
| hsa0513312 | Cervix | CC | Pertussis | 21/1267 | 76/8465 | 3.08e-03 | 1.19e-02 | 7.03e-03 | 21 |
| hsa0513321 | Cervix | HSIL_HPV | Pertussis | 10/459 | 76/8465 | 7.61e-03 | 4.37e-02 | 3.53e-02 | 10 |
| hsa0513331 | Cervix | HSIL_HPV | Pertussis | 10/459 | 76/8465 | 7.61e-03 | 4.37e-02 | 3.53e-02 | 10 |
| hsa0513341 | Cervix | N_HPV | Pertussis | 9/349 | 76/8465 | 3.86e-03 | 2.10e-02 | 1.64e-02 | 9 |
| hsa0513351 | Cervix | N_HPV | Pertussis | 9/349 | 76/8465 | 3.86e-03 | 2.10e-02 | 1.64e-02 | 9 |
| hsa04666 | Colorectum | AD | Fc gamma R-mediated phagocytosis | 46/2092 | 97/8465 | 9.10e-07 | 1.22e-05 | 7.77e-06 | 46 |
| hsa05170 | Colorectum | AD | Human immunodeficiency virus 1 infection | 72/2092 | 212/8465 | 1.40e-03 | 8.46e-03 | 5.39e-03 | 72 |
| hsa04810 | Colorectum | AD | Regulation of actin cytoskeleton | 75/2092 | 229/8465 | 3.36e-03 | 1.76e-02 | 1.12e-02 | 75 |
| hsa04360 | Colorectum | AD | Axon guidance | 61/2092 | 182/8465 | 4.36e-03 | 2.17e-02 | 1.38e-02 | 61 |
| hsa046661 | Colorectum | AD | Fc gamma R-mediated phagocytosis | 46/2092 | 97/8465 | 9.10e-07 | 1.22e-05 | 7.77e-06 | 46 |
| hsa051701 | Colorectum | AD | Human immunodeficiency virus 1 infection | 72/2092 | 212/8465 | 1.40e-03 | 8.46e-03 | 5.39e-03 | 72 |
| Page: 1 2 3 4 5 6 7 |
Top |
Cell-cell communication analysis |
| Identification of potential cell-cell interactions between two cell types and their ligand-receptor pairs for different disease states |
| Ligand | Receptor | LRpair | Pathway | Tissue | Disease Stage |
| Page: 1 |
Top |
Single-cell gene regulatory network inference analysis |
| Find out the significant the regulons (TFs) and the target genes of each regulon across cell types for different disease states |
| TF | Cell Type | Tissue | Disease Stage | Target Gene | RSS | Regulon Activity |
| ∗The dot plots of a searched regulon are shown for all cell subpopulations in each disease state of each tissue based on the regulon specific score inferred using pySCENIC and by calculating the average expression. |
| Page: 1 |
Top |
Somatic mutation of malignant transformation related genes |
| Annotation of somatic variants for genes involved in malignant transformation |
| Hugo Symbol | Variant Class | Variant Classification | dbSNP RS | HGVSc | HGVSp | HGVSp Short | SWISSPROT | BIOTYPE | SIFT | PolyPhen | Tumor Sample Barcode | Tissue | Histology | Sex | Age | Stage | Therapy Types | Drugs | Outcome |
| CFL1 | insertion | Nonsense_Mutation | novel | c.9_10insTAGGCCTCC | p.Ser3_Gly4insTer | p.S3_G4ins* | P23528 | protein_coding | TCGA-A1-A0SO-01 | Breast | breast invasive carcinoma | Female | >=65 | I/II | Chemotherapy | SD | |||
| CFL1 | SNV | Missense_Mutation | novel | c.25N>A | p.Asp9Asn | p.D9N | P23528 | protein_coding | deleterious(0) | benign(0.089) | TCGA-C5-A7UC-01 | Cervix | cervical & endocervical cancer | Female | <65 | I/II | Unknown | Unknown | SD |
| CFL1 | SNV | Missense_Mutation | novel | c.95N>A | p.Arg32His | p.R32H | P23528 | protein_coding | tolerated(0.14) | benign(0.237) | TCGA-AA-3877-01 | Colorectum | colon adenocarcinoma | Female | >=65 | I/II | Unknown | Unknown | SD |
| CFL1 | SNV | Missense_Mutation | c.283A>C | p.Lys95Gln | p.K95Q | P23528 | protein_coding | deleterious(0.04) | benign(0.055) | TCGA-AA-A00O-01 | Colorectum | colon adenocarcinoma | Female | >=65 | III/IV | Unknown | Unknown | SD | |
| CFL1 | SNV | Missense_Mutation | c.472N>A | p.Val158Ile | p.V158I | P23528 | protein_coding | tolerated(0.42) | benign(0.03) | TCGA-AD-6895-01 | Colorectum | colon adenocarcinoma | Male | >=65 | III/IV | Unknown | Unknown | SD | |
| CFL1 | SNV | Missense_Mutation | c.247N>A | p.Ala83Thr | p.A83T | P23528 | protein_coding | tolerated(0.07) | benign(0.103) | TCGA-AP-A059-01 | Endometrium | uterine corpus endometrioid carcinoma | Female | >=65 | I/II | Unknown | Unknown | SD | |
| CFL1 | SNV | Missense_Mutation | novel | c.104N>T | p.Ala35Val | p.A35V | P23528 | protein_coding | tolerated(0.06) | benign(0.046) | TCGA-AX-A1CE-01 | Endometrium | uterine corpus endometrioid carcinoma | Female | <65 | I/II | Unspecific | Paclitaxel | SD |
| CFL1 | SNV | Missense_Mutation | c.336G>C | p.Lys112Asn | p.K112N | P23528 | protein_coding | deleterious(0.02) | possibly_damaging(0.885) | TCGA-AX-A2H2-01 | Endometrium | uterine corpus endometrioid carcinoma | Female | >=65 | I/II | Unknown | Unknown | SD | |
| CFL1 | SNV | Missense_Mutation | novel | c.94C>T | p.Arg32Cys | p.R32C | P23528 | protein_coding | tolerated(0.08) | possibly_damaging(0.515) | TCGA-FI-A2D0-01 | Endometrium | uterine corpus endometrioid carcinoma | Female | <65 | I/II | Unknown | Unknown | SD |
| CFL1 | SNV | Missense_Mutation | c.52N>T | p.Met18Leu | p.M18L | P23528 | protein_coding | tolerated(0.11) | benign(0.173) | TCGA-ED-A7XP-01 | Liver | liver hepatocellular carcinoma | Female | <65 | I/II | Unknown | Unknown | PD |
| Page: 1 2 |
Top |
Related drugs of malignant transformation related genes |
| Identification of chemicals and drugs interact with genes involved in malignant transfromation |
| (DGIdb 4.0) |
| Entrez ID | Symbol | Category | Interaction Types | Drug Claim Name | Drug Name | PMIDs |
| 1072 | CFL1 | KINASE | SERTRALINE | SERTRALINE | 16680159 | |
| 1072 | CFL1 | KINASE | ROTENONE | ROTENONE | 16680159 | |
| 1072 | CFL1 | KINASE | CLOTRIMAZOLE | CLOTRIMAZOLE | 16680159 | |
| 1072 | CFL1 | KINASE | FENOFIBRATE | FENOFIBRATE | 16680159 | |
| 1072 | CFL1 | KINASE | PATULIN | PATULIN | 16680159 | |
| 1072 | CFL1 | KINASE | CLOFIBRATE | CLOFIBRATE | 16680159 | |
| 1072 | CFL1 | KINASE | MG-132 | MG-132 | 16680159 | |
| 1072 | CFL1 | KINASE | CINNARIZINE | CINNARIZINE | 16680159 |
| Page: 1 |

Copyright 2023-Present -The University of Texas Health Science Center at Houston |