
|
|||||
|
 | |
| |
| |
| |
| |
| |
|
Gene: CFI |
Gene summary for CFI |
| Gene information | Species | Human | Gene symbol | CFI | Gene ID | 3426 |
| Gene name | complement factor I | |
| Gene Alias | AHUS3 | |
| Cytomap | 4q25 | |
| Gene Type | protein-coding | GO ID | GO:0002250 | UniProtAcc | A8K3L0 |
Top |
Malignant transformation analysis |
| Identification of the aberrant gene expression in precancerous and cancerous lesions by comparing the gene expression of stem-like cells in diseased tissues with normal stem cells |
| Entrez ID | Symbol | Replicates | Species | Organ | Tissue | Adj P-value | Log2FC | Malignancy |
| 3426 | CFI | LZE8T | Human | Esophagus | ESCC | 1.53e-09 | 3.85e-01 | 0.067 |
| 3426 | CFI | P2T-E | Human | Esophagus | ESCC | 1.28e-08 | 6.77e-02 | 0.1177 |
| 3426 | CFI | P4T-E | Human | Esophagus | ESCC | 3.87e-02 | 5.70e-02 | 0.1323 |
| 3426 | CFI | P8T-E | Human | Esophagus | ESCC | 3.59e-13 | 2.83e-01 | 0.0889 |
| 3426 | CFI | P9T-E | Human | Esophagus | ESCC | 1.00e-07 | 7.65e-02 | 0.1131 |
| 3426 | CFI | P11T-E | Human | Esophagus | ESCC | 6.77e-11 | 3.80e-01 | 0.1426 |
| 3426 | CFI | P17T-E | Human | Esophagus | ESCC | 3.53e-02 | 4.10e-01 | 0.1278 |
| 3426 | CFI | P24T-E | Human | Esophagus | ESCC | 4.02e-02 | 1.93e-01 | 0.1287 |
| 3426 | CFI | P32T-E | Human | Esophagus | ESCC | 8.55e-13 | 2.72e-01 | 0.1666 |
| 3426 | CFI | P36T-E | Human | Esophagus | ESCC | 1.65e-03 | 2.95e-01 | 0.1187 |
| 3426 | CFI | P37T-E | Human | Esophagus | ESCC | 3.55e-11 | 2.30e-01 | 0.1371 |
| 3426 | CFI | P40T-E | Human | Esophagus | ESCC | 1.49e-02 | 1.46e-01 | 0.109 |
| 3426 | CFI | P44T-E | Human | Esophagus | ESCC | 1.27e-14 | 4.56e-01 | 0.1096 |
| 3426 | CFI | P47T-E | Human | Esophagus | ESCC | 9.86e-06 | 1.17e-01 | 0.1067 |
| 3426 | CFI | P48T-E | Human | Esophagus | ESCC | 8.15e-03 | 9.76e-02 | 0.0959 |
| 3426 | CFI | P52T-E | Human | Esophagus | ESCC | 9.26e-05 | 2.47e-01 | 0.1555 |
| 3426 | CFI | P57T-E | Human | Esophagus | ESCC | 1.17e-09 | 3.56e-01 | 0.0926 |
| 3426 | CFI | P61T-E | Human | Esophagus | ESCC | 8.21e-13 | 2.31e-01 | 0.099 |
| 3426 | CFI | P62T-E | Human | Esophagus | ESCC | 5.25e-16 | 3.99e-01 | 0.1302 |
| 3426 | CFI | P74T-E | Human | Esophagus | ESCC | 1.26e-17 | 5.65e-01 | 0.1479 |
| Page: 1 2 3 |
| Tissue | Expression Dynamics | Abbreviation |
| Esophagus | 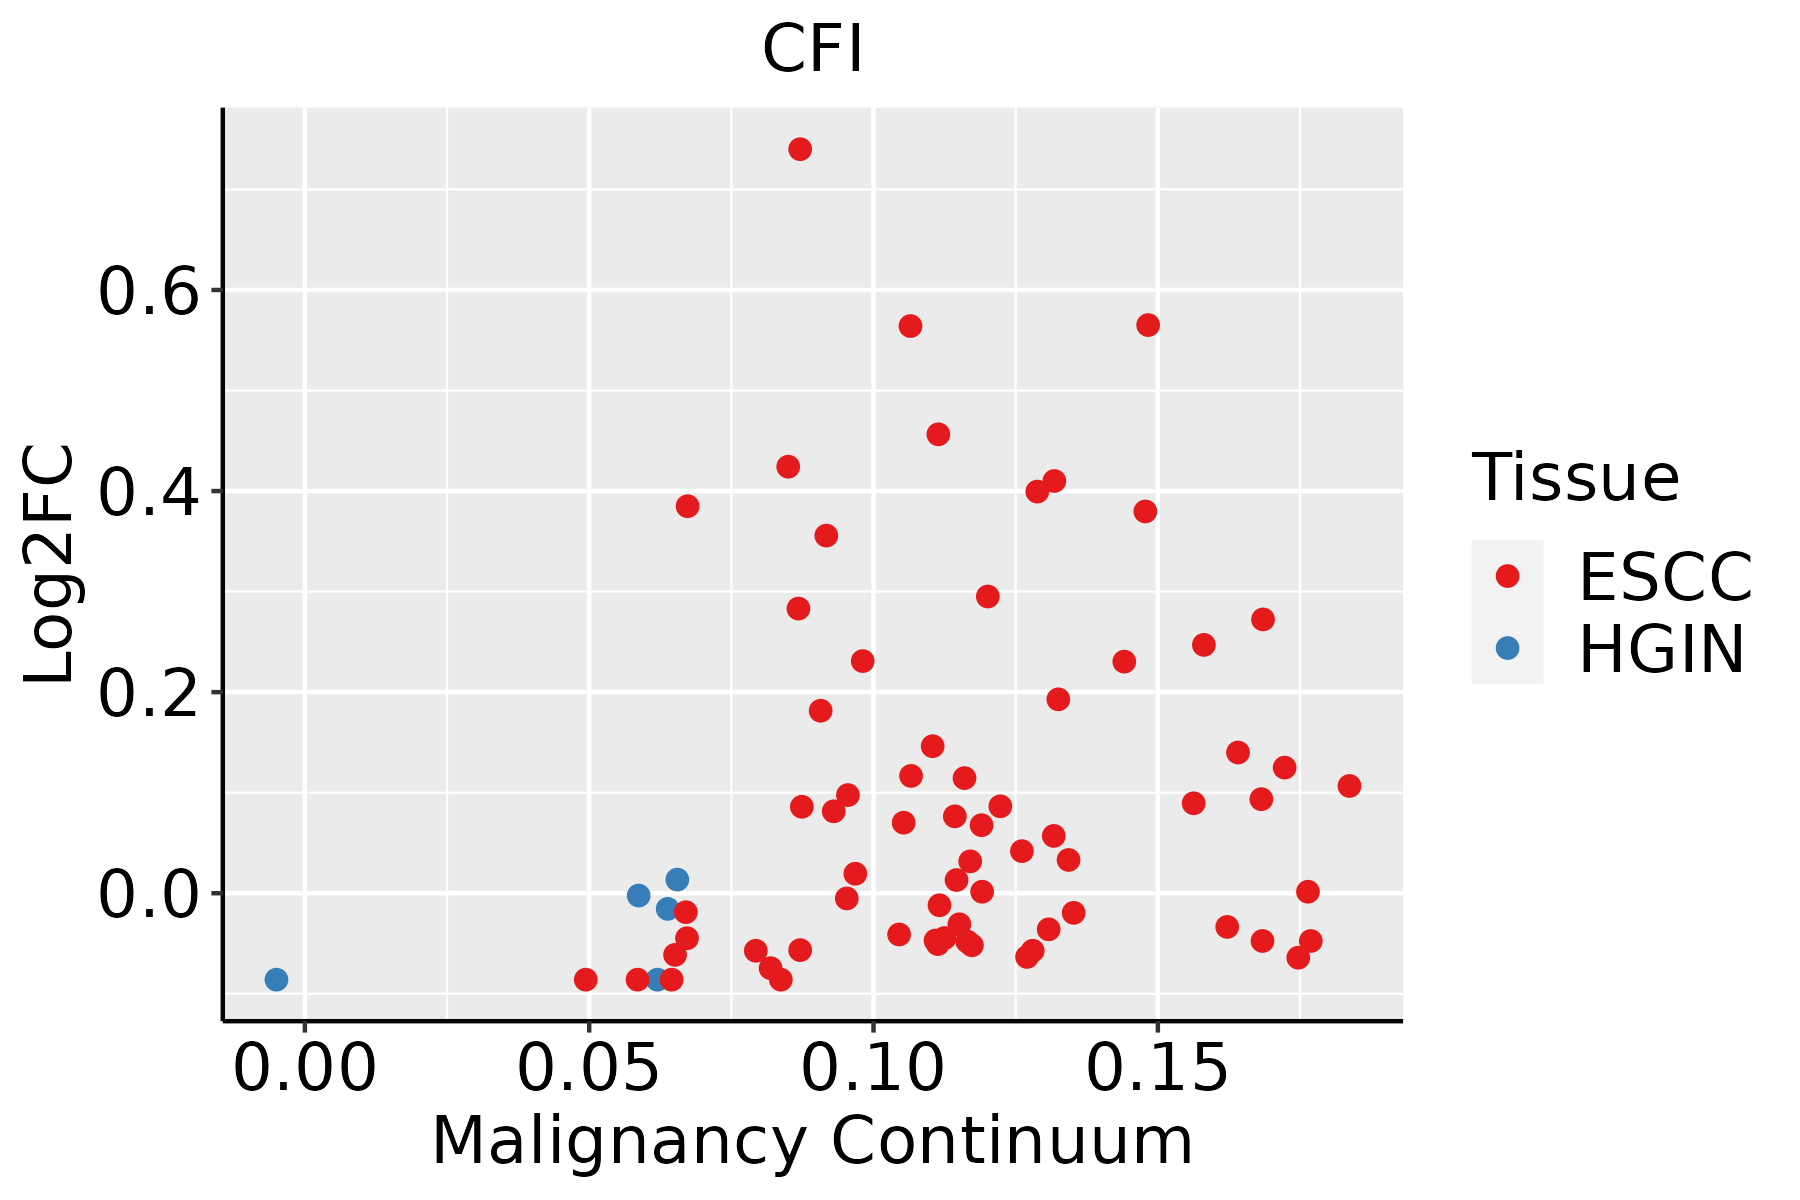 | ESCC: Esophageal squamous cell carcinoma |
| HGIN: High-grade intraepithelial neoplasias | ||
| LGIN: Low-grade intraepithelial neoplasias | ||
| Liver | 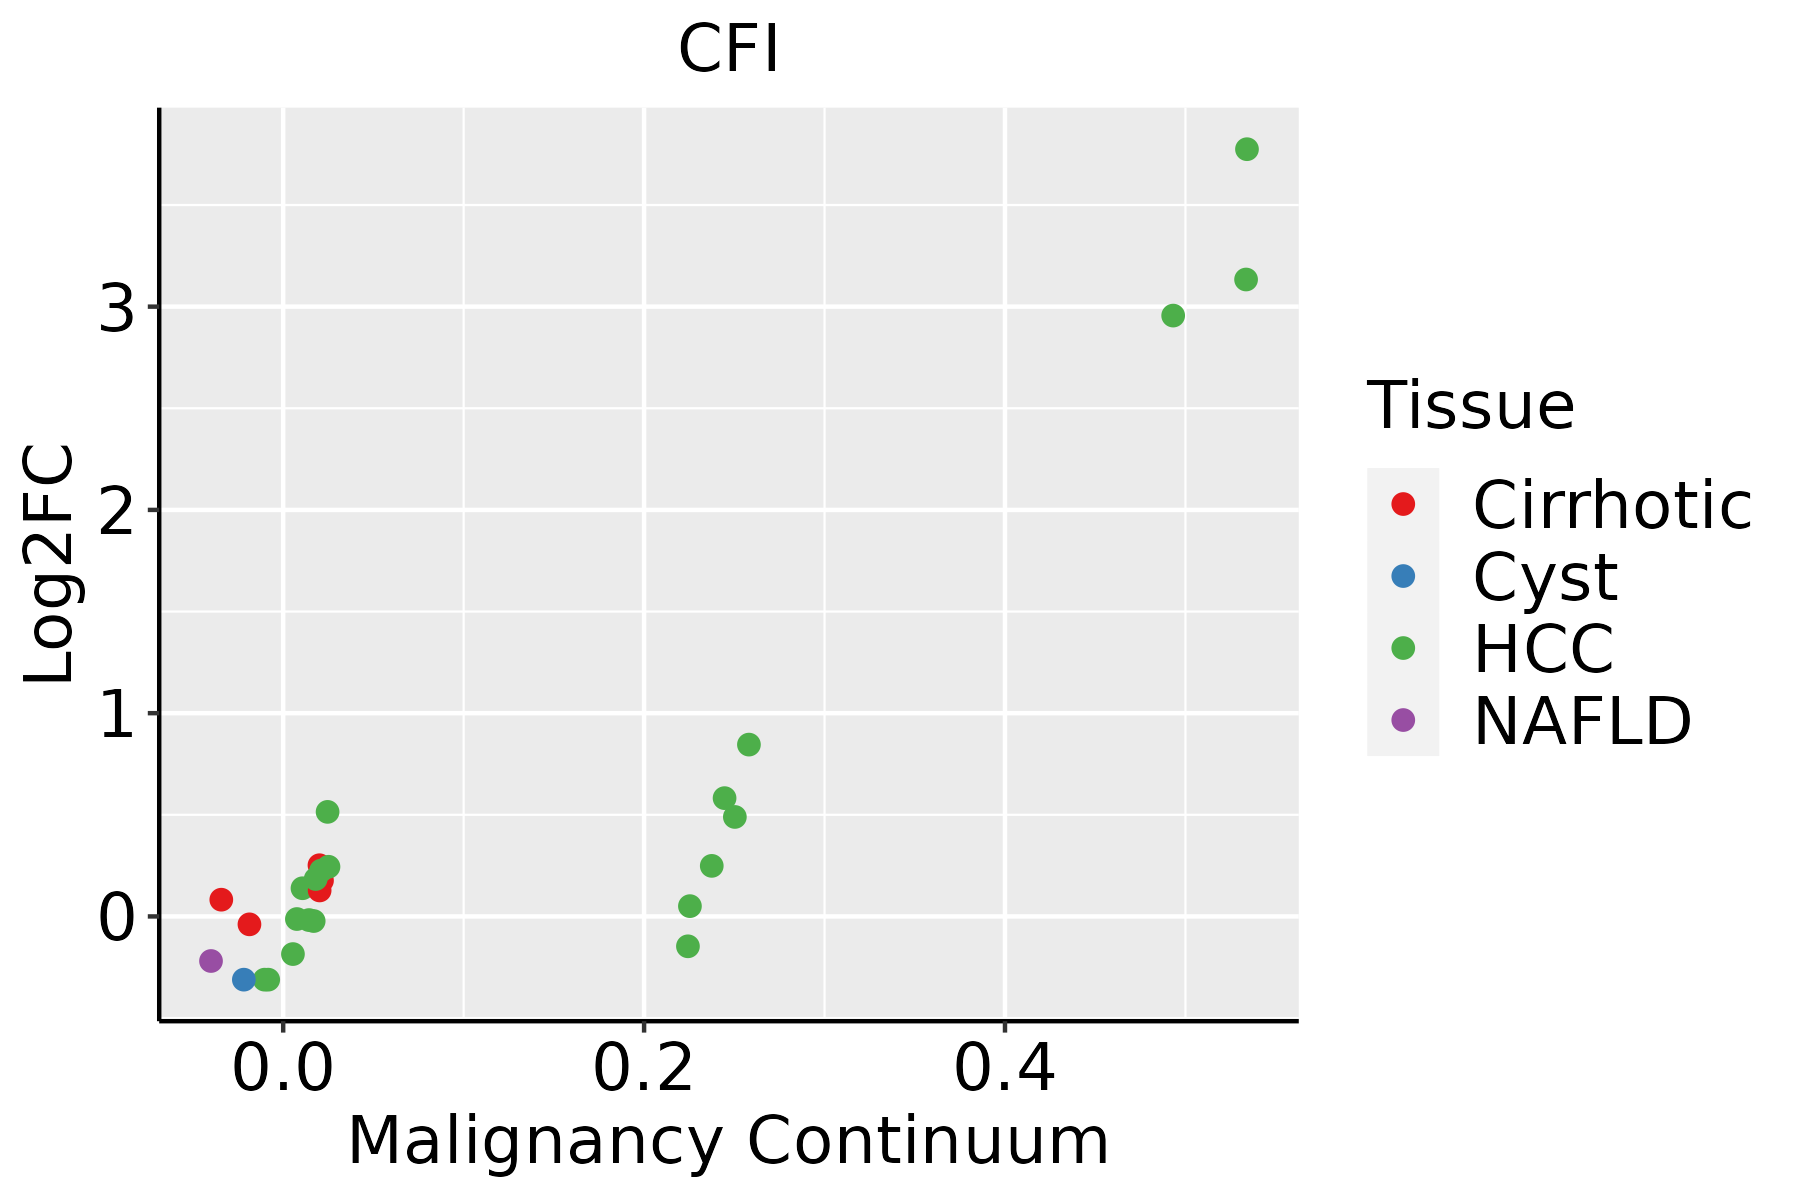 | HCC: Hepatocellular carcinoma |
| NAFLD: Non-alcoholic fatty liver disease | ||
| Thyroid | 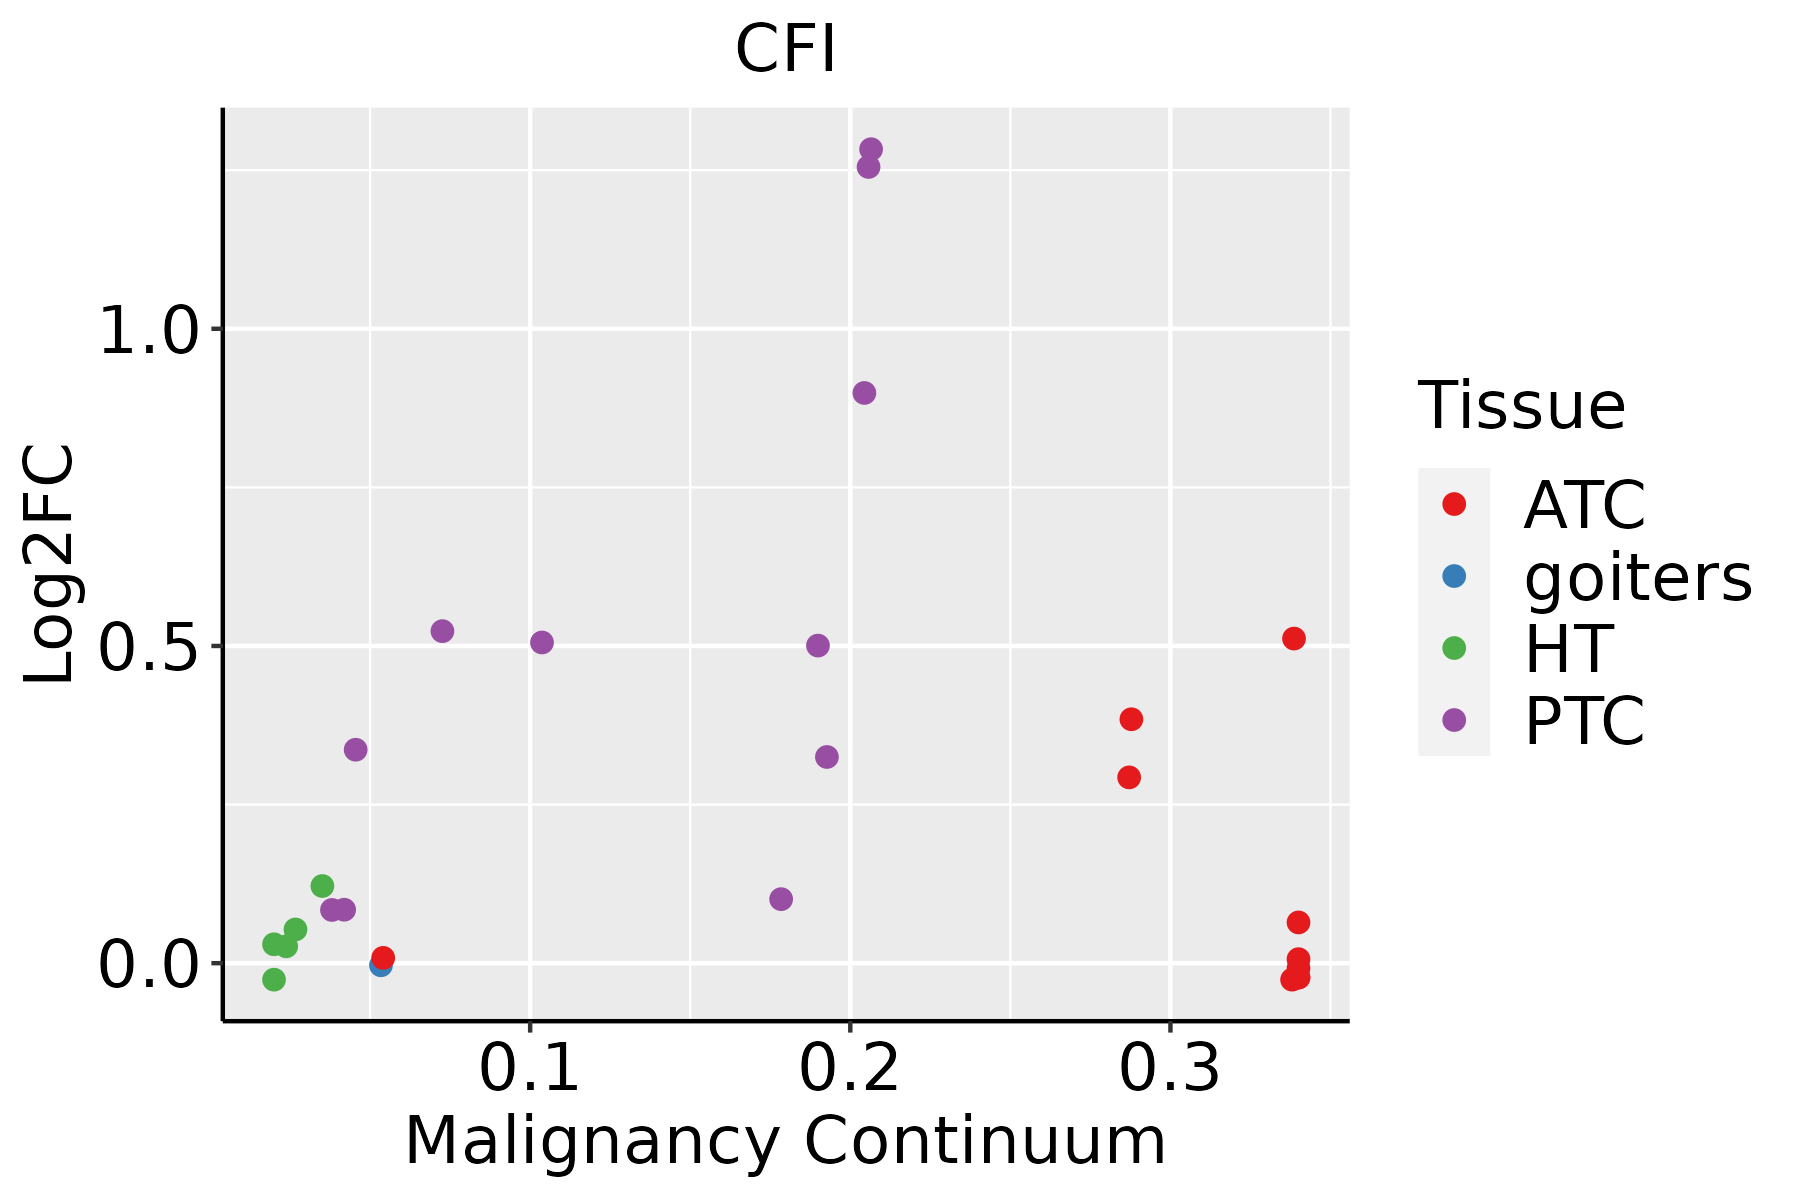 | ATC: Anaplastic thyroid cancer |
| HT: Hashimoto's thyroiditis | ||
| PTC: Papillary thyroid cancer |
| ∗log2FC in expression of this searched gene in stem-like cells from each diseased tissue sample relative to stem-like cells in normal samples in each tissue plotted against the malignancy continuum. Samples are colored based on if they are from different disease stage. |
Top |
Malignant transformation related pathway analysis |
| Find out the enriched GO biological processes and KEGG pathways involved in transition from healthy to precancer to cancer |
| Tissue | Disease Stage | Enriched GO biological Processes |
| Colorectum | AD |  |
| Colorectum | SER |  |
| Colorectum | MSS |  |
| Colorectum | MSI-H |  |
| Colorectum | FAP |  |
| ∗Top 15 enriched GO BP terms are showed in the bar plot of each disease state in each tissue. Each row represents a significant GO biological process which is colored according to the -log10(p.adjust). |
| Page: 1 2 3 4 5 6 7 8 9 |
| GO ID | Tissue | Disease Stage | Description | Gene Ratio | Bg Ratio | pvalue | p.adjust | Count |
| Page: 1 |
| Pathway ID | Tissue | Disease Stage | Description | Gene Ratio | Bg Ratio | pvalue | p.adjust | qvalue | Count |
| hsa046102 | Liver | Cirrhotic | Complement and coagulation cascades | 48/2530 | 86/8465 | 4.41e-07 | 5.44e-06 | 3.35e-06 | 48 |
| hsa046103 | Liver | Cirrhotic | Complement and coagulation cascades | 48/2530 | 86/8465 | 4.41e-07 | 5.44e-06 | 3.35e-06 | 48 |
| hsa046104 | Liver | HCC | Complement and coagulation cascades | 57/4020 | 86/8465 | 3.19e-04 | 1.45e-03 | 8.04e-04 | 57 |
| hsa046105 | Liver | HCC | Complement and coagulation cascades | 57/4020 | 86/8465 | 3.19e-04 | 1.45e-03 | 8.04e-04 | 57 |
| Page: 1 |
Top |
Cell-cell communication analysis |
| Identification of potential cell-cell interactions between two cell types and their ligand-receptor pairs for different disease states |
| Ligand | Receptor | LRpair | Pathway | Tissue | Disease Stage |
| Page: 1 |
Top |
Single-cell gene regulatory network inference analysis |
| Find out the significant the regulons (TFs) and the target genes of each regulon across cell types for different disease states |
| TF | Cell Type | Tissue | Disease Stage | Target Gene | RSS | Regulon Activity |
| ∗The dot plots of a searched regulon are shown for all cell subpopulations in each disease state of each tissue based on the regulon specific score inferred using pySCENIC and by calculating the average expression. |
| Page: 1 |
Top |
Somatic mutation of malignant transformation related genes |
| Annotation of somatic variants for genes involved in malignant transformation |
| Hugo Symbol | Variant Class | Variant Classification | dbSNP RS | HGVSc | HGVSp | HGVSp Short | SWISSPROT | BIOTYPE | SIFT | PolyPhen | Tumor Sample Barcode | Tissue | Histology | Sex | Age | Stage | Therapy Types | Drugs | Outcome |
| CFI | SNV | Missense_Mutation | novel | c.1225N>A | p.His409Asn | p.H409N | protein_coding | tolerated(0.31) | benign(0) | TCGA-A8-A096-01 | Breast | breast invasive carcinoma | Female | >=65 | I/II | Unknown | Unknown | SD | |
| CFI | SNV | Missense_Mutation | novel | c.958N>A | p.Asp320Asn | p.D320N | protein_coding | tolerated(0.2) | benign(0.041) | TCGA-AN-A0XV-01 | Breast | breast invasive carcinoma | Female | >=65 | III/IV | Unknown | Unknown | SD | |
| CFI | SNV | Missense_Mutation | rs189153845 | c.333N>C | p.Lys111Asn | p.K111N | protein_coding | tolerated(0.35) | benign(0.001) | TCGA-LL-A441-01 | Breast | breast invasive carcinoma | Female | <65 | I/II | Chemotherapy | taxotere | CR | |
| CFI | SNV | Missense_Mutation | novel | c.1234C>G | p.Leu412Val | p.L412V | protein_coding | tolerated(0.39) | benign(0) | TCGA-LL-A8F5-01 | Breast | breast invasive carcinoma | Female | <65 | I/II | Chemotherapy | cyclophosphamide | SD | |
| CFI | SNV | Missense_Mutation | novel | c.1707A>C | p.Lys569Asn | p.K569N | protein_coding | deleterious(0) | probably_damaging(0.911) | TCGA-2W-A8YY-01 | Cervix | cervical & endocervical cancer | Female | <65 | I/II | Chemotherapy | cisplatin | CR | |
| CFI | SNV | Missense_Mutation | rs758017357 | c.1315G>A | p.Ala439Thr | p.A439T | protein_coding | deleterious(0) | probably_damaging(0.973) | TCGA-2W-A8YY-01 | Cervix | cervical & endocervical cancer | Female | <65 | I/II | Chemotherapy | cisplatin | CR | |
| CFI | SNV | Missense_Mutation | novel | c.351G>T | p.Lys117Asn | p.K117N | protein_coding | tolerated(0.53) | benign(0.01) | TCGA-C5-A8YQ-01 | Cervix | cervical & endocervical cancer | Female | >=65 | I/II | Chemotherapy | cisplatin | PD | |
| CFI | SNV | Missense_Mutation | novel | c.1394N>G | p.Ser465Cys | p.S465C | protein_coding | deleterious(0) | probably_damaging(0.99) | TCGA-IR-A3LA-01 | Cervix | cervical & endocervical cancer | Female | <65 | I/II | Chemotherapy | cisplatin | CR | |
| CFI | SNV | Missense_Mutation | rs754851037 | c.1366C>T | p.Arg456Cys | p.R456C | protein_coding | tolerated(0.09) | possibly_damaging(0.684) | TCGA-Q1-A73O-01 | Cervix | cervical & endocervical cancer | Female | <65 | I/II | Chemotherapy | cisplatin | CR | |
| CFI | SNV | Missense_Mutation | rs777190530 | c.1190N>A | p.Arg397His | p.R397H | protein_coding | tolerated(0.54) | benign(0.005) | TCGA-VS-A9UJ-01 | Cervix | cervical & endocervical cancer | Female | <65 | I/II | Unknown | Unknown | PD |
| Page: 1 2 3 4 5 6 7 8 |
Top |
Related drugs of malignant transformation related genes |
| Identification of chemicals and drugs interact with genes involved in malignant transfromation |
| (DGIdb 4.0) |
| Entrez ID | Symbol | Category | Interaction Types | Drug Claim Name | Drug Name | PMIDs |
| 3426 | CFI | ENZYME, DRUGGABLE GENOME, PROTEASE | TGFBETA1 | 17320177 |
| Page: 1 |

Copyright 2023-Present -The University of Texas Health Science Center at Houston |