
|
|||||
|
 | |
| |
| |
| |
| |
| |
|
Gene: CFHR2 |
Gene summary for CFHR2 |
| Gene information | Species | Human | Gene symbol | CFHR2 | Gene ID | 3080 |
| Gene name | complement factor H related 2 | |
| Gene Alias | CFHL2 | |
| Cytomap | 1q31.3 | |
| Gene Type | protein-coding | GO ID | GO:0001906 | UniProtAcc | P36980 |
Top |
Malignant transformation analysis |
| Identification of the aberrant gene expression in precancerous and cancerous lesions by comparing the gene expression of stem-like cells in diseased tissues with normal stem cells |
| Entrez ID | Symbol | Replicates | Species | Organ | Tissue | Adj P-value | Log2FC | Malignancy |
| 3080 | CFHR2 | S41 | Human | Liver | Cirrhotic | 1.26e-05 | 4.13e-01 | -0.0343 |
| 3080 | CFHR2 | S44 | Human | Liver | HCC | 5.65e-03 | 8.02e-01 | -0.0083 |
| 3080 | CFHR2 | HCC1_Meng | Human | Liver | HCC | 4.77e-15 | 4.39e-02 | 0.0246 |
| 3080 | CFHR2 | HCC1 | Human | Liver | HCC | 6.66e-31 | 4.35e+00 | 0.5336 |
| 3080 | CFHR2 | HCC2 | Human | Liver | HCC | 1.10e-07 | 2.55e+00 | 0.5341 |
| 3080 | CFHR2 | Pt13.a | Human | Liver | HCC | 8.02e-58 | 9.33e-01 | 0.021 |
| 3080 | CFHR2 | Pt13.b | Human | Liver | HCC | 6.79e-36 | 5.51e-01 | 0.0251 |
| 3080 | CFHR2 | Pt13.c | Human | Liver | HCC | 7.67e-19 | 7.37e-01 | 0.0076 |
| 3080 | CFHR2 | Pt14.b | Human | Liver | HCC | 1.07e-21 | 8.13e-01 | 0.018 |
| 3080 | CFHR2 | Pt14.c | Human | Liver | HCC | 7.04e-04 | 5.18e-01 | 0.0054 |
| 3080 | CFHR2 | Pt14.d | Human | Liver | HCC | 3.68e-22 | 5.65e-01 | 0.0143 |
| Page: 1 |
| Tissue | Expression Dynamics | Abbreviation |
| Liver | 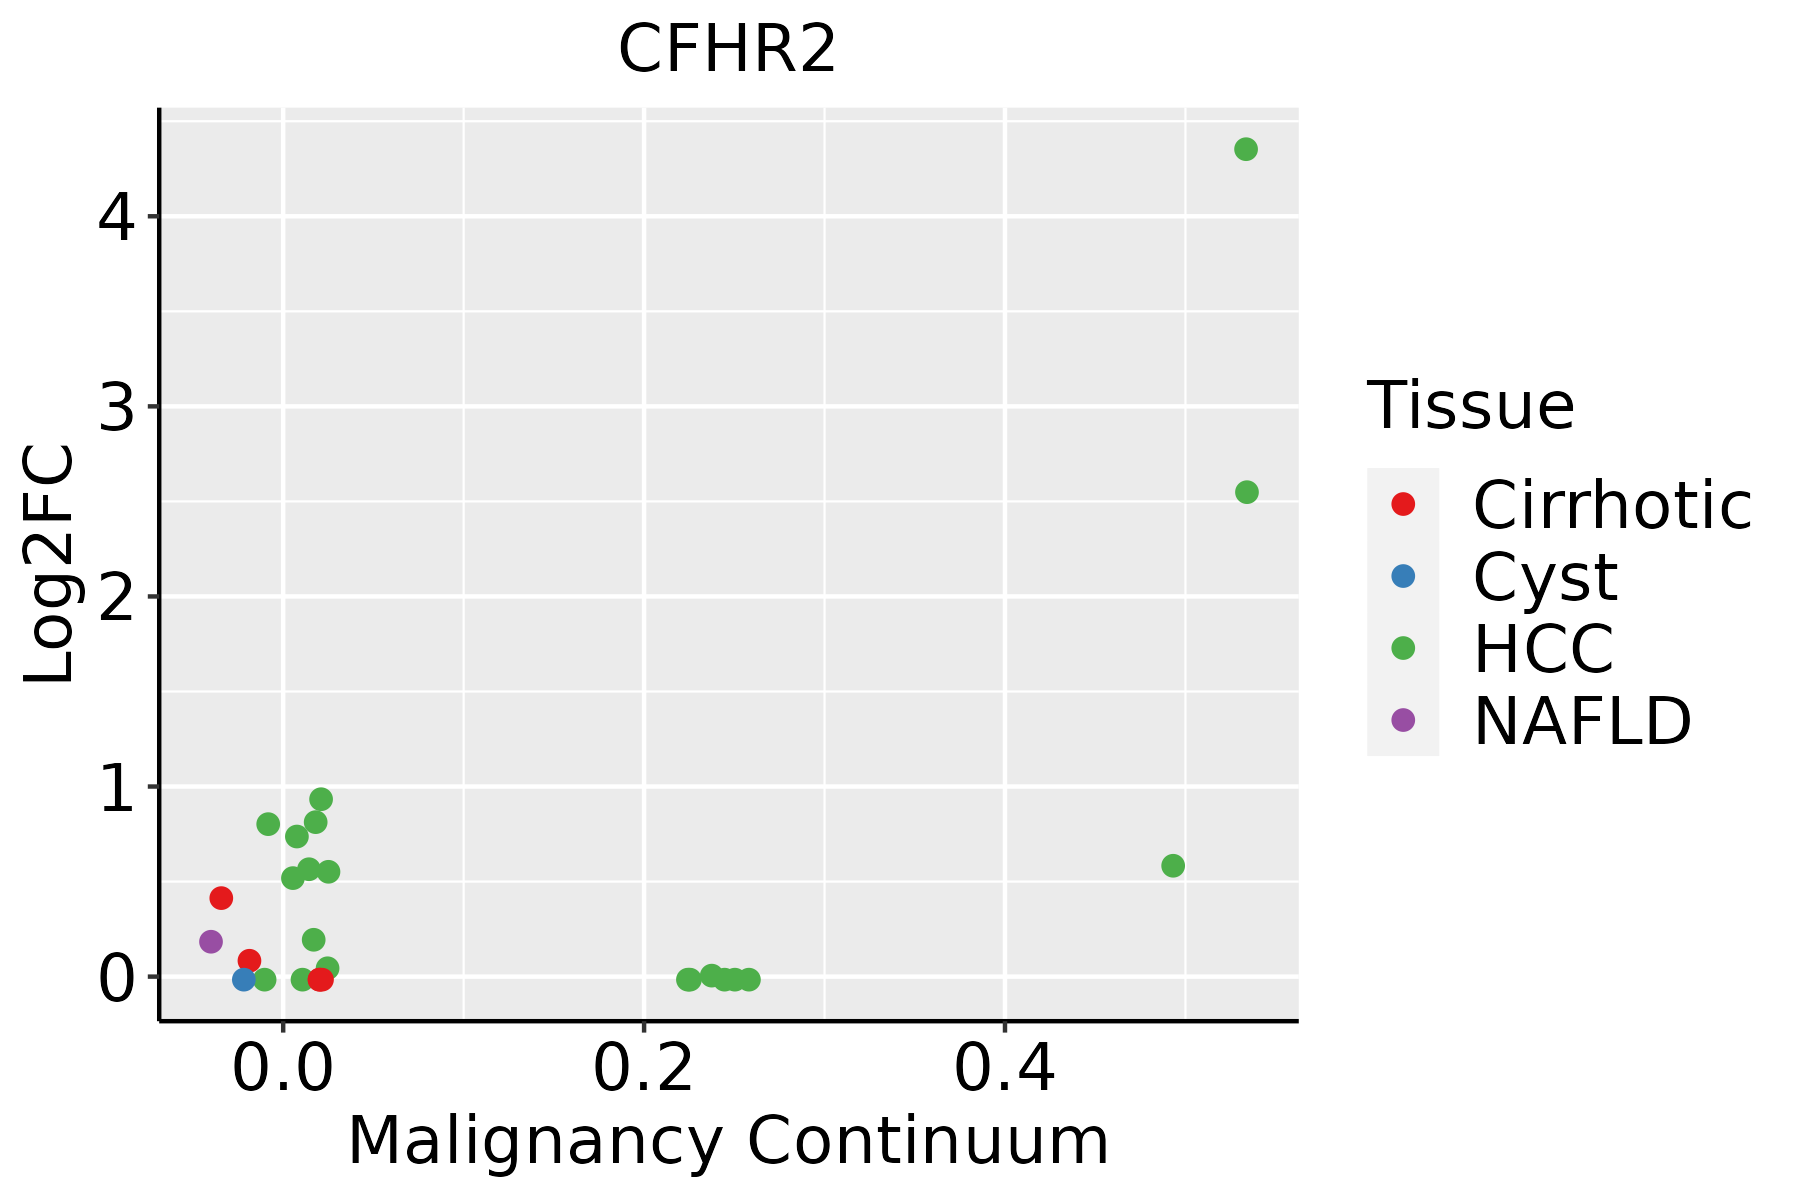 | HCC: Hepatocellular carcinoma |
| NAFLD: Non-alcoholic fatty liver disease |
| ∗log2FC in expression of this searched gene in stem-like cells from each diseased tissue sample relative to stem-like cells in normal samples in each tissue plotted against the malignancy continuum. Samples are colored based on if they are from different disease stage. |
Top |
Malignant transformation related pathway analysis |
| Find out the enriched GO biological processes and KEGG pathways involved in transition from healthy to precancer to cancer |
| Tissue | Disease Stage | Enriched GO biological Processes |
| Colorectum | AD |  |
| Colorectum | SER |  |
| Colorectum | MSS |  |
| Colorectum | MSI-H |  |
| Colorectum | FAP |  |
| ∗Top 15 enriched GO BP terms are showed in the bar plot of each disease state in each tissue. Each row represents a significant GO biological process which is colored according to the -log10(p.adjust). |
| Page: 1 2 3 4 5 6 7 8 9 |
| GO ID | Tissue | Disease Stage | Description | Gene Ratio | Bg Ratio | pvalue | p.adjust | Count |
| GO:004440312 | Liver | Cirrhotic | biological process involved in symbiotic interaction | 131/4634 | 290/18723 | 2.00e-14 | 1.84e-12 | 131 |
| GO:005109812 | Liver | Cirrhotic | regulation of binding | 148/4634 | 363/18723 | 9.14e-12 | 5.97e-10 | 148 |
| GO:005170211 | Liver | Cirrhotic | biological process involved in interaction with symbiont | 48/4634 | 94/18723 | 3.41e-08 | 1.14e-06 | 48 |
| GO:004339312 | Liver | Cirrhotic | regulation of protein binding | 83/4634 | 196/18723 | 4.44e-08 | 1.42e-06 | 83 |
| GO:00511006 | Liver | Cirrhotic | negative regulation of binding | 63/4634 | 162/18723 | 4.54e-05 | 5.31e-04 | 63 |
| GO:00320914 | Liver | Cirrhotic | negative regulation of protein binding | 40/4634 | 94/18723 | 1.14e-04 | 1.14e-03 | 40 |
| GO:0019835 | Liver | Cirrhotic | cytolysis | 17/4634 | 32/18723 | 5.24e-04 | 4.14e-03 | 17 |
| GO:005109822 | Liver | HCC | regulation of binding | 225/7958 | 363/18723 | 3.78e-14 | 2.37e-12 | 225 |
| GO:004440322 | Liver | HCC | biological process involved in symbiotic interaction | 183/7958 | 290/18723 | 9.13e-13 | 4.59e-11 | 183 |
| GO:004339322 | Liver | HCC | regulation of protein binding | 129/7958 | 196/18723 | 3.27e-11 | 1.26e-09 | 129 |
| GO:00517022 | Liver | HCC | biological process involved in interaction with symbiont | 60/7958 | 94/18723 | 2.41e-05 | 2.54e-04 | 60 |
| GO:005110012 | Liver | HCC | negative regulation of binding | 94/7958 | 162/18723 | 4.69e-05 | 4.50e-04 | 94 |
| GO:003209112 | Liver | HCC | negative regulation of protein binding | 59/7958 | 94/18723 | 5.79e-05 | 5.34e-04 | 59 |
| Page: 1 |
| Pathway ID | Tissue | Disease Stage | Description | Gene Ratio | Bg Ratio | pvalue | p.adjust | qvalue | Count |
| hsa046102 | Liver | Cirrhotic | Complement and coagulation cascades | 48/2530 | 86/8465 | 4.41e-07 | 5.44e-06 | 3.35e-06 | 48 |
| hsa046103 | Liver | Cirrhotic | Complement and coagulation cascades | 48/2530 | 86/8465 | 4.41e-07 | 5.44e-06 | 3.35e-06 | 48 |
| hsa046104 | Liver | HCC | Complement and coagulation cascades | 57/4020 | 86/8465 | 3.19e-04 | 1.45e-03 | 8.04e-04 | 57 |
| hsa046105 | Liver | HCC | Complement and coagulation cascades | 57/4020 | 86/8465 | 3.19e-04 | 1.45e-03 | 8.04e-04 | 57 |
| Page: 1 |
Top |
Cell-cell communication analysis |
| Identification of potential cell-cell interactions between two cell types and their ligand-receptor pairs for different disease states |
| Ligand | Receptor | LRpair | Pathway | Tissue | Disease Stage |
| Page: 1 |
Top |
Single-cell gene regulatory network inference analysis |
| Find out the significant the regulons (TFs) and the target genes of each regulon across cell types for different disease states |
| TF | Cell Type | Tissue | Disease Stage | Target Gene | RSS | Regulon Activity |
| ∗The dot plots of a searched regulon are shown for all cell subpopulations in each disease state of each tissue based on the regulon specific score inferred using pySCENIC and by calculating the average expression. |
| Page: 1 |
Top |
Somatic mutation of malignant transformation related genes |
| Annotation of somatic variants for genes involved in malignant transformation |
| Hugo Symbol | Variant Class | Variant Classification | dbSNP RS | HGVSc | HGVSp | HGVSp Short | SWISSPROT | BIOTYPE | SIFT | PolyPhen | Tumor Sample Barcode | Tissue | Histology | Sex | Age | Stage | Therapy Types | Drugs | Outcome |
| CFHR2 | SNV | Missense_Mutation | c.163N>C | p.Cys55Arg | p.C55R | P36980 | protein_coding | deleterious(0) | probably_damaging(1) | TCGA-E2-A14Q-01 | Breast | breast invasive carcinoma | Female | <65 | I/II | Hormone Therapy | tamoxiphen | SD | |
| CFHR2 | insertion | Frame_Shift_Ins | novel | c.782_783insTC | p.Lys261AsnfsTer26 | p.K261Nfs*26 | P36980 | protein_coding | TCGA-A8-A08H-01 | Breast | breast invasive carcinoma | Female | >=65 | I/II | Unknown | Unknown | SD | ||
| CFHR2 | insertion | In_Frame_Ins | novel | c.783_784insTTTCATTCAGCACAAATCACAAAAGCC | p.Lys261_Leu262insPheHisSerAlaGlnIleThrLysAla | p.K261_L262insFHSAQITKA | P36980 | protein_coding | TCGA-A8-A08H-01 | Breast | breast invasive carcinoma | Female | >=65 | I/II | Unknown | Unknown | SD | ||
| CFHR2 | SNV | Missense_Mutation | rs773697180 | c.425C>T | p.Ser142Phe | p.S142F | P36980 | protein_coding | tolerated(0.1) | benign(0.007) | TCGA-2W-A8YY-01 | Cervix | cervical & endocervical cancer | Female | <65 | I/II | Chemotherapy | cisplatin | CR |
| CFHR2 | SNV | Missense_Mutation | rs745329423 | c.689N>C | p.Tyr230Ser | p.Y230S | P36980 | protein_coding | deleterious(0) | probably_damaging(0.99) | TCGA-AA-3947-01 | Colorectum | colon adenocarcinoma | Female | <65 | I/II | Unknown | Unknown | SD |
| CFHR2 | SNV | Missense_Mutation | novel | c.125T>G | p.Phe42Cys | p.F42C | P36980 | protein_coding | deleterious(0.04) | probably_damaging(0.921) | TCGA-AZ-4315-01 | Colorectum | colon adenocarcinoma | Male | <65 | I/II | Unknown | Unknown | SD |
| CFHR2 | SNV | Missense_Mutation | novel | c.182N>T | p.Ser61Phe | p.S61F | P36980 | protein_coding | deleterious(0) | probably_damaging(0.99) | TCGA-CA-6717-01 | Colorectum | colon adenocarcinoma | Male | <65 | I/II | Chemotherapy | oxaliplatin | CR |
| CFHR2 | SNV | Missense_Mutation | c.659N>T | p.Lys220Ile | p.K220I | P36980 | protein_coding | tolerated(0.09) | benign(0.062) | TCGA-CM-5864-01 | Colorectum | colon adenocarcinoma | Male | <65 | I/II | Unknown | Unknown | SD | |
| CFHR2 | SNV | Missense_Mutation | c.274N>C | p.Val92Leu | p.V92L | P36980 | protein_coding | tolerated(0.28) | probably_damaging(0.984) | TCGA-DM-A0X9-01 | Colorectum | colon adenocarcinoma | Female | >=65 | I/II | Unknown | Unknown | SD | |
| CFHR2 | SNV | Missense_Mutation | c.220N>C | p.Glu74Gln | p.E74Q | P36980 | protein_coding | tolerated(0.39) | probably_damaging(0.991) | TCGA-F4-6570-01 | Colorectum | colon adenocarcinoma | Female | >=65 | I/II | Unknown | Unknown | SD |
| Page: 1 2 3 4 5 6 |
Top |
Related drugs of malignant transformation related genes |
| Identification of chemicals and drugs interact with genes involved in malignant transfromation |
| (DGIdb 4.0) |
| Entrez ID | Symbol | Category | Interaction Types | Drug Claim Name | Drug Name | PMIDs |
| Page: 1 |

Copyright 2023-Present -The University of Texas Health Science Center at Houston |