
|
|||||
|
 | |
| |
| |
| |
| |
| |
|
Gene: CFH |
Gene summary for CFH |
| Gene information | Species | Human | Gene symbol | CFH | Gene ID | 3075 |
| Gene name | complement factor H | |
| Gene Alias | AHUS1 | |
| Cytomap | 1q31.3 | |
| Gene Type | protein-coding | GO ID | GO:0001906 | UniProtAcc | A0A024R962 |
Top |
Malignant transformation analysis |
| Identification of the aberrant gene expression in precancerous and cancerous lesions by comparing the gene expression of stem-like cells in diseased tissues with normal stem cells |
| Entrez ID | Symbol | Replicates | Species | Organ | Tissue | Adj P-value | Log2FC | Malignancy |
| 3075 | CFH | LZE2T | Human | Esophagus | ESCC | 2.70e-07 | 6.21e-02 | 0.082 |
| 3075 | CFH | LZE8T | Human | Esophagus | ESCC | 2.89e-04 | 4.36e-01 | 0.067 |
| 3075 | CFH | P2T-E | Human | Esophagus | ESCC | 2.11e-10 | 1.04e-01 | 0.1177 |
| 3075 | CFH | P8T-E | Human | Esophagus | ESCC | 2.67e-26 | 8.39e-01 | 0.0889 |
| 3075 | CFH | P10T-E | Human | Esophagus | ESCC | 1.48e-07 | -3.13e-01 | 0.116 |
| 3075 | CFH | P11T-E | Human | Esophagus | ESCC | 3.47e-03 | 6.55e-01 | 0.1426 |
| 3075 | CFH | P12T-E | Human | Esophagus | ESCC | 4.81e-05 | -3.66e-01 | 0.1122 |
| 3075 | CFH | P16T-E | Human | Esophagus | ESCC | 3.28e-09 | -2.37e-01 | 0.1153 |
| 3075 | CFH | P22T-E | Human | Esophagus | ESCC | 2.63e-04 | -2.06e-01 | 0.1236 |
| 3075 | CFH | P24T-E | Human | Esophagus | ESCC | 1.73e-09 | 9.85e-02 | 0.1287 |
| 3075 | CFH | P28T-E | Human | Esophagus | ESCC | 4.75e-09 | -3.07e-01 | 0.1149 |
| 3075 | CFH | P31T-E | Human | Esophagus | ESCC | 5.47e-05 | -3.57e-01 | 0.1251 |
| 3075 | CFH | P32T-E | Human | Esophagus | ESCC | 4.23e-07 | 4.88e-01 | 0.1666 |
| 3075 | CFH | P36T-E | Human | Esophagus | ESCC | 2.22e-04 | 6.35e-01 | 0.1187 |
| 3075 | CFH | P37T-E | Human | Esophagus | ESCC | 3.49e-03 | 2.56e-01 | 0.1371 |
| 3075 | CFH | P39T-E | Human | Esophagus | ESCC | 3.12e-02 | -2.57e-01 | 0.0894 |
| 3075 | CFH | P40T-E | Human | Esophagus | ESCC | 3.27e-02 | -2.33e-02 | 0.109 |
| 3075 | CFH | P42T-E | Human | Esophagus | ESCC | 1.41e-03 | 3.94e-01 | 0.1175 |
| 3075 | CFH | P54T-E | Human | Esophagus | ESCC | 4.95e-10 | 5.27e-01 | 0.0975 |
| 3075 | CFH | P57T-E | Human | Esophagus | ESCC | 8.01e-10 | 4.49e-01 | 0.0926 |
| Page: 1 2 3 4 5 |
| Tissue | Expression Dynamics | Abbreviation |
| Esophagus |  | ESCC: Esophageal squamous cell carcinoma |
| HGIN: High-grade intraepithelial neoplasias | ||
| LGIN: Low-grade intraepithelial neoplasias | ||
| Liver |  | HCC: Hepatocellular carcinoma |
| NAFLD: Non-alcoholic fatty liver disease | ||
| Oral Cavity | 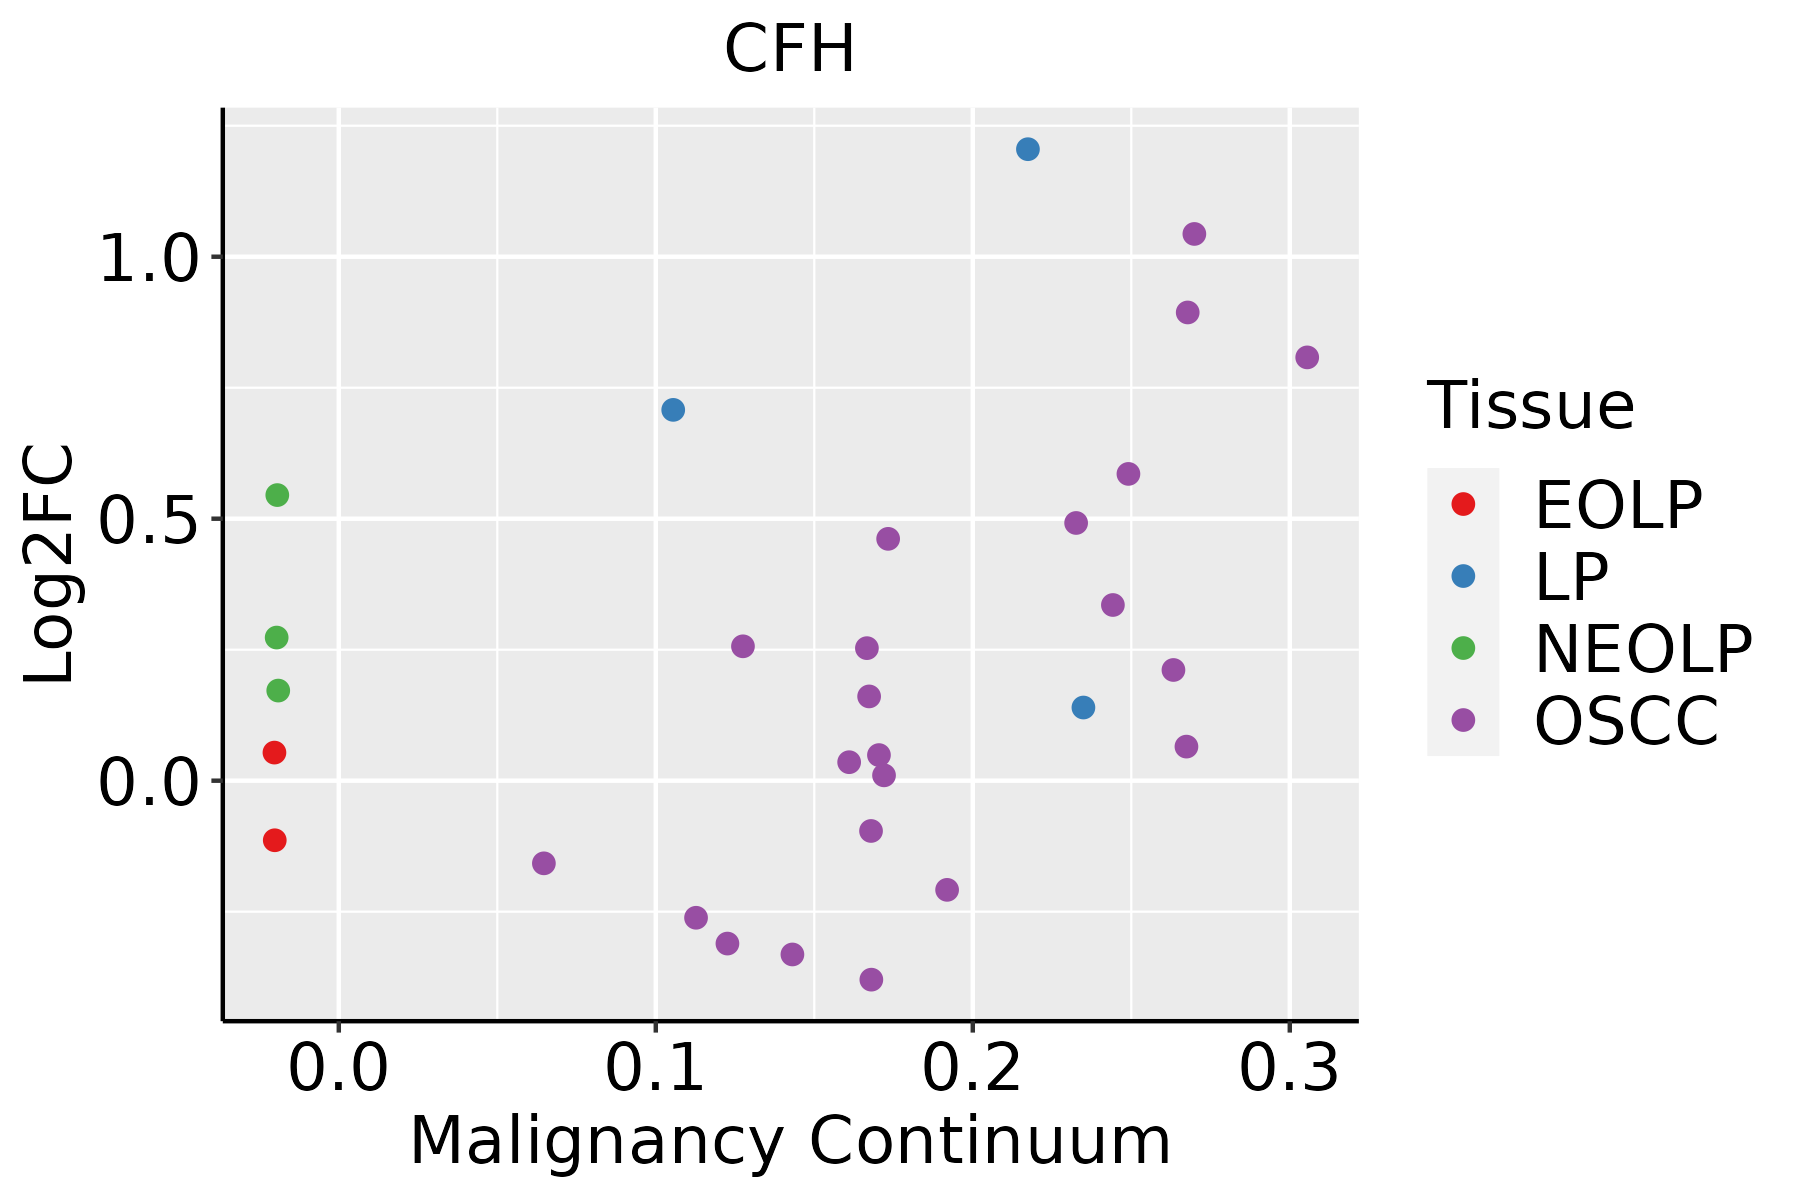 | EOLP: Erosive Oral lichen planus |
| LP: leukoplakia | ||
| NEOLP: Non-erosive oral lichen planus | ||
| OSCC: Oral squamous cell carcinoma | ||
| Skin |  | AK: Actinic keratosis |
| cSCC: Cutaneous squamous cell carcinoma | ||
| SCCIS:squamous cell carcinoma in situ | ||
| Thyroid |  | ATC: Anaplastic thyroid cancer |
| HT: Hashimoto's thyroiditis | ||
| PTC: Papillary thyroid cancer |
| ∗log2FC in expression of this searched gene in stem-like cells from each diseased tissue sample relative to stem-like cells in normal samples in each tissue plotted against the malignancy continuum. Samples are colored based on if they are from different disease stage. |
Top |
Malignant transformation related pathway analysis |
| Find out the enriched GO biological processes and KEGG pathways involved in transition from healthy to precancer to cancer |
| Tissue | Disease Stage | Enriched GO biological Processes |
| Colorectum | AD |  |
| Colorectum | SER |  |
| Colorectum | MSS |  |
| Colorectum | MSI-H |  |
| Colorectum | FAP |  |
| ∗Top 15 enriched GO BP terms are showed in the bar plot of each disease state in each tissue. Each row represents a significant GO biological process which is colored according to the -log10(p.adjust). |
| Page: 1 2 3 4 5 6 7 8 9 |
| GO ID | Tissue | Disease Stage | Description | Gene Ratio | Bg Ratio | pvalue | p.adjust | Count |
| GO:0030449 | Liver | NAFLD | regulation of complement activation | 8/1882 | 21/18723 | 6.29e-04 | 8.21e-03 | 8 |
| GO:00972783 | Liver | NAFLD | complement-dependent cytotoxicity | 5/1882 | 10/18723 | 1.67e-03 | 1.74e-02 | 5 |
| GO:004440312 | Liver | Cirrhotic | biological process involved in symbiotic interaction | 131/4634 | 290/18723 | 2.00e-14 | 1.84e-12 | 131 |
| GO:005109812 | Liver | Cirrhotic | regulation of binding | 148/4634 | 363/18723 | 9.14e-12 | 5.97e-10 | 148 |
| GO:005170211 | Liver | Cirrhotic | biological process involved in interaction with symbiont | 48/4634 | 94/18723 | 3.41e-08 | 1.14e-06 | 48 |
| GO:004339312 | Liver | Cirrhotic | regulation of protein binding | 83/4634 | 196/18723 | 4.44e-08 | 1.42e-06 | 83 |
| GO:00511006 | Liver | Cirrhotic | negative regulation of binding | 63/4634 | 162/18723 | 4.54e-05 | 5.31e-04 | 63 |
| GO:00320914 | Liver | Cirrhotic | negative regulation of protein binding | 40/4634 | 94/18723 | 1.14e-04 | 1.14e-03 | 40 |
| GO:0019835 | Liver | Cirrhotic | cytolysis | 17/4634 | 32/18723 | 5.24e-04 | 4.14e-03 | 17 |
| GO:005109822 | Liver | HCC | regulation of binding | 225/7958 | 363/18723 | 3.78e-14 | 2.37e-12 | 225 |
| GO:004440322 | Liver | HCC | biological process involved in symbiotic interaction | 183/7958 | 290/18723 | 9.13e-13 | 4.59e-11 | 183 |
| GO:004339322 | Liver | HCC | regulation of protein binding | 129/7958 | 196/18723 | 3.27e-11 | 1.26e-09 | 129 |
| GO:00517022 | Liver | HCC | biological process involved in interaction with symbiont | 60/7958 | 94/18723 | 2.41e-05 | 2.54e-04 | 60 |
| GO:005110012 | Liver | HCC | negative regulation of binding | 94/7958 | 162/18723 | 4.69e-05 | 4.50e-04 | 94 |
| GO:003209112 | Liver | HCC | negative regulation of protein binding | 59/7958 | 94/18723 | 5.79e-05 | 5.34e-04 | 59 |
| GO:000225313 | Oral cavity | NEOLP | activation of immune response | 55/2005 | 375/18723 | 9.87e-03 | 4.62e-02 | 55 |
| GO:00022535 | Skin | AK | activation of immune response | 54/1910 | 375/18723 | 5.90e-03 | 3.20e-02 | 54 |
| GO:000225314 | Skin | SCCIS | activation of immune response | 33/919 | 375/18723 | 8.93e-04 | 1.15e-02 | 33 |
| GO:00022536 | Thyroid | HT | activation of immune response | 47/1272 | 375/18723 | 3.55e-05 | 7.40e-04 | 47 |
| GO:00069564 | Thyroid | HT | complement activation | 22/1272 | 130/18723 | 6.17e-05 | 1.16e-03 | 22 |
| Page: 1 2 |
| Pathway ID | Tissue | Disease Stage | Description | Gene Ratio | Bg Ratio | pvalue | p.adjust | qvalue | Count |
| hsa04610 | Liver | NAFLD | Complement and coagulation cascades | 35/1043 | 86/8465 | 2.48e-11 | 2.04e-09 | 1.64e-09 | 35 |
| hsa046101 | Liver | NAFLD | Complement and coagulation cascades | 35/1043 | 86/8465 | 2.48e-11 | 2.04e-09 | 1.64e-09 | 35 |
| hsa046102 | Liver | Cirrhotic | Complement and coagulation cascades | 48/2530 | 86/8465 | 4.41e-07 | 5.44e-06 | 3.35e-06 | 48 |
| hsa046103 | Liver | Cirrhotic | Complement and coagulation cascades | 48/2530 | 86/8465 | 4.41e-07 | 5.44e-06 | 3.35e-06 | 48 |
| hsa046104 | Liver | HCC | Complement and coagulation cascades | 57/4020 | 86/8465 | 3.19e-04 | 1.45e-03 | 8.04e-04 | 57 |
| hsa046105 | Liver | HCC | Complement and coagulation cascades | 57/4020 | 86/8465 | 3.19e-04 | 1.45e-03 | 8.04e-04 | 57 |
| Page: 1 |
Top |
Cell-cell communication analysis |
| Identification of potential cell-cell interactions between two cell types and their ligand-receptor pairs for different disease states |
| Ligand | Receptor | LRpair | Pathway | Tissue | Disease Stage |
| Page: 1 |
Top |
Single-cell gene regulatory network inference analysis |
| Find out the significant the regulons (TFs) and the target genes of each regulon across cell types for different disease states |
| TF | Cell Type | Tissue | Disease Stage | Target Gene | RSS | Regulon Activity |
| ∗The dot plots of a searched regulon are shown for all cell subpopulations in each disease state of each tissue based on the regulon specific score inferred using pySCENIC and by calculating the average expression. |
| Page: 1 |
Top |
Somatic mutation of malignant transformation related genes |
| Annotation of somatic variants for genes involved in malignant transformation |
| Hugo Symbol | Variant Class | Variant Classification | dbSNP RS | HGVSc | HGVSp | HGVSp Short | SWISSPROT | BIOTYPE | SIFT | PolyPhen | Tumor Sample Barcode | Tissue | Histology | Sex | Age | Stage | Therapy Types | Drugs | Outcome |
| CFH | SNV | Missense_Mutation | rs763156179 | c.3377N>T | p.Ser1126Leu | p.S1126L | P08603 | protein_coding | tolerated(0.06) | benign(0.199) | TCGA-A2-A04T-01 | Breast | breast invasive carcinoma | Female | <65 | I/II | Chemotherapy | cyclophosphamide | SD |
| CFH | SNV | Missense_Mutation | c.1566C>A | p.Asp522Glu | p.D522E | P08603 | protein_coding | deleterious(0.04) | benign(0.108) | TCGA-A7-A0CG-01 | Breast | breast invasive carcinoma | Female | >=65 | I/II | Unknown | Unknown | SD | |
| CFH | SNV | Missense_Mutation | novel | c.559N>A | p.Asp187Asn | p.D187N | P08603 | protein_coding | tolerated(0.44) | benign(0.106) | TCGA-A7-A26I-01 | Breast | breast invasive carcinoma | Female | >=65 | I/II | Chemotherapy | cytoxan | SD |
| CFH | SNV | Missense_Mutation | c.343N>T | p.Asn115Tyr | p.N115Y | P08603 | protein_coding | deleterious(0.01) | possibly_damaging(0.481) | TCGA-A8-A08F-01 | Breast | breast invasive carcinoma | Female | <65 | III/IV | Chemotherapy | 5-fluorouracil | CR | |
| CFH | SNV | Missense_Mutation | c.2540N>T | p.Glu847Val | p.E847V | P08603 | protein_coding | deleterious(0.04) | possibly_damaging(0.886) | TCGA-A8-A09Q-01 | Breast | breast invasive carcinoma | Female | >=65 | III/IV | Hormone Therapy | anastrozole | SD | |
| CFH | SNV | Missense_Mutation | rs140107330 | c.770N>A | p.Arg257His | p.R257H | P08603 | protein_coding | tolerated(0.28) | benign(0) | TCGA-AN-A0AS-01 | Breast | breast invasive carcinoma | Female | >=65 | III/IV | Unknown | Unknown | SD |
| CFH | SNV | Missense_Mutation | c.1643C>G | p.Thr548Ser | p.T548S | P08603 | protein_coding | tolerated(0.2) | possibly_damaging(0.469) | TCGA-AN-A0FD-01 | Breast | breast invasive carcinoma | Female | >=65 | I/II | Unknown | Unknown | SD | |
| CFH | SNV | Missense_Mutation | rs374704701 | c.2314N>A | p.Asp772Asn | p.D772N | P08603 | protein_coding | tolerated(0.77) | benign(0.009) | TCGA-B6-A0RE-01 | Breast | breast invasive carcinoma | Female | <65 | I/II | Unknown | Unknown | SD |
| CFH | SNV | Missense_Mutation | novel | c.2806N>A | p.Glu936Lys | p.E936K | P08603 | protein_coding | tolerated(0.81) | benign(0.026) | TCGA-BH-A0B6-01 | Breast | breast invasive carcinoma | Female | <65 | I/II | Unknown | Unknown | SD |
| CFH | SNV | Missense_Mutation | rs548410144 | c.2114N>T | p.Ser705Phe | p.S705F | P08603 | protein_coding | deleterious(0.01) | probably_damaging(1) | TCGA-BH-A0HP-01 | Breast | breast invasive carcinoma | Female | >=65 | III/IV | Chemotherapy | doxorubicin | SD |
| Page: 1 2 3 4 5 6 7 8 9 10 11 12 13 14 15 16 17 18 19 20 21 22 23 24 25 26 |
Top |
Related drugs of malignant transformation related genes |
| Identification of chemicals and drugs interact with genes involved in malignant transfromation |
| (DGIdb 4.0) |
| Entrez ID | Symbol | Category | Interaction Types | Drug Claim Name | Drug Name | PMIDs |
| 3075 | CFH | DRUGGABLE GENOME | photodynamic therapy | 26780119,18292785,18050121 | ||
| 3075 | CFH | DRUGGABLE GENOME | TT-30 | |||
| 3075 | CFH | DRUGGABLE GENOME | eculizumab | ECULIZUMAB | 26724167 | |
| 3075 | CFH | DRUGGABLE GENOME | ranibizumab | RANIBIZUMAB | 26439641,23584701,23204795,22840423,22594510,23559864,24070809,26411831,23842101,23337555 | |
| 3075 | CFH | DRUGGABLE GENOME | Trumenba | |||
| 3075 | CFH | DRUGGABLE GENOME | bevacizumab | BEVACIZUMAB | 26439641,23584701,23204795,22840423,22594510,23559864,24070809,26411831,23842101,23337555 |
| Page: 1 |

Copyright 2023-Present -The University of Texas Health Science Center at Houston |