
|
|||||
|
 | |
| |
| |
| |
| |
| |
|
Gene: CFDP1 |
Gene summary for CFDP1 |
| Gene information | Species | Human | Gene symbol | CFDP1 | Gene ID | 10428 |
| Gene name | craniofacial development protein 1 | |
| Gene Alias | BCNT | |
| Cytomap | 16q23.1 | |
| Gene Type | protein-coding | GO ID | GO:0000902 | UniProtAcc | Q9UEE9 |
Top |
Malignant transformation analysis |
| Identification of the aberrant gene expression in precancerous and cancerous lesions by comparing the gene expression of stem-like cells in diseased tissues with normal stem cells |
| Entrez ID | Symbol | Replicates | Species | Organ | Tissue | Adj P-value | Log2FC | Malignancy |
| 10428 | CFDP1 | LZE2T | Human | Esophagus | ESCC | 6.71e-05 | 6.47e-01 | 0.082 |
| 10428 | CFDP1 | LZE4T | Human | Esophagus | ESCC | 9.30e-29 | 8.36e-01 | 0.0811 |
| 10428 | CFDP1 | LZE5T | Human | Esophagus | ESCC | 2.24e-09 | 6.66e-01 | 0.0514 |
| 10428 | CFDP1 | LZE7T | Human | Esophagus | ESCC | 2.03e-08 | 7.10e-01 | 0.0667 |
| 10428 | CFDP1 | LZE8T | Human | Esophagus | ESCC | 4.63e-15 | 5.21e-01 | 0.067 |
| 10428 | CFDP1 | LZE20T | Human | Esophagus | ESCC | 3.24e-18 | 7.79e-01 | 0.0662 |
| 10428 | CFDP1 | LZE21D1 | Human | Esophagus | HGIN | 3.56e-02 | 4.01e-01 | 0.0632 |
| 10428 | CFDP1 | LZE22D1 | Human | Esophagus | HGIN | 9.68e-08 | 4.78e-01 | 0.0595 |
| 10428 | CFDP1 | LZE22T | Human | Esophagus | ESCC | 2.03e-08 | 7.77e-01 | 0.068 |
| 10428 | CFDP1 | LZE24T | Human | Esophagus | ESCC | 3.27e-39 | 1.12e+00 | 0.0596 |
| 10428 | CFDP1 | LZE21T | Human | Esophagus | ESCC | 2.56e-15 | 7.59e-01 | 0.0655 |
| 10428 | CFDP1 | LZE6T | Human | Esophagus | ESCC | 1.17e-02 | 2.54e-01 | 0.0845 |
| 10428 | CFDP1 | P1T-E | Human | Esophagus | ESCC | 2.78e-23 | 1.41e+00 | 0.0875 |
| 10428 | CFDP1 | P2T-E | Human | Esophagus | ESCC | 1.29e-26 | 5.39e-01 | 0.1177 |
| 10428 | CFDP1 | P4T-E | Human | Esophagus | ESCC | 6.30e-44 | 9.69e-01 | 0.1323 |
| 10428 | CFDP1 | P5T-E | Human | Esophagus | ESCC | 2.06e-45 | 7.88e-01 | 0.1327 |
| 10428 | CFDP1 | P8T-E | Human | Esophagus | ESCC | 6.97e-51 | 9.51e-01 | 0.0889 |
| 10428 | CFDP1 | P9T-E | Human | Esophagus | ESCC | 1.62e-26 | 5.50e-01 | 0.1131 |
| 10428 | CFDP1 | P10T-E | Human | Esophagus | ESCC | 1.29e-36 | 5.96e-01 | 0.116 |
| 10428 | CFDP1 | P11T-E | Human | Esophagus | ESCC | 4.82e-25 | 1.03e+00 | 0.1426 |
| Page: 1 2 3 4 5 6 7 8 |
| Tissue | Expression Dynamics | Abbreviation |
| Esophagus | 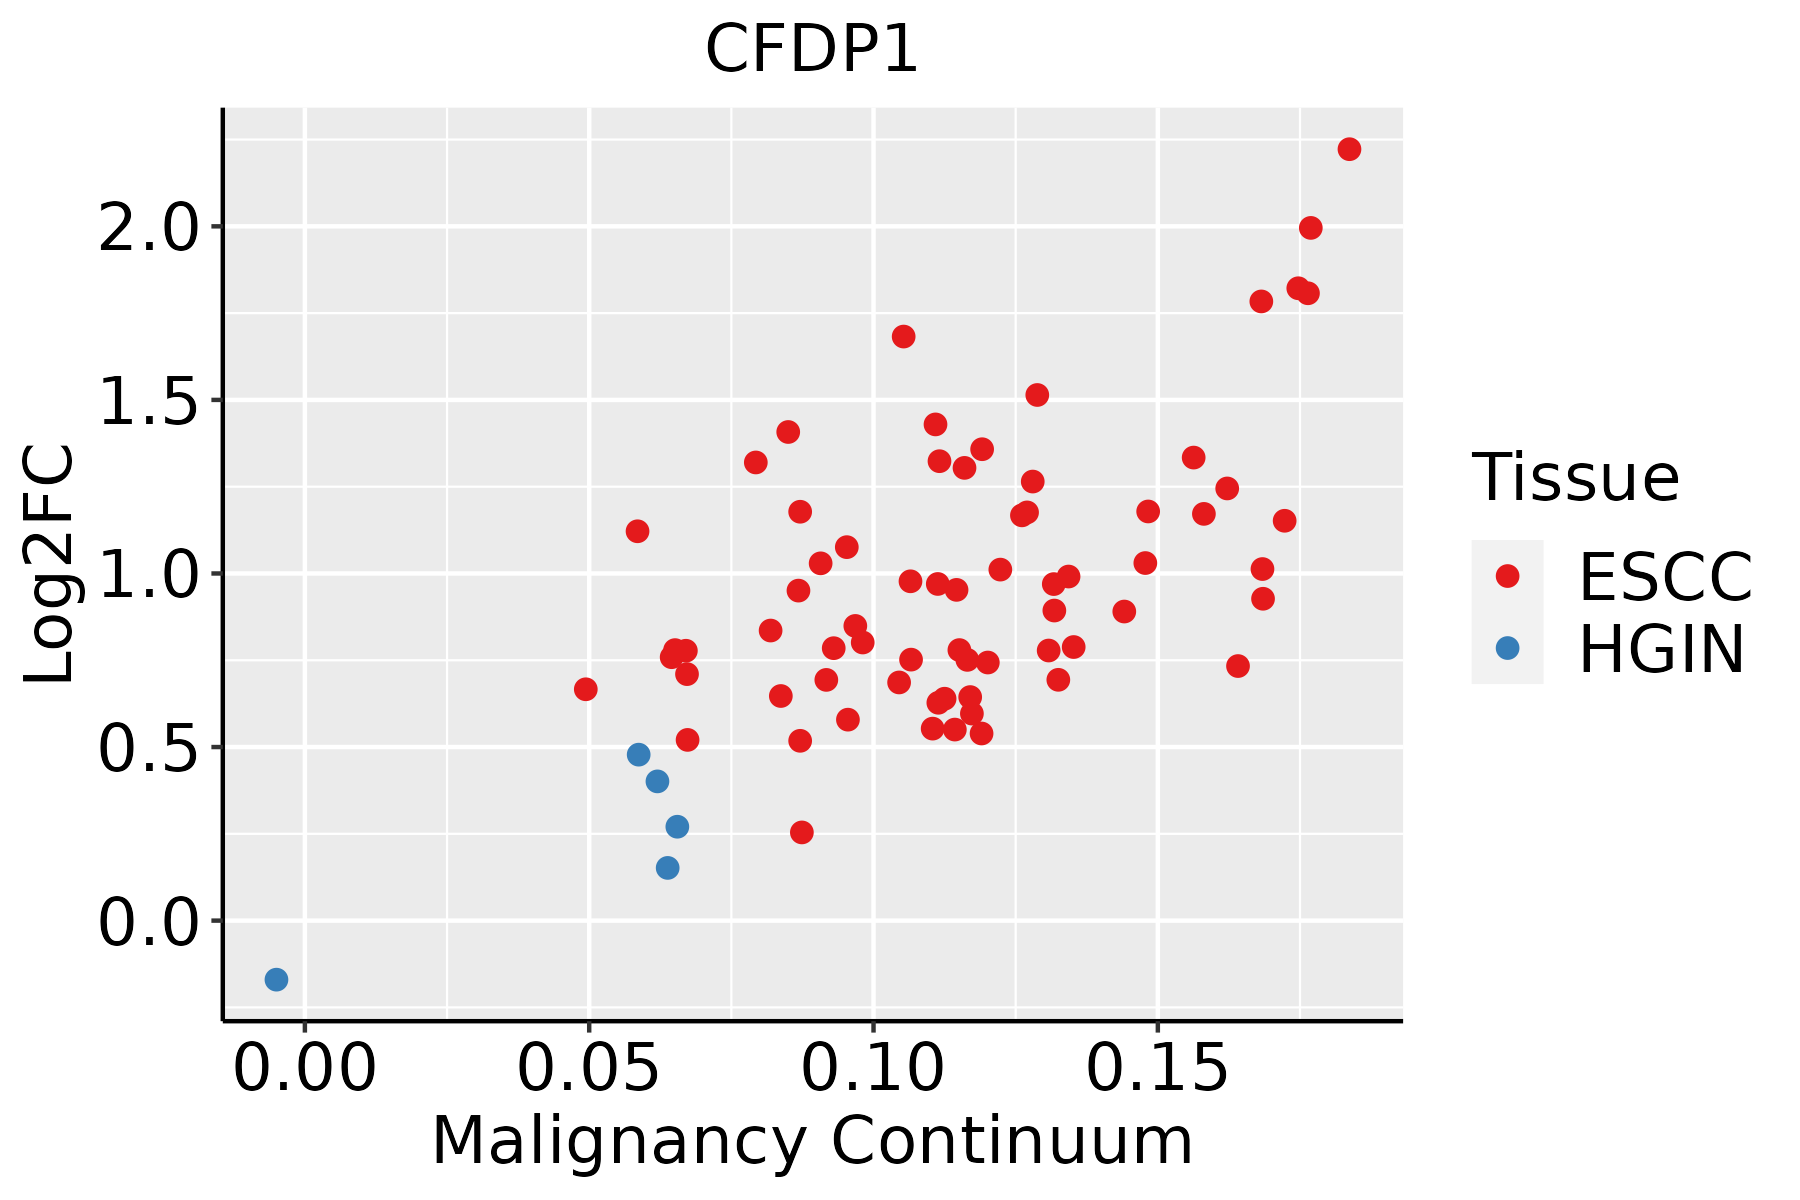 | ESCC: Esophageal squamous cell carcinoma |
| HGIN: High-grade intraepithelial neoplasias | ||
| LGIN: Low-grade intraepithelial neoplasias | ||
| GC |  | CAG: Chronic atrophic gastritis |
| CAG with IM: Chronic atrophic gastritis with intestinal metaplasia | ||
| CSG: Chronic superficial gastritis | ||
| GC: Gastric cancer | ||
| SIM: Severe intestinal metaplasia | ||
| WIM: Wild intestinal metaplasia | ||
| Liver |  | HCC: Hepatocellular carcinoma |
| NAFLD: Non-alcoholic fatty liver disease | ||
| Oral Cavity |  | EOLP: Erosive Oral lichen planus |
| LP: leukoplakia | ||
| NEOLP: Non-erosive oral lichen planus | ||
| OSCC: Oral squamous cell carcinoma | ||
| Skin | 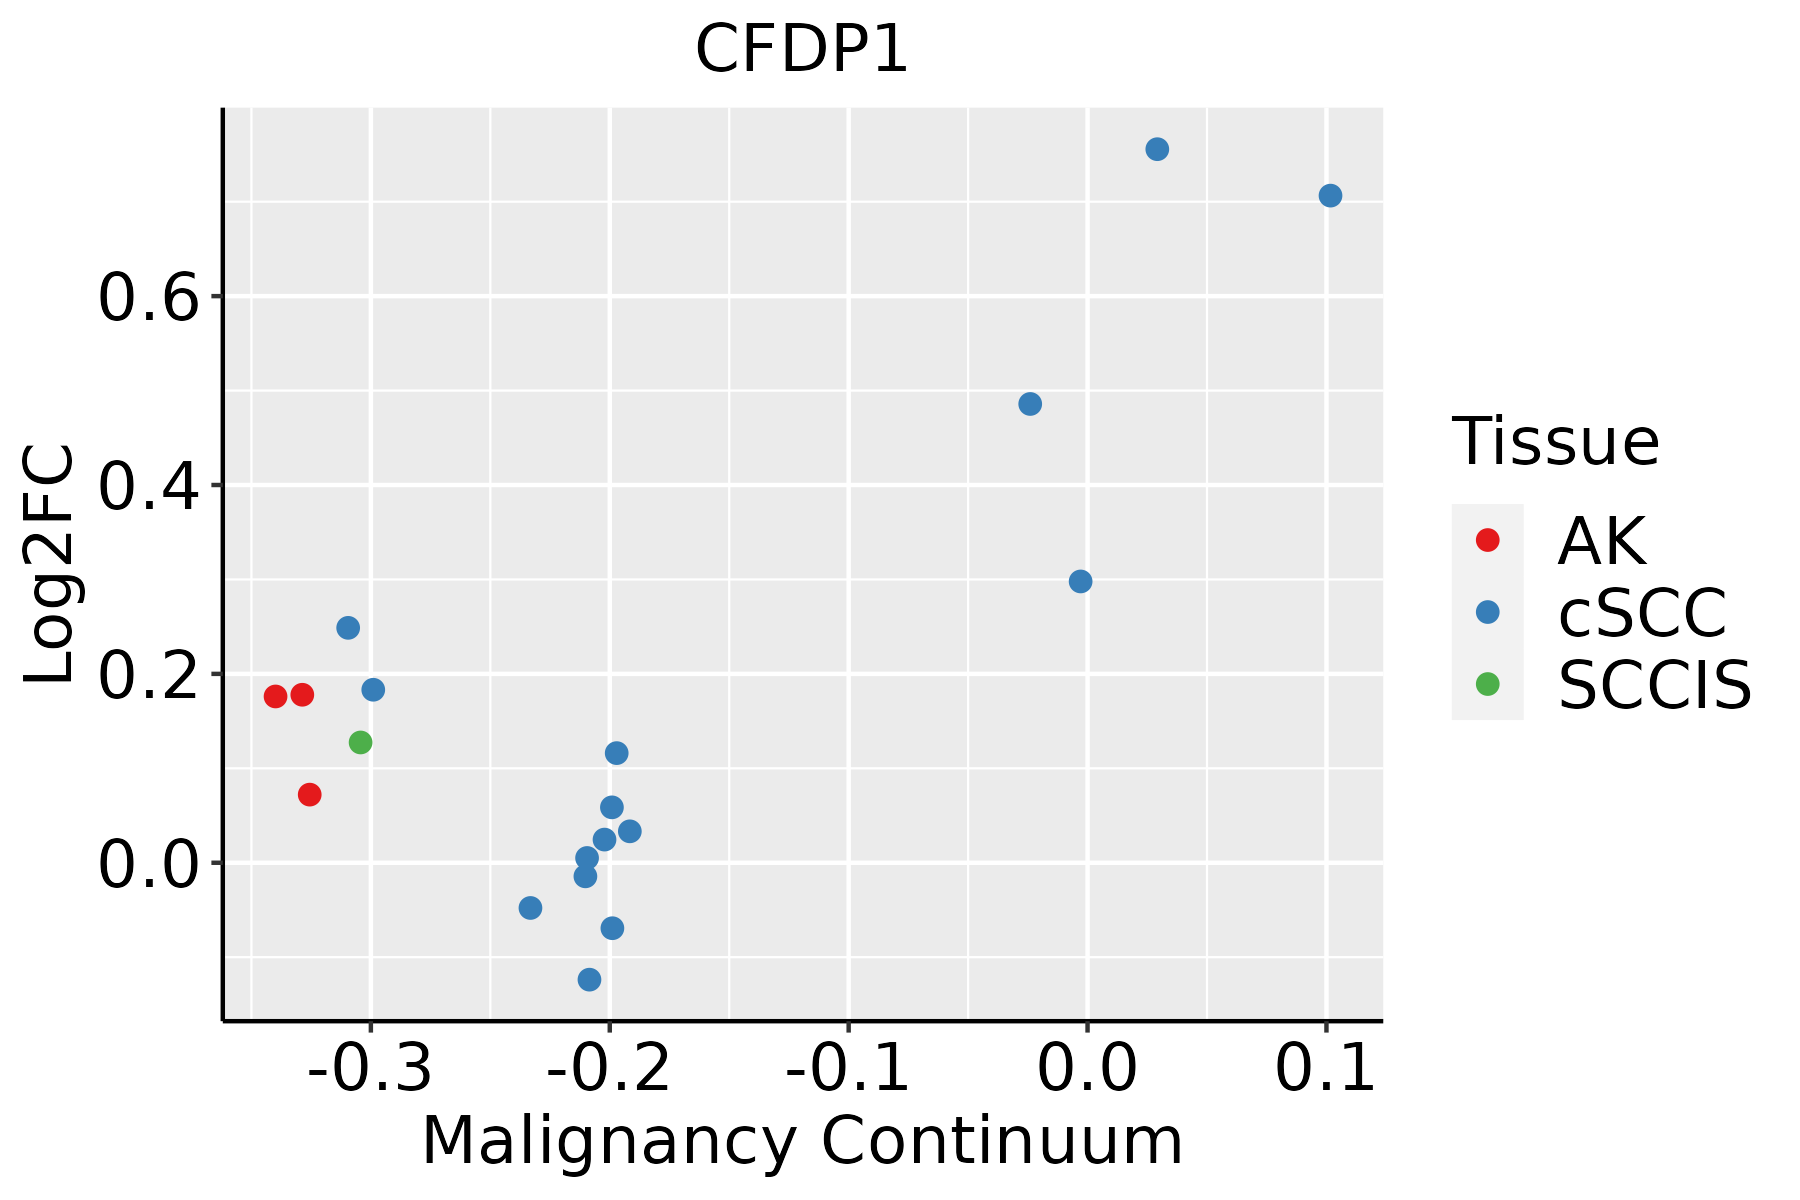 | AK: Actinic keratosis |
| cSCC: Cutaneous squamous cell carcinoma | ||
| SCCIS:squamous cell carcinoma in situ | ||
| Thyroid | 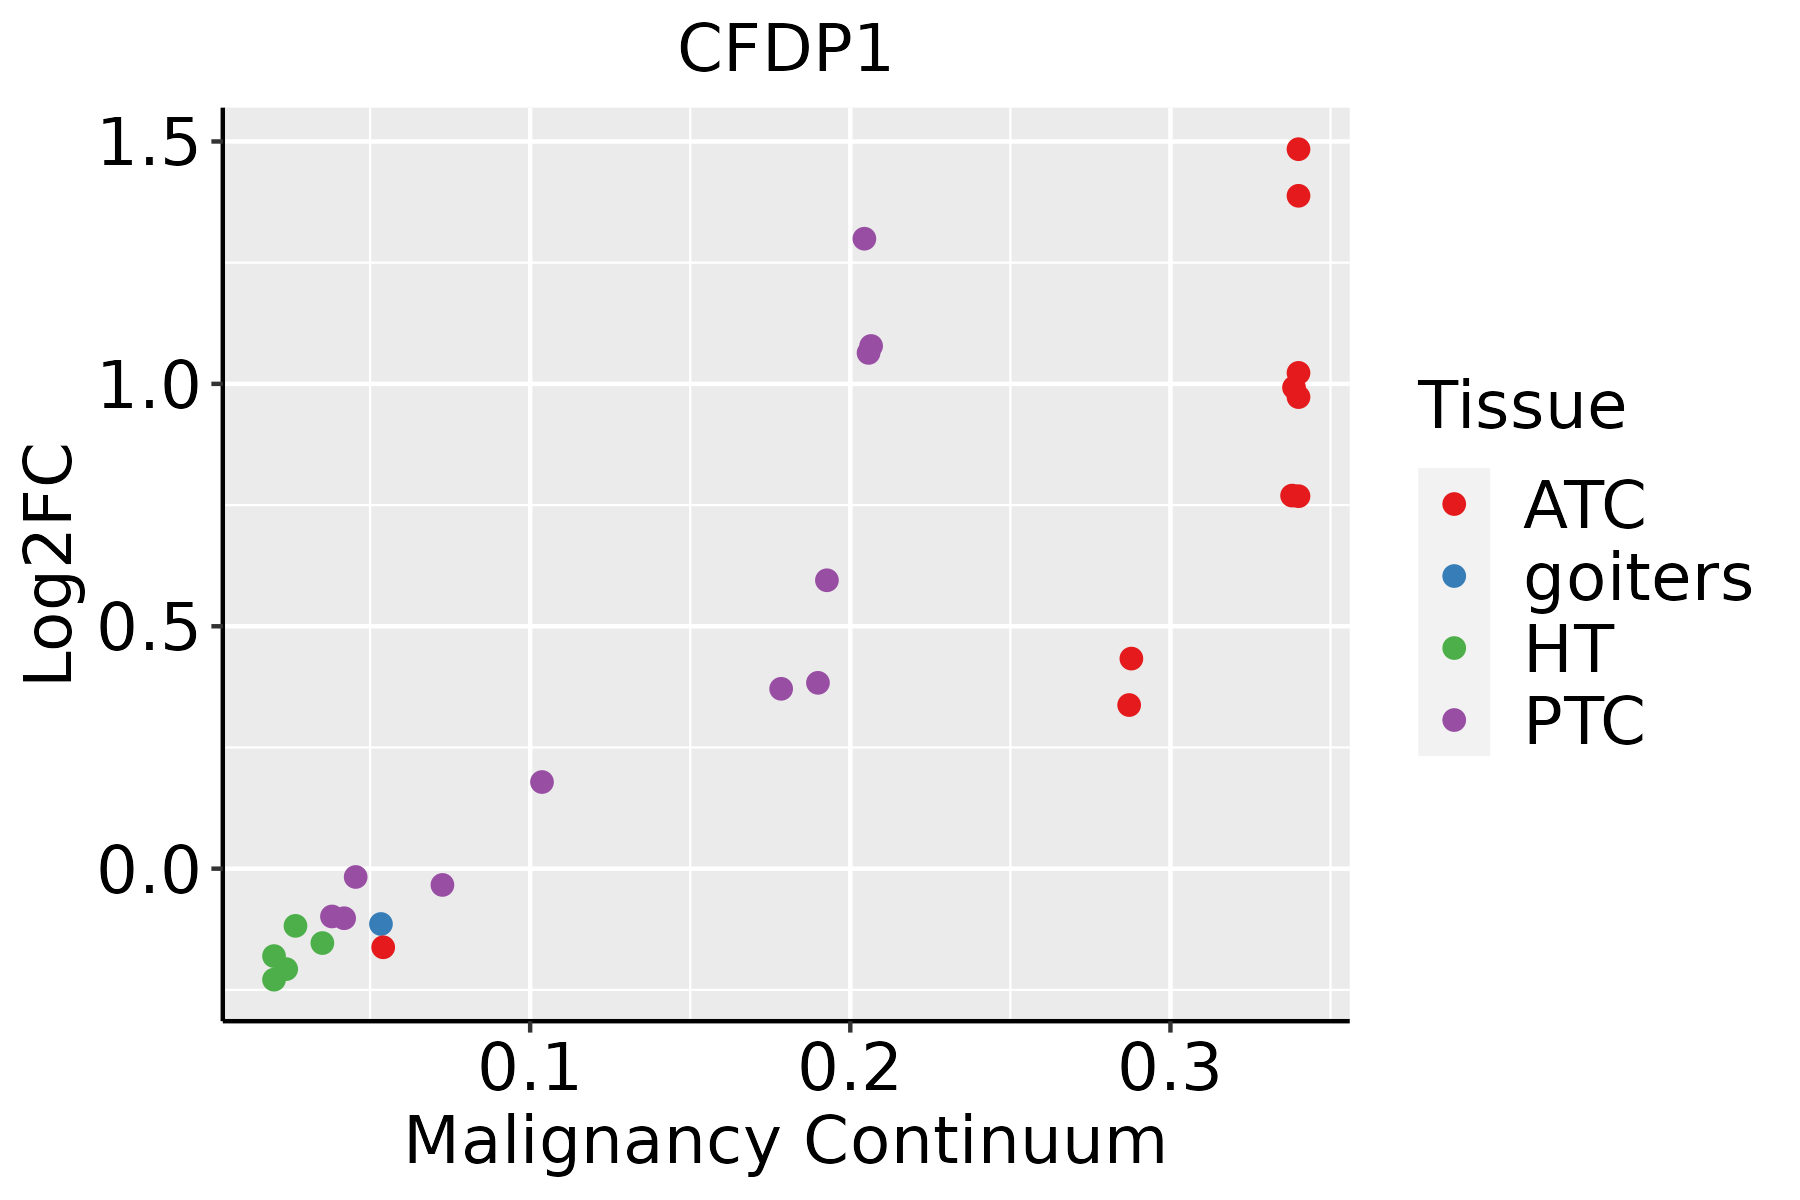 | ATC: Anaplastic thyroid cancer |
| HT: Hashimoto's thyroiditis | ||
| PTC: Papillary thyroid cancer |
| ∗log2FC in expression of this searched gene in stem-like cells from each diseased tissue sample relative to stem-like cells in normal samples in each tissue plotted against the malignancy continuum. Samples are colored based on if they are from different disease stage. |
Top |
Malignant transformation related pathway analysis |
| Find out the enriched GO biological processes and KEGG pathways involved in transition from healthy to precancer to cancer |
| Tissue | Disease Stage | Enriched GO biological Processes |
| Colorectum | AD |  |
| Colorectum | SER |  |
| Colorectum | MSS |  |
| Colorectum | MSI-H |  |
| Colorectum | FAP |  |
| ∗Top 15 enriched GO BP terms are showed in the bar plot of each disease state in each tissue. Each row represents a significant GO biological process which is colored according to the -log10(p.adjust). |
| Page: 1 2 3 4 5 6 7 8 9 |
| GO ID | Tissue | Disease Stage | Description | Gene Ratio | Bg Ratio | pvalue | p.adjust | Count |
| GO:002260420 | Esophagus | ESCC | regulation of cell morphogenesis | 180/8552 | 309/18723 | 5.19e-06 | 5.45e-05 | 180 |
| GO:000836018 | Esophagus | ESCC | regulation of cell shape | 92/8552 | 154/18723 | 3.00e-04 | 1.81e-03 | 92 |
| GO:00443463 | Esophagus | ESCC | fibroblast apoptotic process | 16/8552 | 22/18723 | 9.46e-03 | 3.28e-02 | 16 |
| GO:002260412 | Liver | Cirrhotic | regulation of cell morphogenesis | 127/4634 | 309/18723 | 1.45e-10 | 7.44e-09 | 127 |
| GO:000836012 | Liver | Cirrhotic | regulation of cell shape | 69/4634 | 154/18723 | 4.21e-08 | 1.36e-06 | 69 |
| GO:002260422 | Liver | HCC | regulation of cell morphogenesis | 188/7958 | 309/18723 | 4.84e-11 | 1.82e-09 | 188 |
| GO:000836022 | Liver | HCC | regulation of cell shape | 92/7958 | 154/18723 | 1.15e-05 | 1.31e-04 | 92 |
| GO:002260419 | Oral cavity | OSCC | regulation of cell morphogenesis | 163/7305 | 309/18723 | 5.66e-07 | 8.19e-06 | 163 |
| GO:000836016 | Oral cavity | OSCC | regulation of cell shape | 88/7305 | 154/18723 | 3.73e-06 | 4.42e-05 | 88 |
| GO:0044346 | Oral cavity | OSCC | fibroblast apoptotic process | 16/7305 | 22/18723 | 1.40e-03 | 6.79e-03 | 16 |
| GO:2000269 | Oral cavity | OSCC | regulation of fibroblast apoptotic process | 13/7305 | 19/18723 | 9.07e-03 | 3.26e-02 | 13 |
| GO:00443461 | Oral cavity | LP | fibroblast apoptotic process | 13/4623 | 22/18723 | 6.11e-04 | 5.58e-03 | 13 |
| GO:0022604110 | Oral cavity | LP | regulation of cell morphogenesis | 101/4623 | 309/18723 | 8.65e-04 | 7.50e-03 | 101 |
| GO:000836017 | Oral cavity | LP | regulation of cell shape | 53/4623 | 154/18723 | 4.22e-03 | 2.70e-02 | 53 |
| GO:20002691 | Oral cavity | LP | regulation of fibroblast apoptotic process | 10/4623 | 19/18723 | 8.09e-03 | 4.40e-02 | 10 |
| GO:002260433 | Oral cavity | NEOLP | regulation of cell morphogenesis | 69/2005 | 309/18723 | 2.07e-09 | 1.29e-07 | 69 |
| GO:000836033 | Oral cavity | NEOLP | regulation of cell shape | 41/2005 | 154/18723 | 2.35e-08 | 1.03e-06 | 41 |
| GO:002260427 | Skin | cSCC | regulation of cell morphogenesis | 114/4864 | 309/18723 | 1.34e-05 | 1.68e-04 | 114 |
| GO:000836025 | Skin | cSCC | regulation of cell shape | 57/4864 | 154/18723 | 1.61e-03 | 9.90e-03 | 57 |
| GO:004434611 | Skin | cSCC | fibroblast apoptotic process | 12/4864 | 22/18723 | 4.04e-03 | 2.15e-02 | 12 |
| Page: 1 2 |
| Pathway ID | Tissue | Disease Stage | Description | Gene Ratio | Bg Ratio | pvalue | p.adjust | qvalue | Count |
| Page: 1 |
Top |
Cell-cell communication analysis |
| Identification of potential cell-cell interactions between two cell types and their ligand-receptor pairs for different disease states |
| Ligand | Receptor | LRpair | Pathway | Tissue | Disease Stage |
| Page: 1 |
Top |
Single-cell gene regulatory network inference analysis |
| Find out the significant the regulons (TFs) and the target genes of each regulon across cell types for different disease states |
| TF | Cell Type | Tissue | Disease Stage | Target Gene | RSS | Regulon Activity |
| ∗The dot plots of a searched regulon are shown for all cell subpopulations in each disease state of each tissue based on the regulon specific score inferred using pySCENIC and by calculating the average expression. |
| Page: 1 |
Top |
Somatic mutation of malignant transformation related genes |
| Annotation of somatic variants for genes involved in malignant transformation |
| Hugo Symbol | Variant Class | Variant Classification | dbSNP RS | HGVSc | HGVSp | HGVSp Short | SWISSPROT | BIOTYPE | SIFT | PolyPhen | Tumor Sample Barcode | Tissue | Histology | Sex | Age | Stage | Therapy Types | Drugs | Outcome |
| CFDP1 | SNV | Missense_Mutation | c.714N>A | p.Met238Ile | p.M238I | Q9UEE9 | protein_coding | tolerated(0.16) | benign(0.015) | TCGA-AC-A23H-01 | Breast | breast invasive carcinoma | Female | >=65 | I/II | Unknown | Unknown | PD | |
| CFDP1 | SNV | Missense_Mutation | rs377603272 | c.465N>C | p.Glu155Asp | p.E155D | Q9UEE9 | protein_coding | tolerated(0.11) | benign(0.006) | TCGA-AC-A23H-01 | Breast | breast invasive carcinoma | Female | >=65 | I/II | Unknown | Unknown | PD |
| CFDP1 | SNV | Missense_Mutation | novel | c.797G>C | p.Arg266Pro | p.R266P | Q9UEE9 | protein_coding | deleterious(0) | probably_damaging(0.961) | TCGA-C5-A3HE-01 | Cervix | cervical & endocervical cancer | Female | <65 | I/II | Unknown | Unknown | PD |
| CFDP1 | SNV | Missense_Mutation | rs755077989 | c.763N>A | p.Glu255Lys | p.E255K | Q9UEE9 | protein_coding | deleterious(0) | probably_damaging(0.995) | TCGA-IR-A3LL-01 | Cervix | cervical & endocervical cancer | Female | <65 | I/II | Chemotherapy | cisplatin | CR |
| CFDP1 | SNV | Missense_Mutation | c.805N>C | p.Glu269Gln | p.E269Q | Q9UEE9 | protein_coding | tolerated(0.15) | benign(0.306) | TCGA-JW-A5VL-01 | Cervix | cervical & endocervical cancer | Female | <65 | I/II | Unknown | Unknown | SD | |
| CFDP1 | SNV | Missense_Mutation | c.721N>T | p.Leu241Phe | p.L241F | Q9UEE9 | protein_coding | deleterious(0) | probably_damaging(0.999) | TCGA-AZ-6599-01 | Colorectum | colon adenocarcinoma | Male | >=65 | I/II | Unknown | Unknown | SD | |
| CFDP1 | SNV | Missense_Mutation | c.785N>T | p.Ala262Val | p.A262V | Q9UEE9 | protein_coding | deleterious(0) | possibly_damaging(0.721) | TCGA-QG-A5Z2-01 | Colorectum | colon adenocarcinoma | Male | <65 | I/II | Unknown | Unknown | SD | |
| CFDP1 | SNV | Missense_Mutation | novel | c.137N>T | p.Gln46Leu | p.Q46L | Q9UEE9 | protein_coding | tolerated(0.19) | benign(0.015) | TCGA-AG-A002-01 | Colorectum | rectum adenocarcinoma | Male | <65 | I/II | Unknown | Unknown | SD |
| CFDP1 | SNV | Missense_Mutation | c.585N>T | p.Gln195His | p.Q195H | Q9UEE9 | protein_coding | deleterious(0.01) | benign(0.44) | TCGA-A5-A0G2-01 | Endometrium | uterine corpus endometrioid carcinoma | Female | <65 | III/IV | Unknown | Unknown | SD | |
| CFDP1 | SNV | Missense_Mutation | c.772N>A | p.Gly258Ser | p.G258S | Q9UEE9 | protein_coding | tolerated(0.96) | benign(0.021) | TCGA-A5-A1OF-01 | Endometrium | uterine corpus endometrioid carcinoma | Female | <65 | I/II | Unknown | Unknown | SD |
| Page: 1 2 3 |
Top |
Related drugs of malignant transformation related genes |
| Identification of chemicals and drugs interact with genes involved in malignant transfromation |
| (DGIdb 4.0) |
| Entrez ID | Symbol | Category | Interaction Types | Drug Claim Name | Drug Name | PMIDs |
| Page: 1 |

Copyright 2023-Present -The University of Texas Health Science Center at Houston |