
|
|||||
|
 | |
| |
| |
| |
| |
| |
|
Gene: CFB |
Gene summary for CFB |
| Gene information | Species | Human | Gene symbol | CFB | Gene ID | 629 |
| Gene name | complement factor B | |
| Gene Alias | AHUS4 | |
| Cytomap | 6p21.33 | |
| Gene Type | protein-coding | GO ID | GO:0002252 | UniProtAcc | A0A1U9X7H8 |
Top |
Malignant transformation analysis |
| Identification of the aberrant gene expression in precancerous and cancerous lesions by comparing the gene expression of stem-like cells in diseased tissues with normal stem cells |
| Entrez ID | Symbol | Replicates | Species | Organ | Tissue | Adj P-value | Log2FC | Malignancy |
| 629 | CFB | AEH-subject1 | Human | Endometrium | AEH | 4.00e-10 | 3.37e-01 | -0.3059 |
| 629 | CFB | AEH-subject2 | Human | Endometrium | AEH | 1.88e-12 | 4.81e-01 | -0.2525 |
| 629 | CFB | AEH-subject4 | Human | Endometrium | AEH | 2.45e-12 | 5.08e-01 | -0.2657 |
| 629 | CFB | EEC-subject1 | Human | Endometrium | EEC | 5.15e-03 | 1.24e-01 | -0.2682 |
| 629 | CFB | EEC-subject2 | Human | Endometrium | EEC | 1.01e-18 | 4.13e-01 | -0.2607 |
| 629 | CFB | EEC-subject4 | Human | Endometrium | EEC | 3.99e-08 | 2.70e-01 | -0.2571 |
| 629 | CFB | EEC-subject5 | Human | Endometrium | EEC | 1.44e-02 | 1.33e-01 | -0.249 |
| 629 | CFB | GSM6177620_NYU_UCEC1_lib1_lib1 | Human | Endometrium | EEC | 2.07e-10 | 5.61e-01 | -0.1869 |
| 629 | CFB | GSM6177620_NYU_UCEC1_lib2_lib2 | Human | Endometrium | EEC | 1.64e-10 | 6.21e-01 | -0.1875 |
| 629 | CFB | GSM6177620_NYU_UCEC1_lib3_lib3 | Human | Endometrium | EEC | 5.07e-03 | 3.04e-01 | -0.1883 |
| 629 | CFB | GSM6177621_NYU_UCEC2_lib1_lib1 | Human | Endometrium | EEC | 1.66e-02 | 2.00e-01 | -0.1934 |
| 629 | CFB | GSM6177622_NYU_UCEC3_lib1_lib1 | Human | Endometrium | EEC | 1.10e-11 | 4.85e-01 | -0.1917 |
| 629 | CFB | GSM6177622_NYU_UCEC3_lib2_lib2 | Human | Endometrium | EEC | 1.17e-11 | 5.78e-01 | -0.1916 |
| 629 | CFB | GSM6177623_NYU_UCEC3_Vis | Human | Endometrium | EEC | 5.40e-05 | 1.85e-01 | -0.1269 |
| 629 | CFB | LZE3D | Human | Esophagus | HGIN | 3.03e-02 | 4.58e-01 | 0.0668 |
| 629 | CFB | LZE5T | Human | Esophagus | ESCC | 2.72e-07 | 5.11e-01 | 0.0514 |
| 629 | CFB | LZE8T | Human | Esophagus | ESCC | 7.47e-18 | 4.79e-01 | 0.067 |
| 629 | CFB | LZE20T | Human | Esophagus | ESCC | 6.34e-09 | 9.97e-01 | 0.0662 |
| 629 | CFB | LZE22T | Human | Esophagus | ESCC | 1.34e-06 | 8.28e-01 | 0.068 |
| 629 | CFB | LZE24T | Human | Esophagus | ESCC | 3.28e-16 | 8.57e-01 | 0.0596 |
| Page: 1 2 3 4 5 6 |
| Tissue | Expression Dynamics | Abbreviation |
| Endometrium |  | AEH: Atypical endometrial hyperplasia |
| EEC: Endometrioid Cancer | ||
| Esophagus | 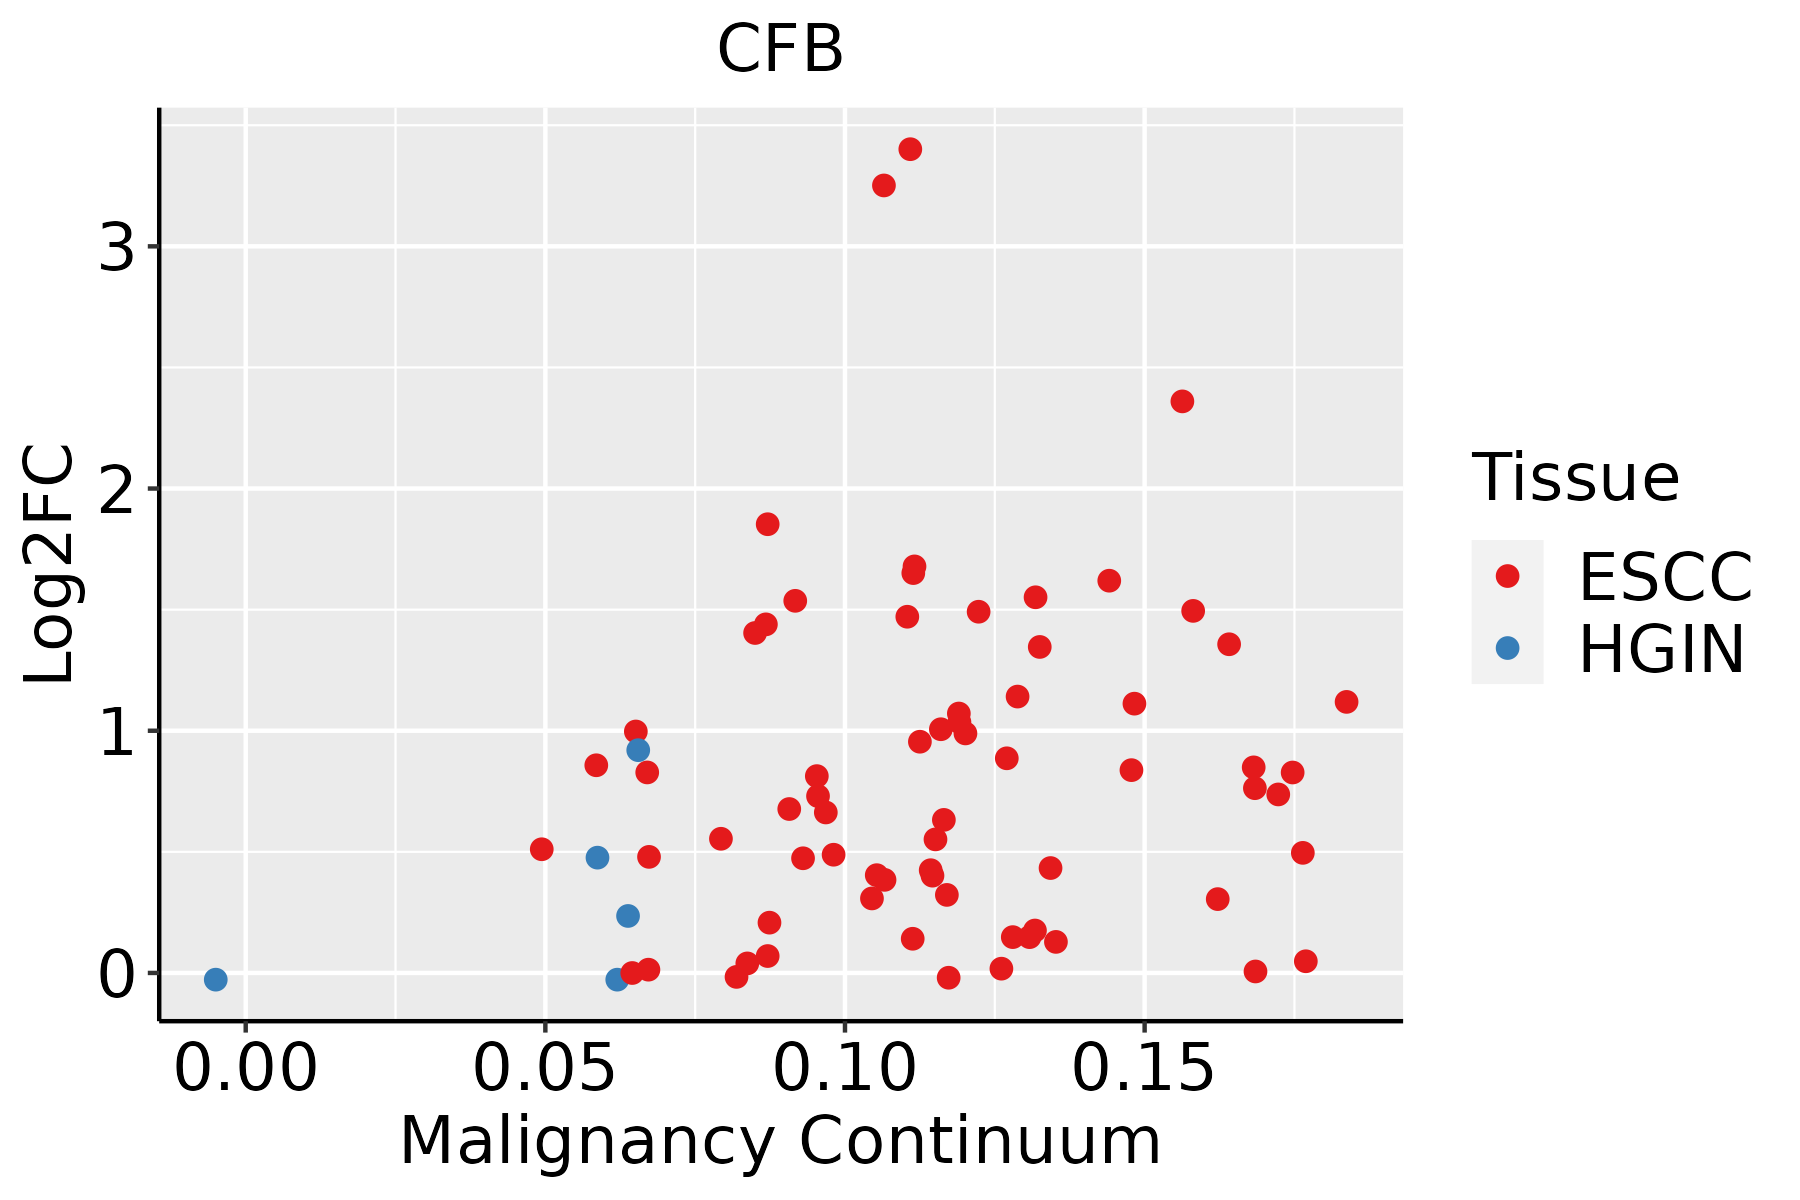 | ESCC: Esophageal squamous cell carcinoma |
| HGIN: High-grade intraepithelial neoplasias | ||
| LGIN: Low-grade intraepithelial neoplasias | ||
| GC |  | CAG: Chronic atrophic gastritis |
| CAG with IM: Chronic atrophic gastritis with intestinal metaplasia | ||
| CSG: Chronic superficial gastritis | ||
| GC: Gastric cancer | ||
| SIM: Severe intestinal metaplasia | ||
| WIM: Wild intestinal metaplasia | ||
| Liver |  | HCC: Hepatocellular carcinoma |
| NAFLD: Non-alcoholic fatty liver disease | ||
| Lung | 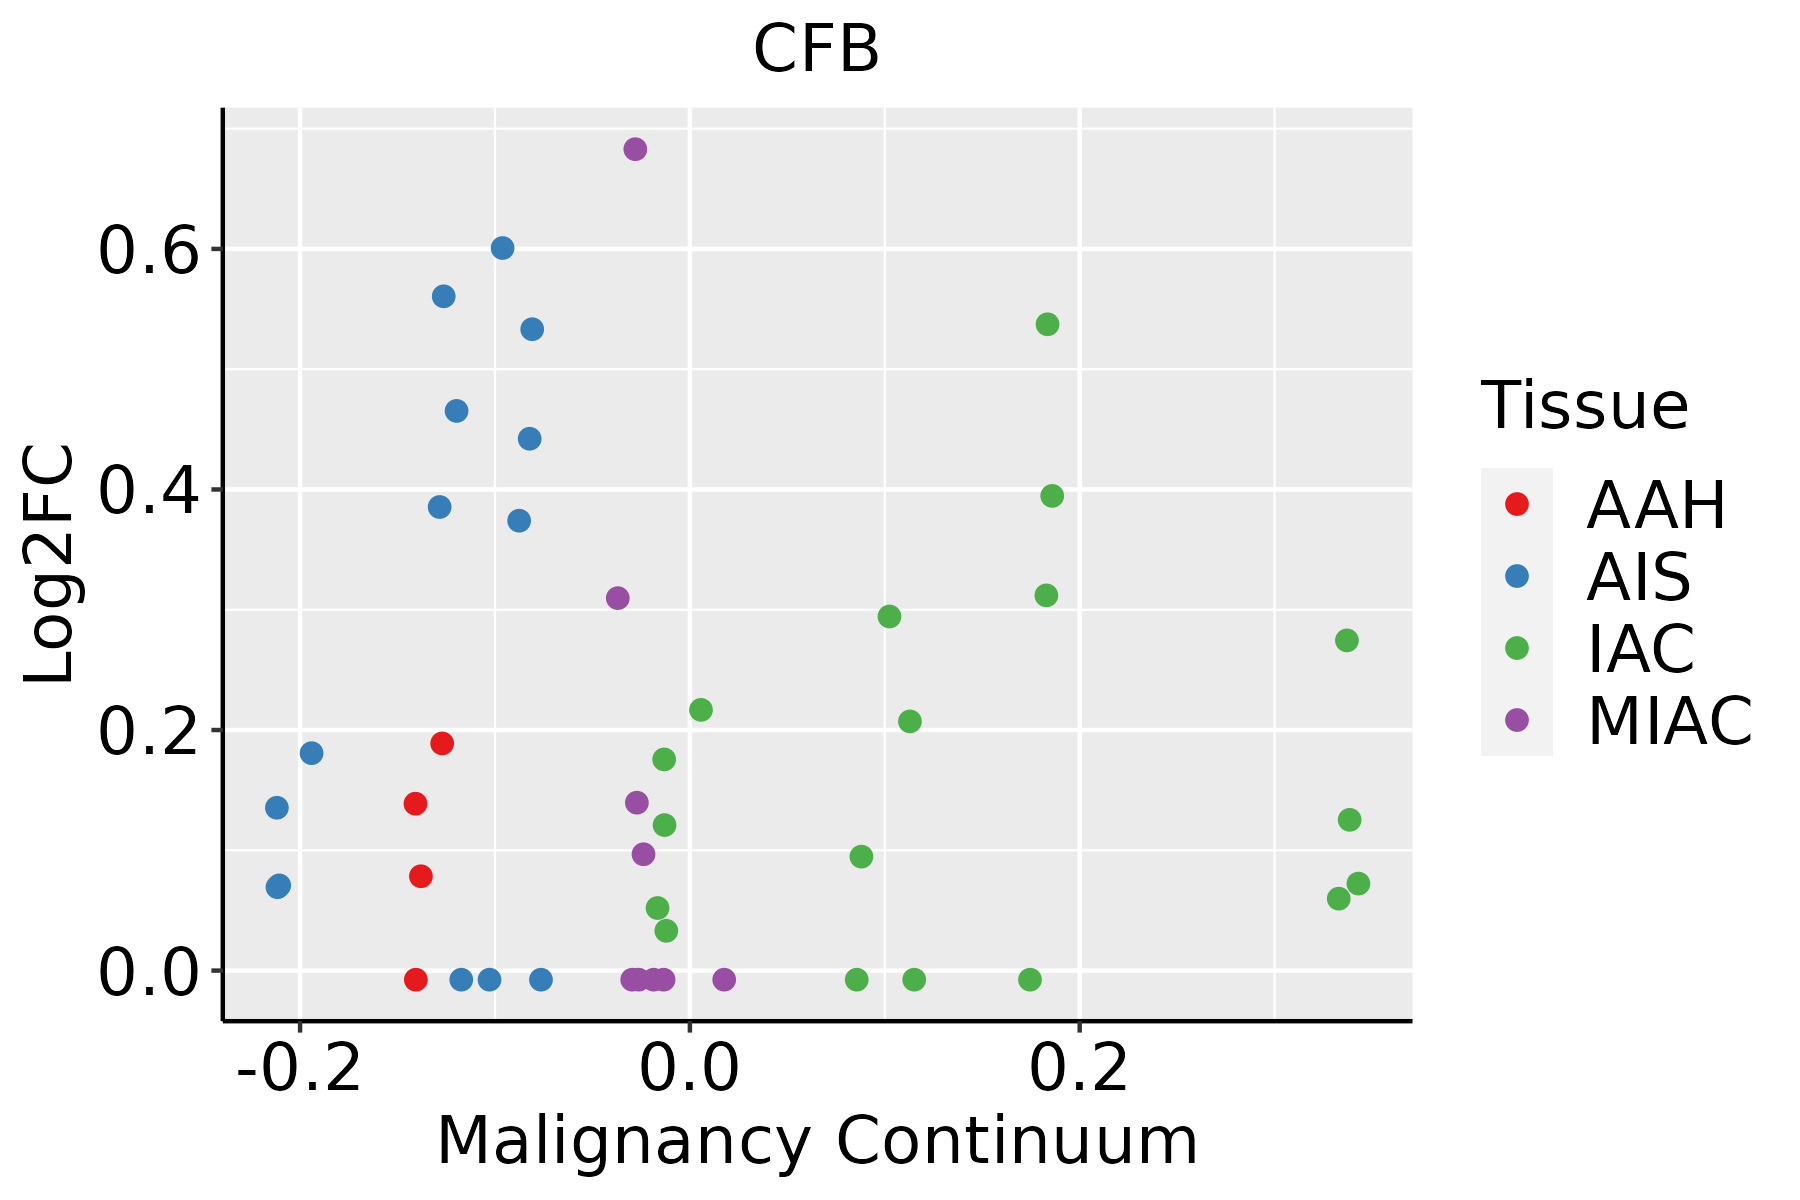 | AAH: Atypical adenomatous hyperplasia |
| AIS: Adenocarcinoma in situ | ||
| IAC: Invasive lung adenocarcinoma | ||
| MIA: Minimally invasive adenocarcinoma | ||
| Thyroid | 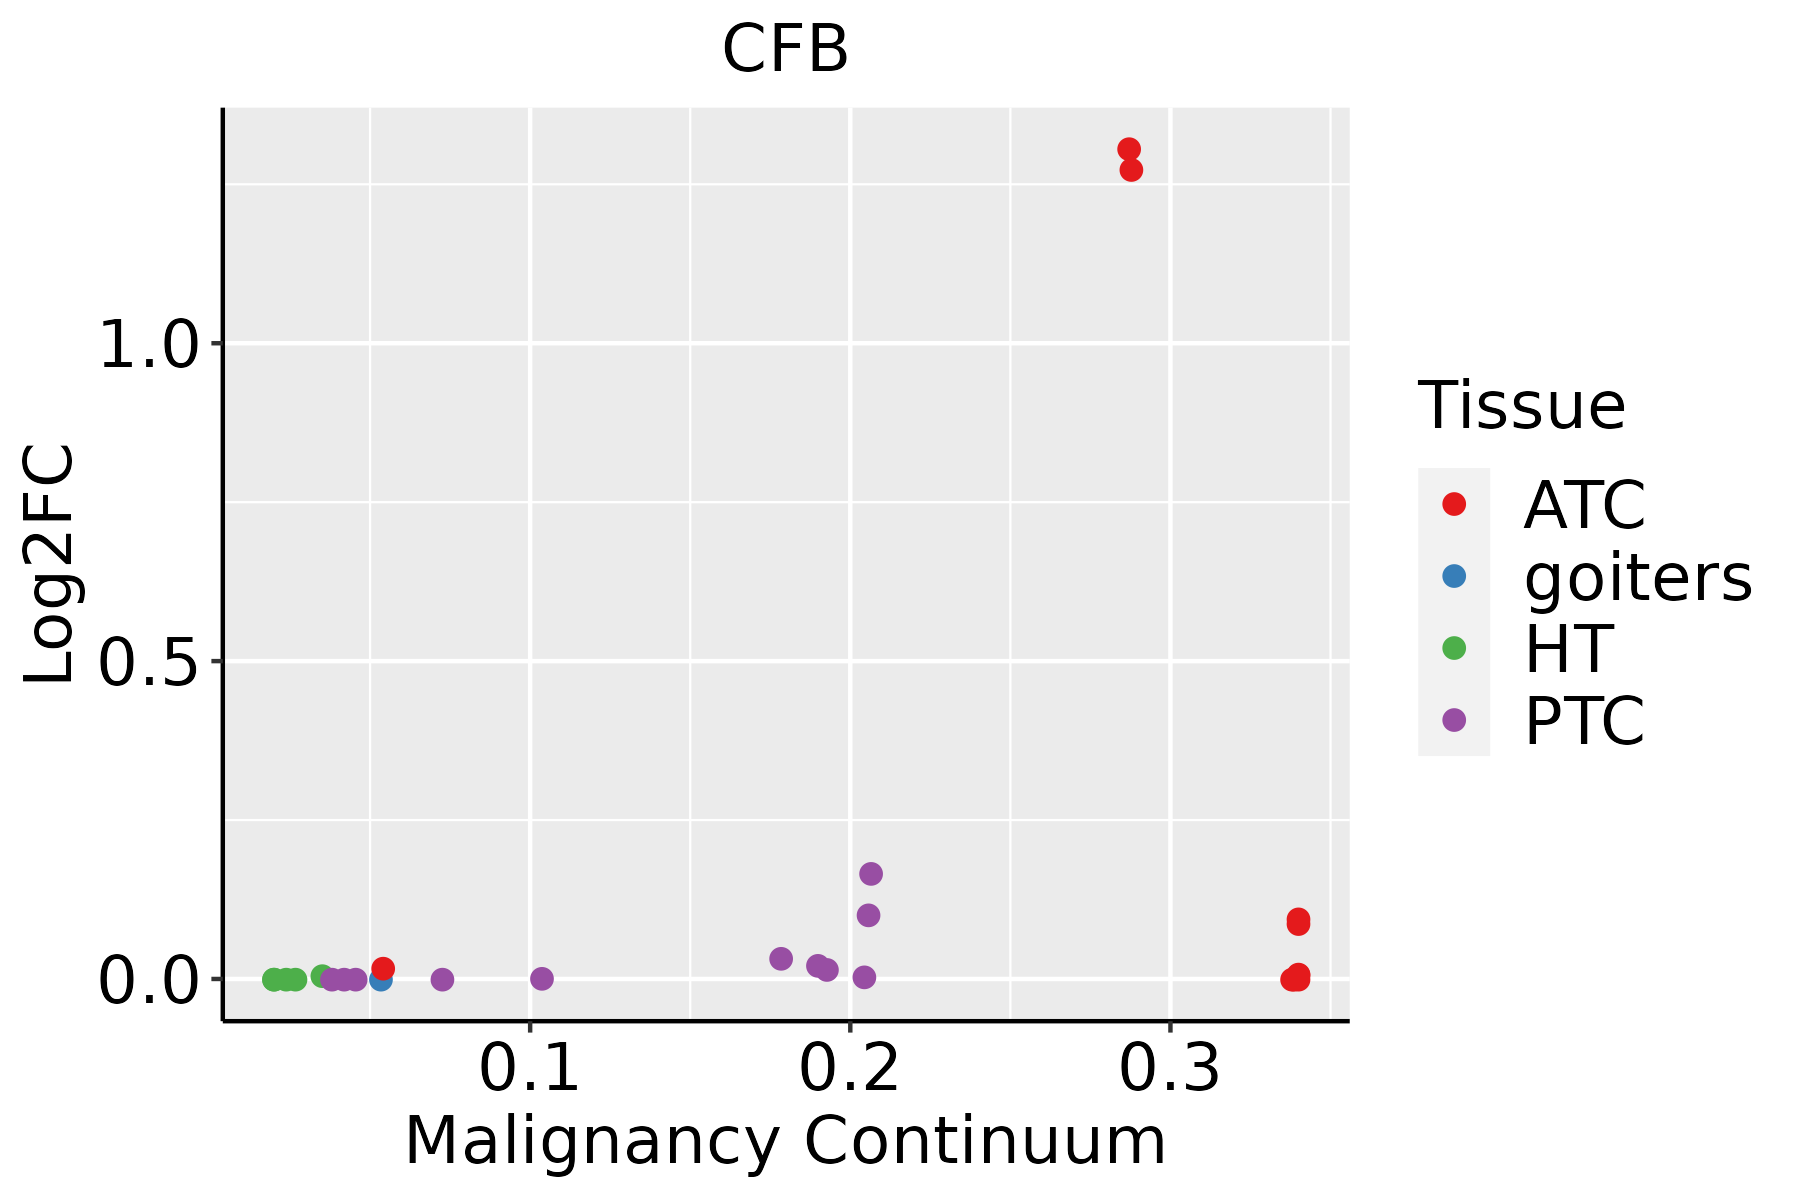 | ATC: Anaplastic thyroid cancer |
| HT: Hashimoto's thyroiditis | ||
| PTC: Papillary thyroid cancer |
| ∗log2FC in expression of this searched gene in stem-like cells from each diseased tissue sample relative to stem-like cells in normal samples in each tissue plotted against the malignancy continuum. Samples are colored based on if they are from different disease stage. |
Top |
Malignant transformation related pathway analysis |
| Find out the enriched GO biological processes and KEGG pathways involved in transition from healthy to precancer to cancer |
| Tissue | Disease Stage | Enriched GO biological Processes |
| Colorectum | AD |  |
| Colorectum | SER |  |
| Colorectum | MSS |  |
| Colorectum | MSI-H |  |
| Colorectum | FAP |  |
| ∗Top 15 enriched GO BP terms are showed in the bar plot of each disease state in each tissue. Each row represents a significant GO biological process which is colored according to the -log10(p.adjust). |
| Page: 1 2 3 4 5 6 7 8 9 |
| GO ID | Tissue | Disease Stage | Description | Gene Ratio | Bg Ratio | pvalue | p.adjust | Count |
| GO:0006959 | Stomach | GC | humoral immune response | 42/1159 | 317/18723 | 2.59e-06 | 1.10e-04 | 42 |
| GO:0002253 | Stomach | GC | activation of immune response | 36/1159 | 375/18723 | 6.03e-03 | 4.55e-02 | 36 |
| GO:0006956 | Stomach | GC | complement activation | 16/1159 | 130/18723 | 6.54e-03 | 4.83e-02 | 16 |
| GO:00069591 | Stomach | CAG with IM | humoral immune response | 39/1050 | 317/18723 | 3.43e-06 | 1.36e-04 | 39 |
| GO:00069561 | Stomach | CAG with IM | complement activation | 15/1050 | 130/18723 | 6.22e-03 | 4.75e-02 | 15 |
| GO:00069592 | Stomach | CSG | humoral immune response | 40/1034 | 317/18723 | 9.26e-07 | 4.76e-05 | 40 |
| GO:00069562 | Stomach | CSG | complement activation | 15/1034 | 130/18723 | 5.42e-03 | 4.35e-02 | 15 |
| GO:00022531 | Stomach | CSG | activation of immune response | 33/1034 | 375/18723 | 5.70e-03 | 4.54e-02 | 33 |
| Page: 1 |
| Pathway ID | Tissue | Disease Stage | Description | Gene Ratio | Bg Ratio | pvalue | p.adjust | qvalue | Count |
| hsa0517126 | Endometrium | AEH | Coronavirus disease - COVID-19 | 99/1197 | 232/8465 | 5.19e-27 | 3.37e-25 | 2.47e-25 | 99 |
| hsa05171112 | Endometrium | AEH | Coronavirus disease - COVID-19 | 99/1197 | 232/8465 | 5.19e-27 | 3.37e-25 | 2.47e-25 | 99 |
| hsa0517127 | Endometrium | EEC | Coronavirus disease - COVID-19 | 99/1237 | 232/8465 | 7.43e-26 | 4.89e-24 | 3.65e-24 | 99 |
| hsa0517136 | Endometrium | EEC | Coronavirus disease - COVID-19 | 99/1237 | 232/8465 | 7.43e-26 | 4.89e-24 | 3.65e-24 | 99 |
| hsa05171211 | Esophagus | ESCC | Coronavirus disease - COVID-19 | 156/4205 | 232/8465 | 3.18e-08 | 2.68e-07 | 1.37e-07 | 156 |
| hsa05171310 | Esophagus | ESCC | Coronavirus disease - COVID-19 | 156/4205 | 232/8465 | 3.18e-08 | 2.68e-07 | 1.37e-07 | 156 |
| hsa0517122 | Liver | Cirrhotic | Coronavirus disease - COVID-19 | 136/2530 | 232/8465 | 3.28e-20 | 1.82e-18 | 1.12e-18 | 136 |
| hsa046102 | Liver | Cirrhotic | Complement and coagulation cascades | 48/2530 | 86/8465 | 4.41e-07 | 5.44e-06 | 3.35e-06 | 48 |
| hsa0517132 | Liver | Cirrhotic | Coronavirus disease - COVID-19 | 136/2530 | 232/8465 | 3.28e-20 | 1.82e-18 | 1.12e-18 | 136 |
| hsa046103 | Liver | Cirrhotic | Complement and coagulation cascades | 48/2530 | 86/8465 | 4.41e-07 | 5.44e-06 | 3.35e-06 | 48 |
| hsa0517142 | Liver | HCC | Coronavirus disease - COVID-19 | 167/4020 | 232/8465 | 1.50e-14 | 4.19e-13 | 2.33e-13 | 167 |
| hsa046104 | Liver | HCC | Complement and coagulation cascades | 57/4020 | 86/8465 | 3.19e-04 | 1.45e-03 | 8.04e-04 | 57 |
| hsa0517152 | Liver | HCC | Coronavirus disease - COVID-19 | 167/4020 | 232/8465 | 1.50e-14 | 4.19e-13 | 2.33e-13 | 167 |
| hsa046105 | Liver | HCC | Complement and coagulation cascades | 57/4020 | 86/8465 | 3.19e-04 | 1.45e-03 | 8.04e-04 | 57 |
| hsa0517116 | Lung | IAC | Coronavirus disease - COVID-19 | 102/1053 | 232/8465 | 5.89e-34 | 1.91e-31 | 1.27e-31 | 102 |
| hsa0517117 | Lung | IAC | Coronavirus disease - COVID-19 | 102/1053 | 232/8465 | 5.89e-34 | 1.91e-31 | 1.27e-31 | 102 |
| hsa0517123 | Lung | AIS | Coronavirus disease - COVID-19 | 98/961 | 232/8465 | 2.82e-34 | 9.14e-32 | 5.85e-32 | 98 |
| hsa0517133 | Lung | AIS | Coronavirus disease - COVID-19 | 98/961 | 232/8465 | 2.82e-34 | 9.14e-32 | 5.85e-32 | 98 |
| hsa0517163 | Lung | MIAC | Coronavirus disease - COVID-19 | 79/507 | 232/8465 | 4.83e-40 | 7.02e-38 | 5.08e-38 | 79 |
| hsa0517173 | Lung | MIAC | Coronavirus disease - COVID-19 | 79/507 | 232/8465 | 4.83e-40 | 7.02e-38 | 5.08e-38 | 79 |
| Page: 1 2 |
Top |
Cell-cell communication analysis |
| Identification of potential cell-cell interactions between two cell types and their ligand-receptor pairs for different disease states |
| Ligand | Receptor | LRpair | Pathway | Tissue | Disease Stage |
| Page: 1 |
Top |
Single-cell gene regulatory network inference analysis |
| Find out the significant the regulons (TFs) and the target genes of each regulon across cell types for different disease states |
| TF | Cell Type | Tissue | Disease Stage | Target Gene | RSS | Regulon Activity |
| ∗The dot plots of a searched regulon are shown for all cell subpopulations in each disease state of each tissue based on the regulon specific score inferred using pySCENIC and by calculating the average expression. |
| Page: 1 |
Top |
Somatic mutation of malignant transformation related genes |
| Annotation of somatic variants for genes involved in malignant transformation |
| Hugo Symbol | Variant Class | Variant Classification | dbSNP RS | HGVSc | HGVSp | HGVSp Short | SWISSPROT | BIOTYPE | SIFT | PolyPhen | Tumor Sample Barcode | Tissue | Histology | Sex | Age | Stage | Therapy Types | Drugs | Outcome |
| CFB | SNV | Missense_Mutation | rs534739758 | c.957A>T | p.Lys319Asn | p.K319N | P00751 | protein_coding | tolerated(0.18) | benign(0.034) | TCGA-A2-A3XV-01 | Breast | breast invasive carcinoma | Female | <65 | I/II | Chemotherapy | carboplatin | CR |
| CFB | SNV | Missense_Mutation | novel | c.871N>G | p.Lys291Glu | p.K291E | P00751 | protein_coding | tolerated(1) | benign(0) | TCGA-A8-A085-01 | Breast | breast invasive carcinoma | Male | <65 | I/II | Hormone Therapy | tamoxiphen | SD |
| CFB | deletion | Frame_Shift_Del | c.706_722delNNNNNNNNNNNNNNNNN | p.Ser236HisfsTer7 | p.S236Hfs*7 | P00751 | protein_coding | TCGA-A2-A04T-01 | Breast | breast invasive carcinoma | Female | <65 | I/II | Chemotherapy | cyclophosphamide | SD | |||
| CFB | insertion | In_Frame_Ins | novel | c.872_873insGACGGG | p.Lys291_Cys292insThrGly | p.K291_C292insTG | P00751 | protein_coding | TCGA-A8-A085-01 | Breast | breast invasive carcinoma | Male | <65 | I/II | Hormone Therapy | tamoxiphen | SD | ||
| CFB | SNV | Missense_Mutation | c.1887N>C | p.Lys629Asn | p.K629N | P00751 | protein_coding | tolerated(0.15) | benign(0.119) | TCGA-FU-A3HZ-01 | Cervix | cervical & endocervical cancer | Female | <65 | I/II | Chemotherapy | cisplatin | CR | |
| CFB | SNV | Missense_Mutation | novel | c.1204A>T | p.Ile402Phe | p.I402F | P00751 | protein_coding | deleterious(0) | probably_damaging(0.974) | TCGA-A6-5665-01 | Colorectum | colon adenocarcinoma | Female | >=65 | I/II | Unknown | Unknown | PD |
| CFB | SNV | Missense_Mutation | c.1052N>T | p.Ser351Leu | p.S351L | P00751 | protein_coding | deleterious(0.01) | benign(0.058) | TCGA-AA-3867-01 | Colorectum | colon adenocarcinoma | Male | >=65 | III/IV | Unknown | Unknown | PD | |
| CFB | SNV | Missense_Mutation | c.248N>A | p.Ser83Asn | p.S83N | P00751 | protein_coding | deleterious(0.04) | probably_damaging(0.968) | TCGA-AA-A010-01 | Colorectum | colon adenocarcinoma | Female | <65 | I/II | Chemotherapy | folinic | CR | |
| CFB | SNV | Missense_Mutation | c.169N>A | p.Ala57Thr | p.A57T | P00751 | protein_coding | tolerated(0.37) | benign(0.037) | TCGA-G4-6309-01 | Colorectum | colon adenocarcinoma | Female | <65 | III/IV | Chemotherapy | xeloda | PD | |
| CFB | SNV | Missense_Mutation | novel | c.273N>T | p.Lys91Asn | p.K91N | P00751 | protein_coding | tolerated(0.11) | benign(0.006) | TCGA-AG-A002-01 | Colorectum | rectum adenocarcinoma | Male | <65 | I/II | Unknown | Unknown | SD |
| Page: 1 2 3 4 5 6 |
Top |
Related drugs of malignant transformation related genes |
| Identification of chemicals and drugs interact with genes involved in malignant transfromation |
| (DGIdb 4.0) |
| Entrez ID | Symbol | Category | Interaction Types | Drug Claim Name | Drug Name | PMIDs |
| 629 | CFB | DRUGGABLE GENOME, PROTEASE, ENZYME | inhibitor | 252166853 | ||
| 629 | CFB | DRUGGABLE GENOME, PROTEASE, ENZYME | inhibitor | 404859157 |
| Page: 1 |

Copyright 2023-Present -The University of Texas Health Science Center at Houston |