
|
|||||
|
 | |
| |
| |
| |
| |
| |
|
Gene: CFAP43 |
Gene summary for CFAP43 |
| Gene information | Species | Human | Gene symbol | CFAP43 | Gene ID | 80217 |
| Gene name | cilia and flagella associated protein 43 | |
| Gene Alias | C10orf79 | |
| Cytomap | 10q25.1 | |
| Gene Type | protein-coding | GO ID | GO:0000003 | UniProtAcc | Q8NDM7 |
Top |
Malignant transformation analysis |
| Identification of the aberrant gene expression in precancerous and cancerous lesions by comparing the gene expression of stem-like cells in diseased tissues with normal stem cells |
| Entrez ID | Symbol | Replicates | Species | Organ | Tissue | Adj P-value | Log2FC | Malignancy |
| 80217 | CFAP43 | RNA-P6T1-P6T1-1 | Human | Lung | MIAC | 3.00e-03 | 7.11e-01 | -0.0238 |
| 80217 | CFAP43 | RNA-P6T1-P6T1-2 | Human | Lung | MIAC | 4.12e-03 | 6.71e-01 | -0.0186 |
| 80217 | CFAP43 | RNA-P6T1-P6T1-4 | Human | Lung | MIAC | 2.24e-04 | 6.83e-01 | -0.0263 |
| 80217 | CFAP43 | RNA-P6T2-P6T2-2 | Human | Lung | IAC | 3.12e-03 | 1.78e-01 | -0.0132 |
| 80217 | CFAP43 | RNA-P6T2-P6T2-3 | Human | Lung | IAC | 3.91e-04 | 1.97e-01 | -0.013 |
| Page: 1 |
| Tissue | Expression Dynamics | Abbreviation |
| Lung | 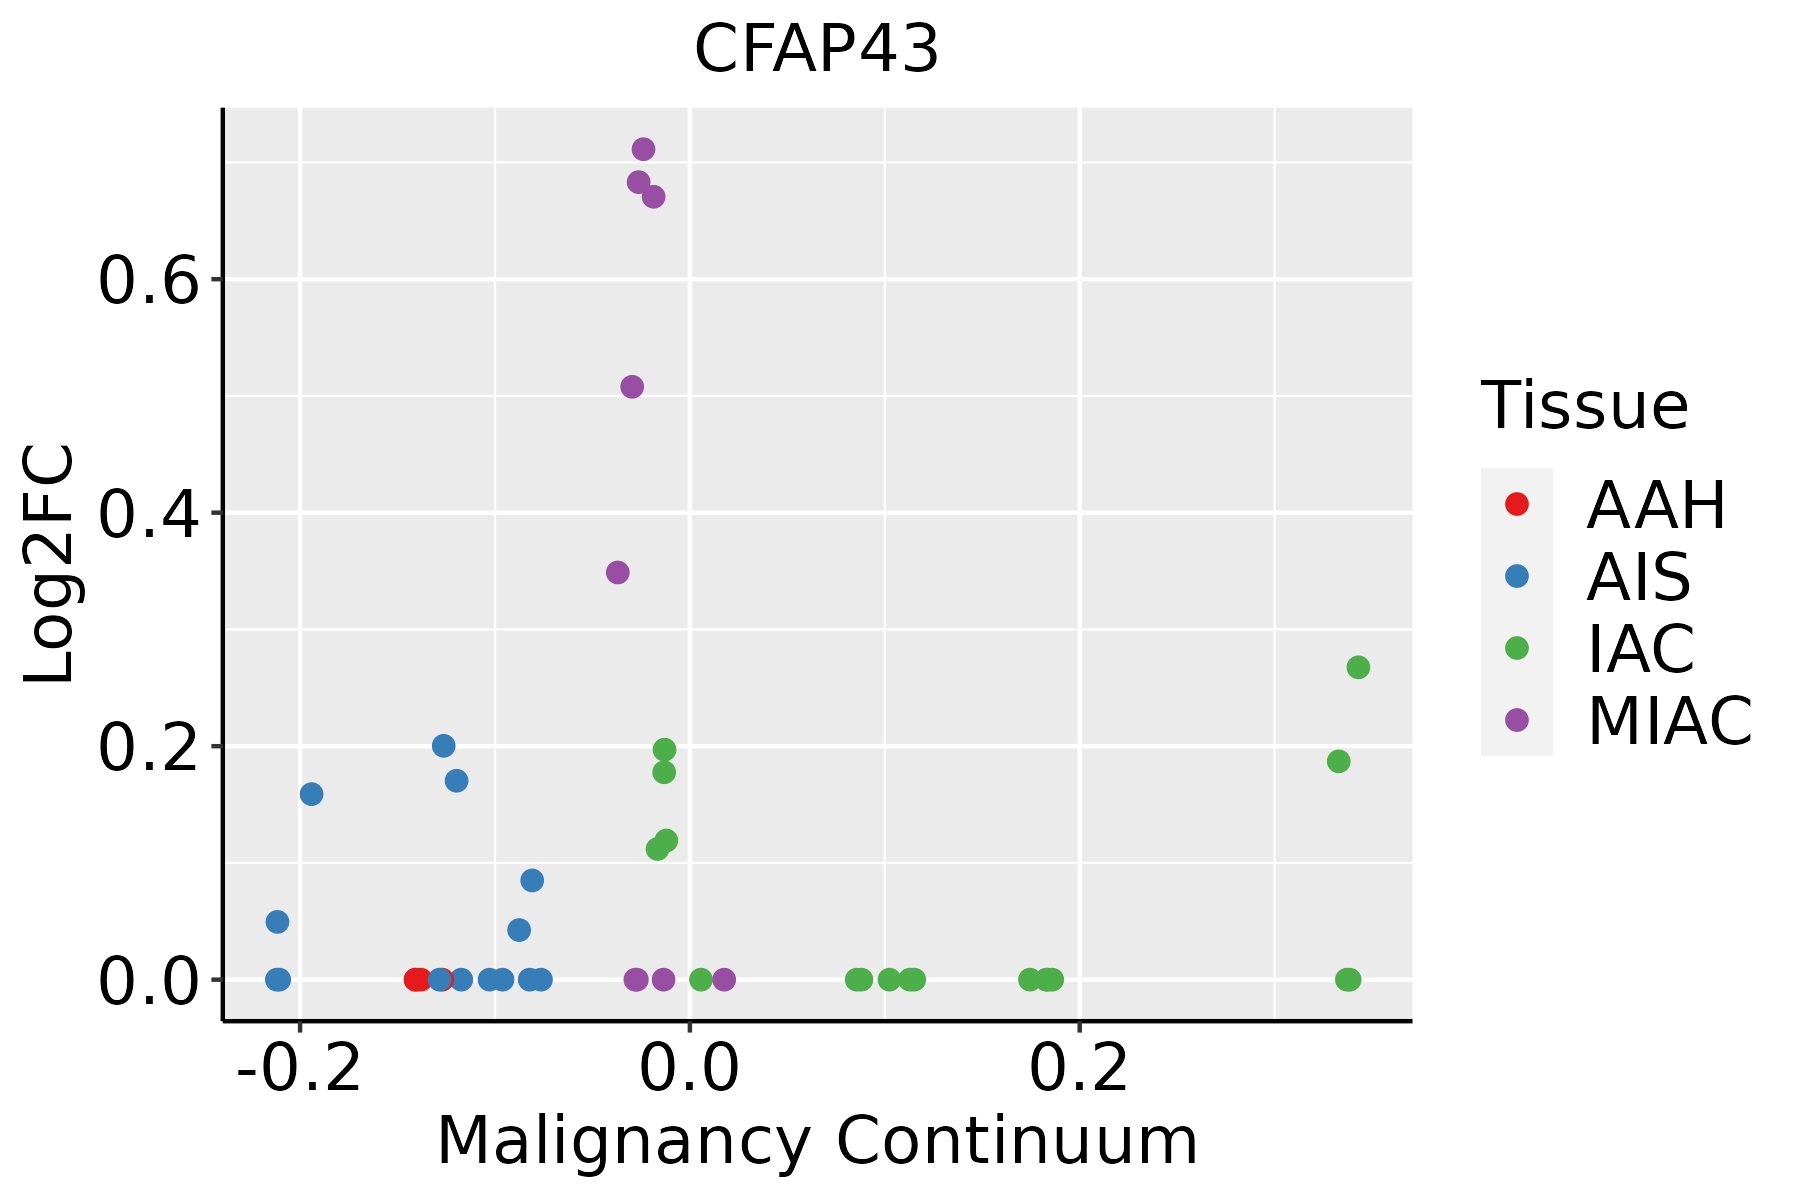 | AAH: Atypical adenomatous hyperplasia |
| AIS: Adenocarcinoma in situ | ||
| IAC: Invasive lung adenocarcinoma | ||
| MIA: Minimally invasive adenocarcinoma |
| ∗log2FC in expression of this searched gene in stem-like cells from each diseased tissue sample relative to stem-like cells in normal samples in each tissue plotted against the malignancy continuum. Samples are colored based on if they are from different disease stage. |
Top |
Malignant transformation related pathway analysis |
| Find out the enriched GO biological processes and KEGG pathways involved in transition from healthy to precancer to cancer |
| Tissue | Disease Stage | Enriched GO biological Processes |
| Colorectum | AD |  |
| Colorectum | SER |  |
| Colorectum | MSS |  |
| Colorectum | MSI-H |  |
| Colorectum | FAP |  |
| ∗Top 15 enriched GO BP terms are showed in the bar plot of each disease state in each tissue. Each row represents a significant GO biological process which is colored according to the -log10(p.adjust). |
| Page: 1 2 3 4 5 6 7 8 9 |
| GO ID | Tissue | Disease Stage | Description | Gene Ratio | Bg Ratio | pvalue | p.adjust | Count |
| GO:0007585 | Lung | IAC | respiratory gaseous exchange by respiratory system | 18/2061 | 68/18723 | 2.99e-04 | 4.82e-03 | 18 |
| GO:0099111 | Lung | IAC | microtubule-based transport | 35/2061 | 190/18723 | 1.55e-03 | 1.64e-02 | 35 |
| GO:0060271 | Lung | IAC | cilium assembly | 55/2061 | 337/18723 | 1.84e-03 | 1.88e-02 | 55 |
| GO:0044782 | Lung | IAC | cilium organization | 58/2061 | 368/18723 | 3.15e-03 | 2.75e-02 | 58 |
| GO:00602711 | Lung | MIAC | cilium assembly | 37/967 | 337/18723 | 1.29e-05 | 9.85e-04 | 37 |
| GO:00447821 | Lung | MIAC | cilium organization | 38/967 | 368/18723 | 3.93e-05 | 2.08e-03 | 38 |
| GO:00075853 | Lung | MIAC | respiratory gaseous exchange by respiratory system | 11/967 | 68/18723 | 6.76e-04 | 1.59e-02 | 11 |
| GO:00328861 | Lung | MIAC | regulation of microtubule-based process | 23/967 | 240/18723 | 3.27e-03 | 4.31e-02 | 23 |
| Page: 1 |
| Pathway ID | Tissue | Disease Stage | Description | Gene Ratio | Bg Ratio | pvalue | p.adjust | qvalue | Count |
| Page: 1 |
Top |
Cell-cell communication analysis |
| Identification of potential cell-cell interactions between two cell types and their ligand-receptor pairs for different disease states |
| Ligand | Receptor | LRpair | Pathway | Tissue | Disease Stage |
| Page: 1 |
Top |
Single-cell gene regulatory network inference analysis |
| Find out the significant the regulons (TFs) and the target genes of each regulon across cell types for different disease states |
| TF | Cell Type | Tissue | Disease Stage | Target Gene | RSS | Regulon Activity |
| ∗The dot plots of a searched regulon are shown for all cell subpopulations in each disease state of each tissue based on the regulon specific score inferred using pySCENIC and by calculating the average expression. |
| Page: 1 |
Top |
Somatic mutation of malignant transformation related genes |
| Annotation of somatic variants for genes involved in malignant transformation |
| Hugo Symbol | Variant Class | Variant Classification | dbSNP RS | HGVSc | HGVSp | HGVSp Short | SWISSPROT | BIOTYPE | SIFT | PolyPhen | Tumor Sample Barcode | Tissue | Histology | Sex | Age | Stage | Therapy Types | Drugs | Outcome |
| CFAP43 | SNV | Missense_Mutation | rs141476006 | c.2212N>A | p.Ala738Thr | p.A738T | Q8NDM7 | protein_coding | tolerated(0.82) | benign(0) | TCGA-A2-A0YT-01 | Breast | breast invasive carcinoma | Female | <65 | III/IV | Hormone Therapy | arimidex | SD |
| CFAP43 | SNV | Missense_Mutation | c.2999N>G | p.His1000Arg | p.H1000R | Q8NDM7 | protein_coding | deleterious(0.01) | possibly_damaging(0.85) | TCGA-A8-A09Z-01 | Breast | breast invasive carcinoma | Female | >=65 | I/II | Unknown | Unknown | SD | |
| CFAP43 | SNV | Missense_Mutation | rs755555277 | c.3929N>C | p.Phe1310Ser | p.F1310S | Q8NDM7 | protein_coding | deleterious(0) | probably_damaging(0.992) | TCGA-AN-A046-01 | Breast | breast invasive carcinoma | Female | >=65 | I/II | Unknown | Unknown | SD |
| CFAP43 | SNV | Missense_Mutation | novel | c.3692N>A | p.Ser1231Tyr | p.S1231Y | Q8NDM7 | protein_coding | deleterious(0) | probably_damaging(0.991) | TCGA-AN-A046-01 | Breast | breast invasive carcinoma | Female | >=65 | I/II | Unknown | Unknown | SD |
| CFAP43 | SNV | Missense_Mutation | rs770126385 | c.3866N>A | p.Arg1289His | p.R1289H | Q8NDM7 | protein_coding | tolerated(0.07) | possibly_damaging(0.562) | TCGA-AN-A0XN-01 | Breast | breast invasive carcinoma | Female | >=65 | III/IV | Unknown | Unknown | SD |
| CFAP43 | SNV | Missense_Mutation | c.1327T>A | p.Ser443Thr | p.S443T | Q8NDM7 | protein_coding | tolerated(0.21) | benign(0.046) | TCGA-AR-A0TY-01 | Breast | breast invasive carcinoma | Female | <65 | I/II | Unspecific | Paclitaxel | PD | |
| CFAP43 | SNV | Missense_Mutation | c.1643N>T | p.Arg548Ile | p.R548I | Q8NDM7 | protein_coding | tolerated(0.06) | benign(0.108) | TCGA-AR-A255-01 | Breast | breast invasive carcinoma | Female | <65 | I/II | Targeted Molecular therapy | trastuzumab | SD | |
| CFAP43 | SNV | Missense_Mutation | rs781153112 | c.3272N>T | p.Pro1091Leu | p.P1091L | Q8NDM7 | protein_coding | tolerated(0.06) | possibly_damaging(0.543) | TCGA-BH-A0EB-01 | Breast | breast invasive carcinoma | Female | >=65 | I/II | Hormone Therapy | arimidex | SD |
| CFAP43 | SNV | Missense_Mutation | novel | c.1817N>T | p.Cys606Phe | p.C606F | Q8NDM7 | protein_coding | deleterious(0) | probably_damaging(0.956) | TCGA-BH-A0HA-01 | Breast | breast invasive carcinoma | Female | <65 | I/II | Unknown | Unknown | SD |
| CFAP43 | SNV | Missense_Mutation | novel | c.4020G>C | p.Leu1340Phe | p.L1340F | Q8NDM7 | protein_coding | tolerated(0.22) | possibly_damaging(0.571) | TCGA-LL-A73Y-01 | Breast | breast invasive carcinoma | Female | >=65 | I/II | Chemotherapy | taxotere | SD |
| Page: 1 2 3 4 5 6 7 8 9 10 11 12 13 14 15 16 17 18 19 |
Top |
Related drugs of malignant transformation related genes |
| Identification of chemicals and drugs interact with genes involved in malignant transfromation |
| (DGIdb 4.0) |
| Entrez ID | Symbol | Category | Interaction Types | Drug Claim Name | Drug Name | PMIDs |
| Page: 1 |

Copyright 2023-Present -The University of Texas Health Science Center at Houston |