
|
|||||
|
 | |
| |
| |
| |
| |
| |
|
Gene: CFAP36 |
Gene summary for CFAP36 |
| Gene information | Species | Human | Gene symbol | CFAP36 | Gene ID | 112942 |
| Gene name | cilia and flagella associated protein 36 | |
| Gene Alias | BARTL1 | |
| Cytomap | 2p16.1 | |
| Gene Type | protein-coding | GO ID | GO:0008150 | UniProtAcc | Q96G28 |
Top |
Malignant transformation analysis |
| Identification of the aberrant gene expression in precancerous and cancerous lesions by comparing the gene expression of stem-like cells in diseased tissues with normal stem cells |
| Entrez ID | Symbol | Replicates | Species | Organ | Tissue | Adj P-value | Log2FC | Malignancy |
| 112942 | CFAP36 | LZE4T | Human | Esophagus | ESCC | 2.53e-08 | 3.74e-01 | 0.0811 |
| 112942 | CFAP36 | LZE5T | Human | Esophagus | ESCC | 9.10e-08 | 2.06e-01 | 0.0514 |
| 112942 | CFAP36 | LZE7T | Human | Esophagus | ESCC | 1.30e-02 | 3.79e-01 | 0.0667 |
| 112942 | CFAP36 | LZE8T | Human | Esophagus | ESCC | 4.96e-07 | 8.71e-02 | 0.067 |
| 112942 | CFAP36 | LZE24T | Human | Esophagus | ESCC | 5.97e-10 | 3.99e-01 | 0.0596 |
| 112942 | CFAP36 | P1T-E | Human | Esophagus | ESCC | 2.89e-08 | 3.22e-01 | 0.0875 |
| 112942 | CFAP36 | P2T-E | Human | Esophagus | ESCC | 1.34e-57 | 1.06e+00 | 0.1177 |
| 112942 | CFAP36 | P4T-E | Human | Esophagus | ESCC | 8.81e-31 | 8.01e-01 | 0.1323 |
| 112942 | CFAP36 | P5T-E | Human | Esophagus | ESCC | 1.09e-21 | 2.94e-01 | 0.1327 |
| 112942 | CFAP36 | P8T-E | Human | Esophagus | ESCC | 1.28e-15 | 3.09e-01 | 0.0889 |
| 112942 | CFAP36 | P9T-E | Human | Esophagus | ESCC | 1.65e-21 | 3.95e-01 | 0.1131 |
| 112942 | CFAP36 | P10T-E | Human | Esophagus | ESCC | 1.50e-23 | 5.14e-01 | 0.116 |
| 112942 | CFAP36 | P11T-E | Human | Esophagus | ESCC | 7.42e-18 | 5.70e-01 | 0.1426 |
| 112942 | CFAP36 | P12T-E | Human | Esophagus | ESCC | 5.08e-24 | 3.86e-01 | 0.1122 |
| 112942 | CFAP36 | P15T-E | Human | Esophagus | ESCC | 2.79e-17 | 4.39e-01 | 0.1149 |
| 112942 | CFAP36 | P16T-E | Human | Esophagus | ESCC | 1.43e-45 | 9.24e-01 | 0.1153 |
| 112942 | CFAP36 | P17T-E | Human | Esophagus | ESCC | 1.98e-08 | 3.39e-01 | 0.1278 |
| 112942 | CFAP36 | P19T-E | Human | Esophagus | ESCC | 2.23e-07 | 7.00e-01 | 0.1662 |
| 112942 | CFAP36 | P20T-E | Human | Esophagus | ESCC | 1.14e-22 | 4.51e-01 | 0.1124 |
| 112942 | CFAP36 | P21T-E | Human | Esophagus | ESCC | 3.32e-39 | 8.04e-01 | 0.1617 |
| Page: 1 2 3 4 5 6 |
| Tissue | Expression Dynamics | Abbreviation |
| Esophagus | 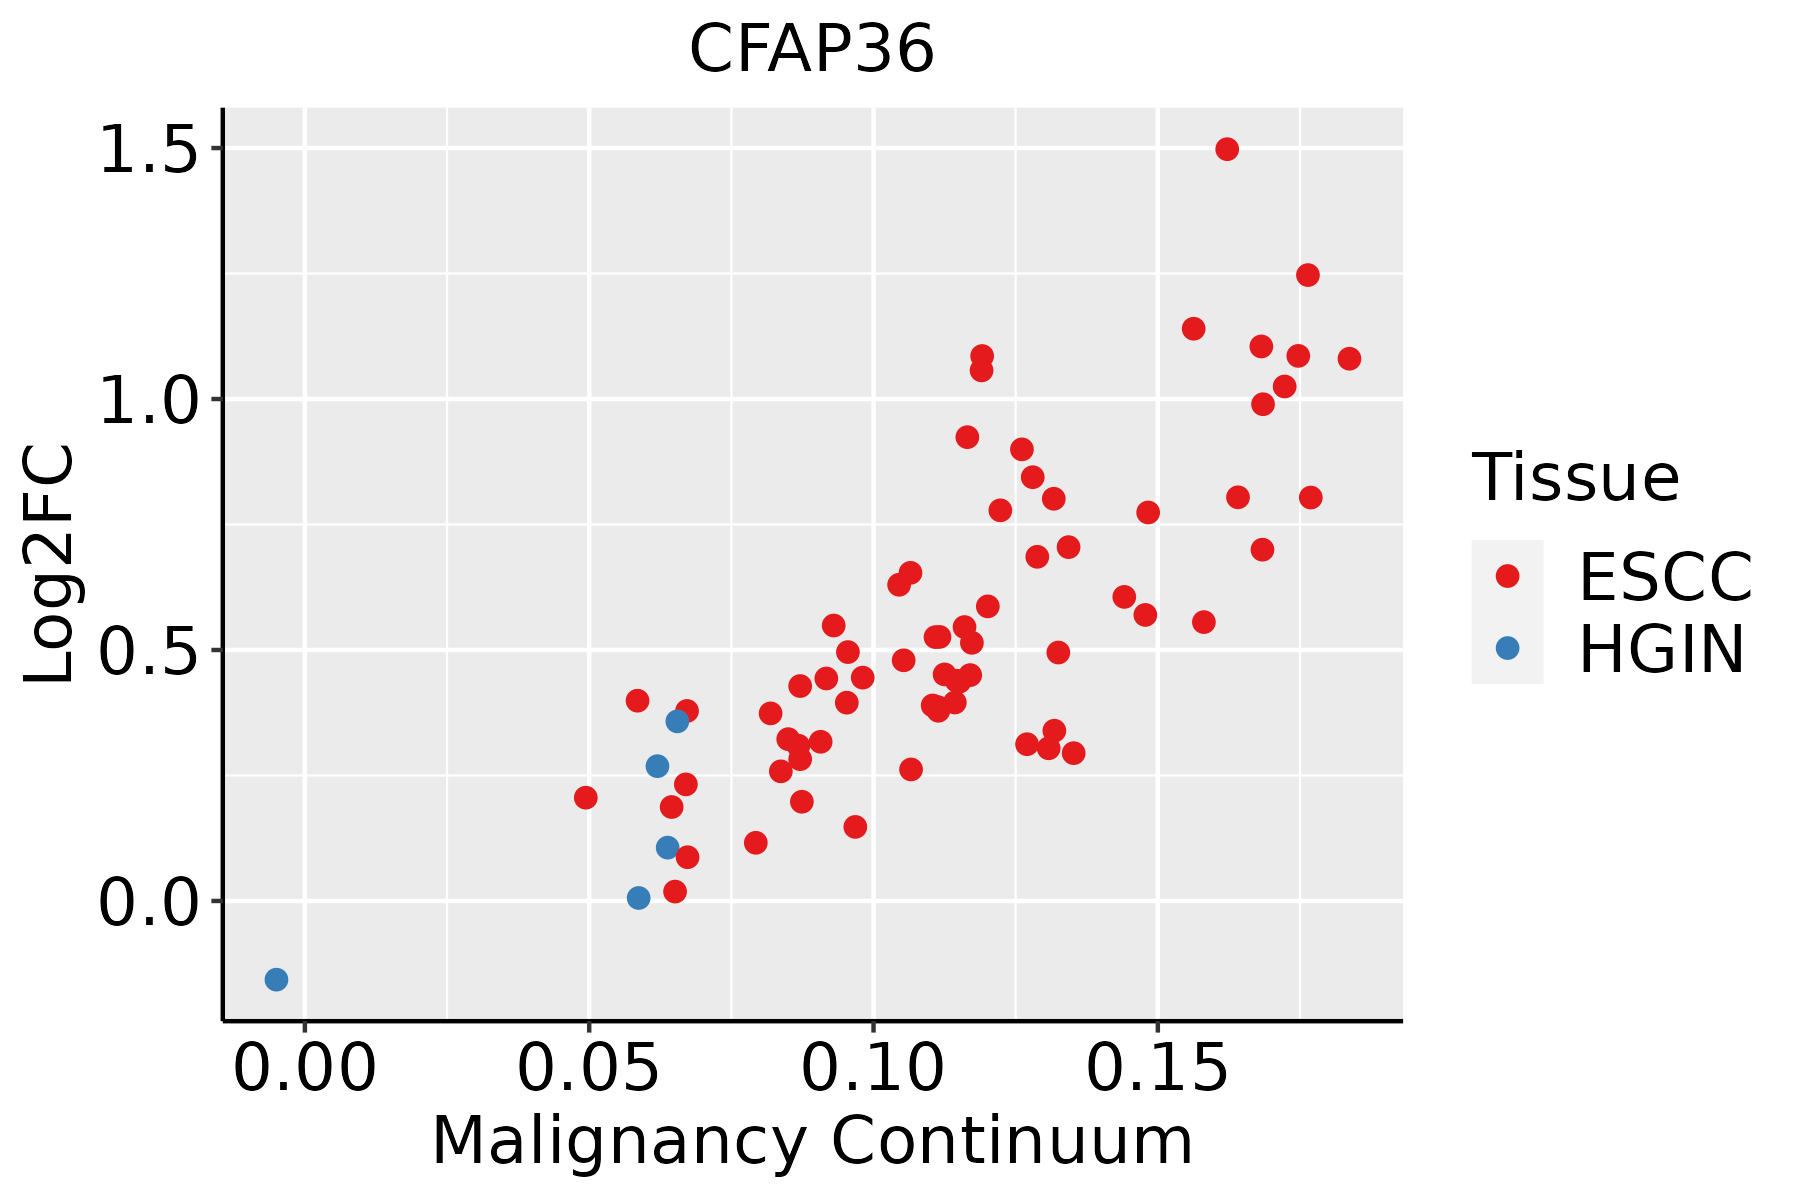 | ESCC: Esophageal squamous cell carcinoma |
| HGIN: High-grade intraepithelial neoplasias | ||
| LGIN: Low-grade intraepithelial neoplasias | ||
| Liver | 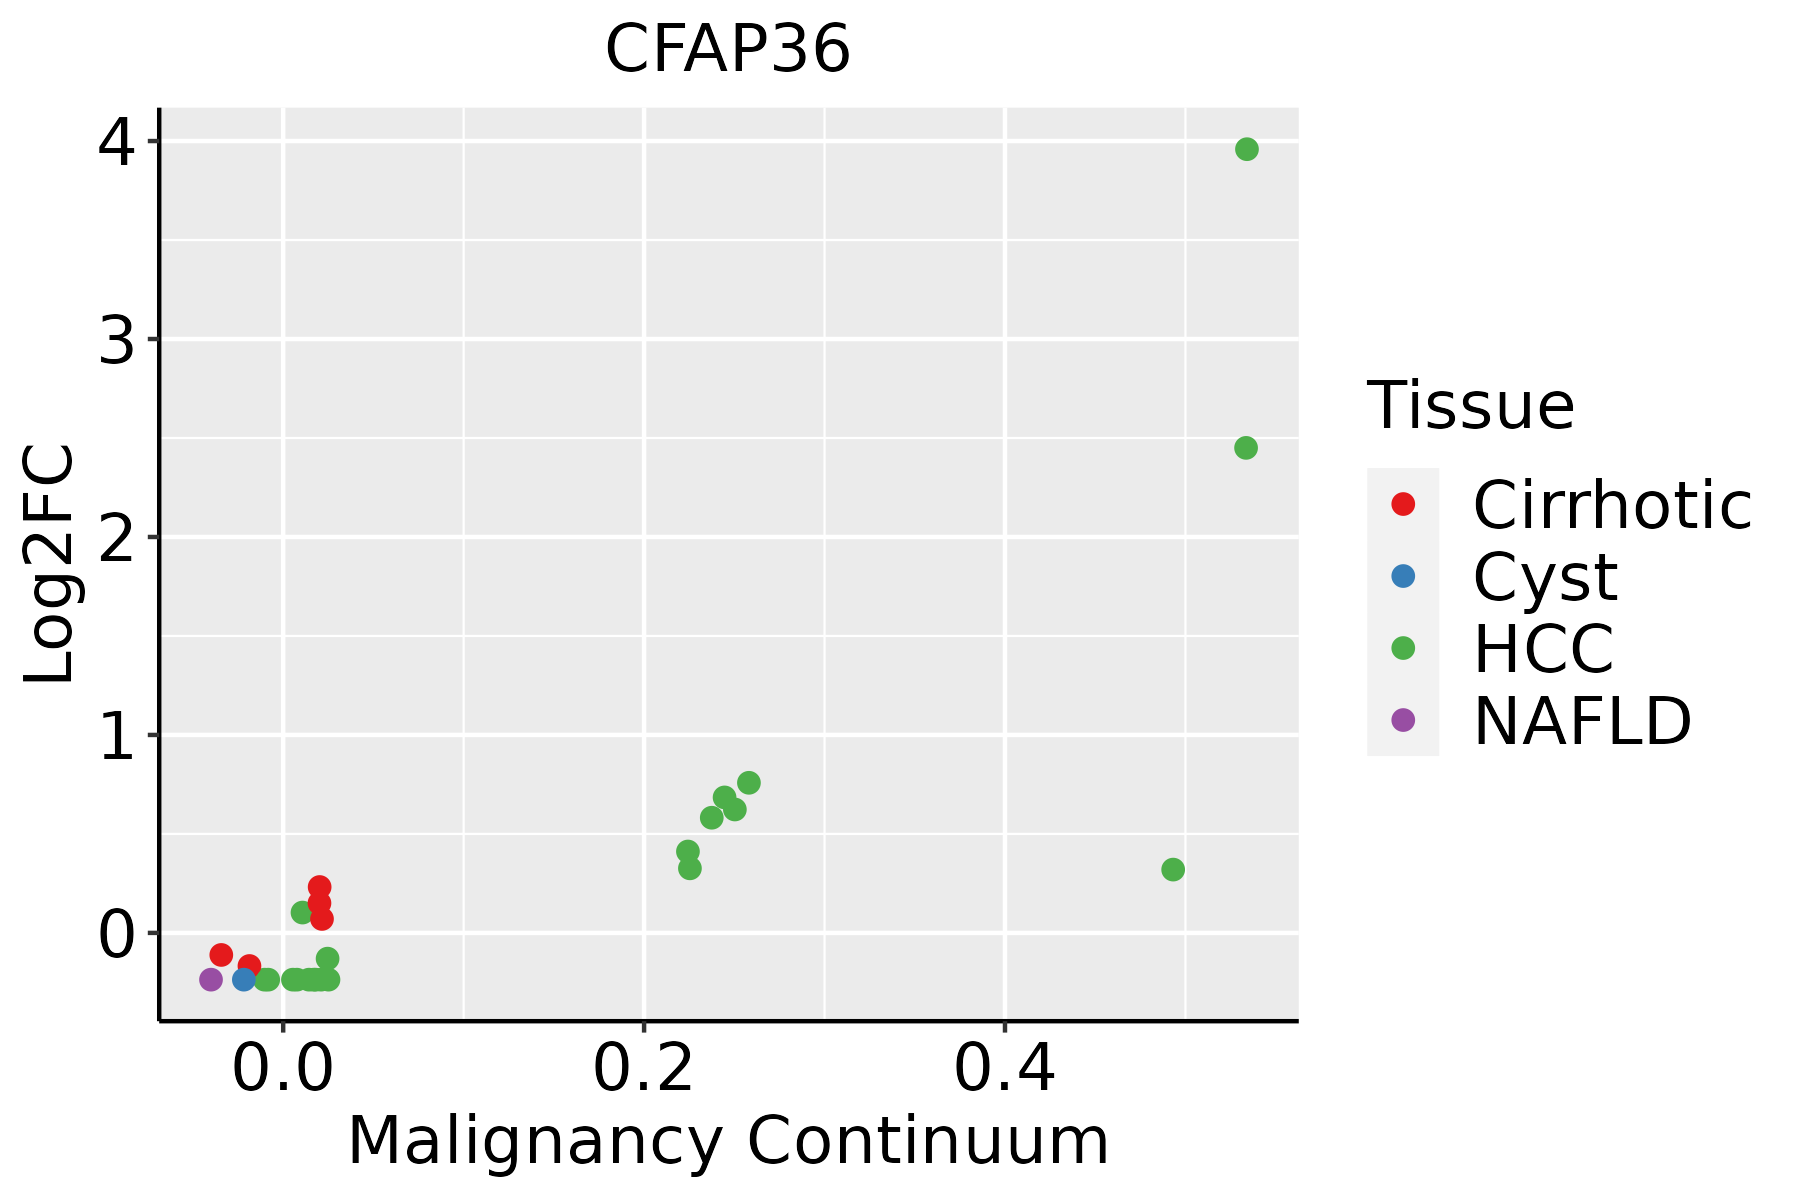 | HCC: Hepatocellular carcinoma |
| NAFLD: Non-alcoholic fatty liver disease | ||
| Oral Cavity |  | EOLP: Erosive Oral lichen planus |
| LP: leukoplakia | ||
| NEOLP: Non-erosive oral lichen planus | ||
| OSCC: Oral squamous cell carcinoma | ||
| Thyroid | 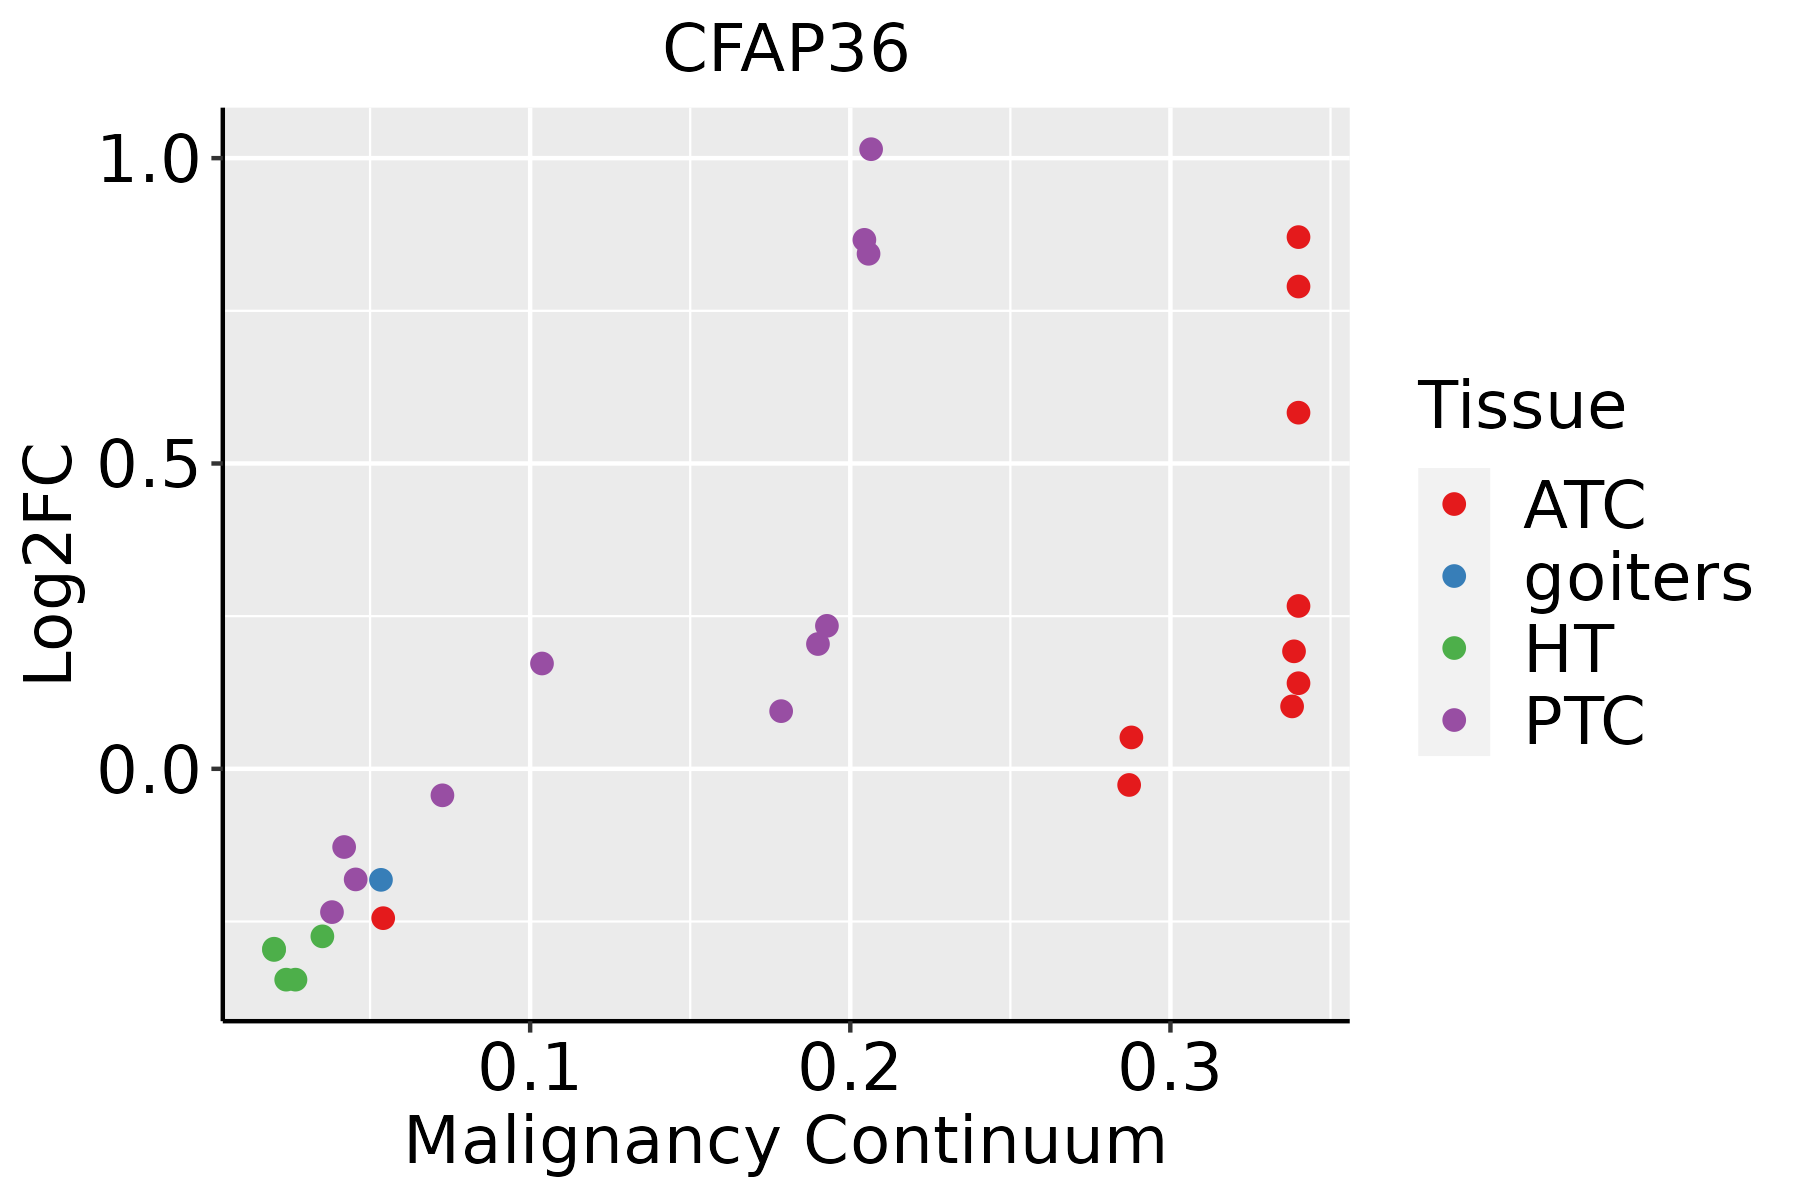 | ATC: Anaplastic thyroid cancer |
| HT: Hashimoto's thyroiditis | ||
| PTC: Papillary thyroid cancer |
| ∗log2FC in expression of this searched gene in stem-like cells from each diseased tissue sample relative to stem-like cells in normal samples in each tissue plotted against the malignancy continuum. Samples are colored based on if they are from different disease stage. |
Top |
Malignant transformation related pathway analysis |
| Find out the enriched GO biological processes and KEGG pathways involved in transition from healthy to precancer to cancer |
| Tissue | Disease Stage | Enriched GO biological Processes |
| Colorectum | AD |  |
| Colorectum | SER |  |
| Colorectum | MSS |  |
| Colorectum | MSI-H |  |
| Colorectum | FAP |  |
| ∗Top 15 enriched GO BP terms are showed in the bar plot of each disease state in each tissue. Each row represents a significant GO biological process which is colored according to the -log10(p.adjust). |
| Page: 1 2 3 4 5 6 7 8 9 |
| GO ID | Tissue | Disease Stage | Description | Gene Ratio | Bg Ratio | pvalue | p.adjust | Count |
| Page: 1 |
| Pathway ID | Tissue | Disease Stage | Description | Gene Ratio | Bg Ratio | pvalue | p.adjust | qvalue | Count |
| Page: 1 |
Top |
Cell-cell communication analysis |
| Identification of potential cell-cell interactions between two cell types and their ligand-receptor pairs for different disease states |
| Ligand | Receptor | LRpair | Pathway | Tissue | Disease Stage |
| Page: 1 |
Top |
Single-cell gene regulatory network inference analysis |
| Find out the significant the regulons (TFs) and the target genes of each regulon across cell types for different disease states |
| TF | Cell Type | Tissue | Disease Stage | Target Gene | RSS | Regulon Activity |
| ∗The dot plots of a searched regulon are shown for all cell subpopulations in each disease state of each tissue based on the regulon specific score inferred using pySCENIC and by calculating the average expression. |
| Page: 1 |
Top |
Somatic mutation of malignant transformation related genes |
| Annotation of somatic variants for genes involved in malignant transformation |
| Hugo Symbol | Variant Class | Variant Classification | dbSNP RS | HGVSc | HGVSp | HGVSp Short | SWISSPROT | BIOTYPE | SIFT | PolyPhen | Tumor Sample Barcode | Tissue | Histology | Sex | Age | Stage | Therapy Types | Drugs | Outcome |
| CFAP36 | SNV | Missense_Mutation | rs377625368 | c.745A>G | p.Ile249Val | p.I249V | Q96G28 | protein_coding | tolerated(1) | benign(0) | TCGA-A1-A0SO-01 | Breast | breast invasive carcinoma | Female | >=65 | I/II | Chemotherapy | SD | |
| CFAP36 | SNV | Missense_Mutation | c.617N>T | p.Ser206Leu | p.S206L | Q96G28 | protein_coding | tolerated(0.41) | benign(0.022) | TCGA-AC-A23H-01 | Breast | breast invasive carcinoma | Female | >=65 | I/II | Unknown | Unknown | PD | |
| CFAP36 | SNV | Missense_Mutation | novel | c.658N>A | p.Ala220Thr | p.A220T | Q96G28 | protein_coding | tolerated(0.21) | benign(0.003) | TCGA-CA-6717-01 | Colorectum | colon adenocarcinoma | Male | <65 | I/II | Chemotherapy | oxaliplatin | CR |
| CFAP36 | SNV | Missense_Mutation | c.674A>T | p.Asn225Ile | p.N225I | Q96G28 | protein_coding | tolerated(0.12) | benign(0.007) | TCGA-F4-6703-01 | Colorectum | colon adenocarcinoma | Male | <65 | I/II | Unknown | Unknown | SD | |
| CFAP36 | SNV | Missense_Mutation | rs763494988 | c.452N>A | p.Arg151Gln | p.R151Q | Q96G28 | protein_coding | tolerated(0.05) | possibly_damaging(0.446) | TCGA-AG-A002-01 | Colorectum | rectum adenocarcinoma | Male | <65 | I/II | Unknown | Unknown | SD |
| CFAP36 | SNV | Missense_Mutation | novel | c.671A>C | p.Asn224Thr | p.N224T | Q96G28 | protein_coding | tolerated(0.46) | benign(0) | TCGA-EI-6917-01 | Colorectum | rectum adenocarcinoma | Male | <65 | III/IV | Chemotherapy | 5fluorouracil+oxaciplatina+l-folinian | SD |
| CFAP36 | SNV | Missense_Mutation | rs763494988 | c.452N>A | p.Arg151Gln | p.R151Q | Q96G28 | protein_coding | tolerated(0.05) | possibly_damaging(0.446) | TCGA-F5-6814-01 | Colorectum | rectum adenocarcinoma | Male | <65 | I/II | Unknown | Unknown | SD |
| CFAP36 | SNV | Missense_Mutation | novel | c.734N>T | p.Ala245Val | p.A245V | Q96G28 | protein_coding | tolerated(0.13) | benign(0.049) | TCGA-A5-A0G1-01 | Endometrium | uterine corpus endometrioid carcinoma | Female | >=65 | I/II | Unknown | Unknown | SD |
| CFAP36 | SNV | Missense_Mutation | novel | c.500N>A | p.Gly167Asp | p.G167D | Q96G28 | protein_coding | deleterious(0) | probably_damaging(0.997) | TCGA-A5-A0G2-01 | Endometrium | uterine corpus endometrioid carcinoma | Female | <65 | III/IV | Unknown | Unknown | SD |
| CFAP36 | SNV | Missense_Mutation | c.862G>T | p.Val288Leu | p.V288L | Q96G28 | protein_coding | tolerated(0.25) | benign(0.014) | TCGA-A5-A1OF-01 | Endometrium | uterine corpus endometrioid carcinoma | Female | <65 | I/II | Unknown | Unknown | SD |
| Page: 1 2 3 4 5 |
Top |
Related drugs of malignant transformation related genes |
| Identification of chemicals and drugs interact with genes involved in malignant transfromation |
| (DGIdb 4.0) |
| Entrez ID | Symbol | Category | Interaction Types | Drug Claim Name | Drug Name | PMIDs |
| Page: 1 |

Copyright 2023-Present -The University of Texas Health Science Center at Houston |