
|
|||||
|
 | |
| |
| |
| |
| |
| |
|
Gene: CETN3 |
Gene summary for CETN3 |
| Gene information | Species | Human | Gene symbol | CETN3 | Gene ID | 1070 |
| Gene name | centrin 3 | |
| Gene Alias | CDC31 | |
| Cytomap | 5q14.3 | |
| Gene Type | protein-coding | GO ID | GO:0000226 | UniProtAcc | E5RJF8 |
Top |
Malignant transformation analysis |
| Identification of the aberrant gene expression in precancerous and cancerous lesions by comparing the gene expression of stem-like cells in diseased tissues with normal stem cells |
| Entrez ID | Symbol | Replicates | Species | Organ | Tissue | Adj P-value | Log2FC | Malignancy |
| 1070 | CETN3 | LZE4T | Human | Esophagus | ESCC | 8.29e-06 | 1.14e-01 | 0.0811 |
| 1070 | CETN3 | LZE8T | Human | Esophagus | ESCC | 2.50e-03 | 1.13e-01 | 0.067 |
| 1070 | CETN3 | LZE20T | Human | Esophagus | ESCC | 1.96e-03 | 6.57e-02 | 0.0662 |
| 1070 | CETN3 | LZE24T | Human | Esophagus | ESCC | 5.88e-11 | 2.50e-01 | 0.0596 |
| 1070 | CETN3 | LZE21T | Human | Esophagus | ESCC | 1.25e-04 | 2.01e-01 | 0.0655 |
| 1070 | CETN3 | LZE6T | Human | Esophagus | ESCC | 4.03e-03 | 1.37e-01 | 0.0845 |
| 1070 | CETN3 | P1T-E | Human | Esophagus | ESCC | 5.55e-04 | 1.05e-01 | 0.0875 |
| 1070 | CETN3 | P2T-E | Human | Esophagus | ESCC | 1.31e-16 | 3.40e-01 | 0.1177 |
| 1070 | CETN3 | P4T-E | Human | Esophagus | ESCC | 4.09e-23 | 3.82e-01 | 0.1323 |
| 1070 | CETN3 | P5T-E | Human | Esophagus | ESCC | 8.01e-13 | 1.05e-01 | 0.1327 |
| 1070 | CETN3 | P8T-E | Human | Esophagus | ESCC | 2.02e-20 | 1.25e-01 | 0.0889 |
| 1070 | CETN3 | P9T-E | Human | Esophagus | ESCC | 4.07e-11 | 7.04e-02 | 0.1131 |
| 1070 | CETN3 | P10T-E | Human | Esophagus | ESCC | 5.45e-18 | 1.55e-01 | 0.116 |
| 1070 | CETN3 | P11T-E | Human | Esophagus | ESCC | 9.86e-15 | 2.77e-01 | 0.1426 |
| 1070 | CETN3 | P12T-E | Human | Esophagus | ESCC | 2.38e-28 | 4.01e-01 | 0.1122 |
| 1070 | CETN3 | P15T-E | Human | Esophagus | ESCC | 1.49e-12 | 6.48e-02 | 0.1149 |
| 1070 | CETN3 | P16T-E | Human | Esophagus | ESCC | 1.98e-11 | 8.14e-02 | 0.1153 |
| 1070 | CETN3 | P17T-E | Human | Esophagus | ESCC | 4.14e-02 | 1.55e-01 | 0.1278 |
| 1070 | CETN3 | P20T-E | Human | Esophagus | ESCC | 2.13e-15 | 2.09e-01 | 0.1124 |
| 1070 | CETN3 | P21T-E | Human | Esophagus | ESCC | 1.07e-22 | 3.00e-01 | 0.1617 |
| Page: 1 2 3 4 |
| Tissue | Expression Dynamics | Abbreviation |
| Esophagus | 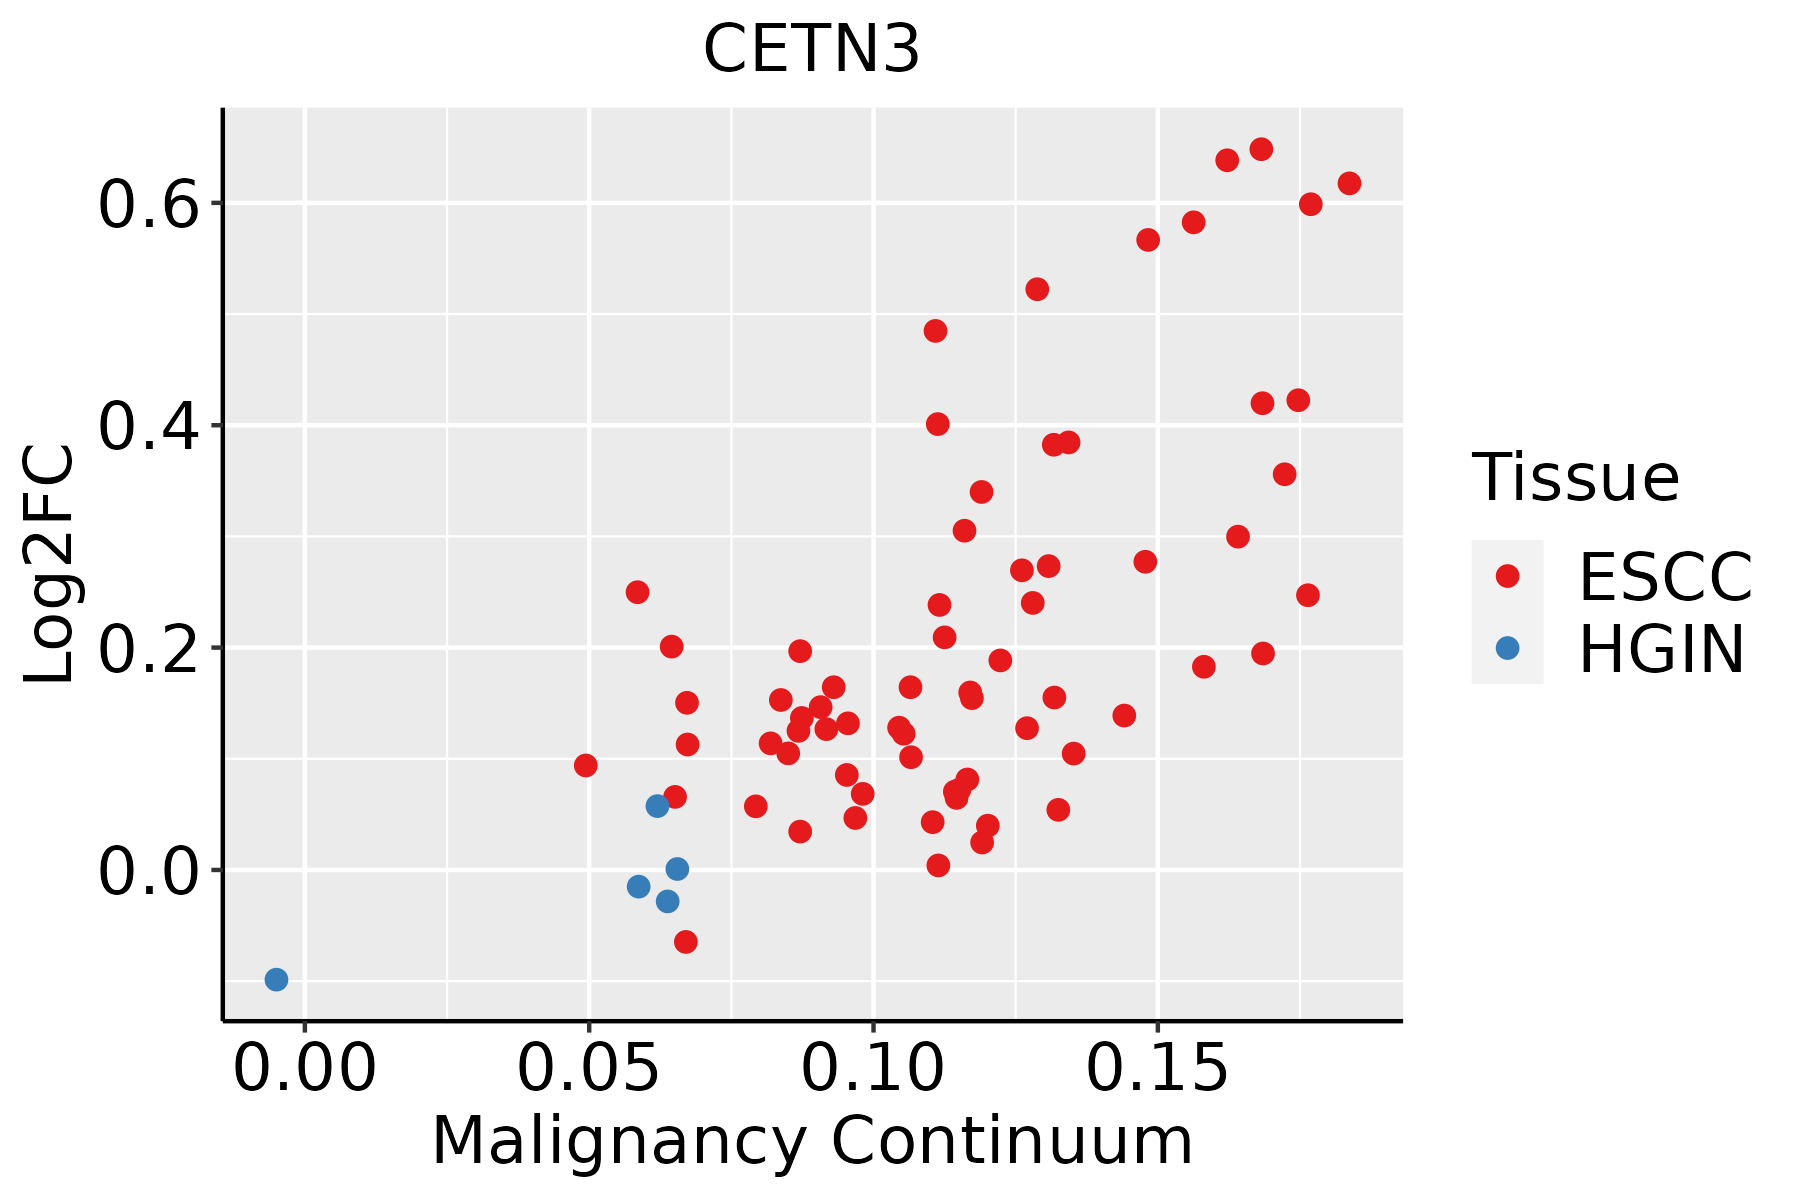 | ESCC: Esophageal squamous cell carcinoma |
| HGIN: High-grade intraepithelial neoplasias | ||
| LGIN: Low-grade intraepithelial neoplasias | ||
| Oral Cavity | 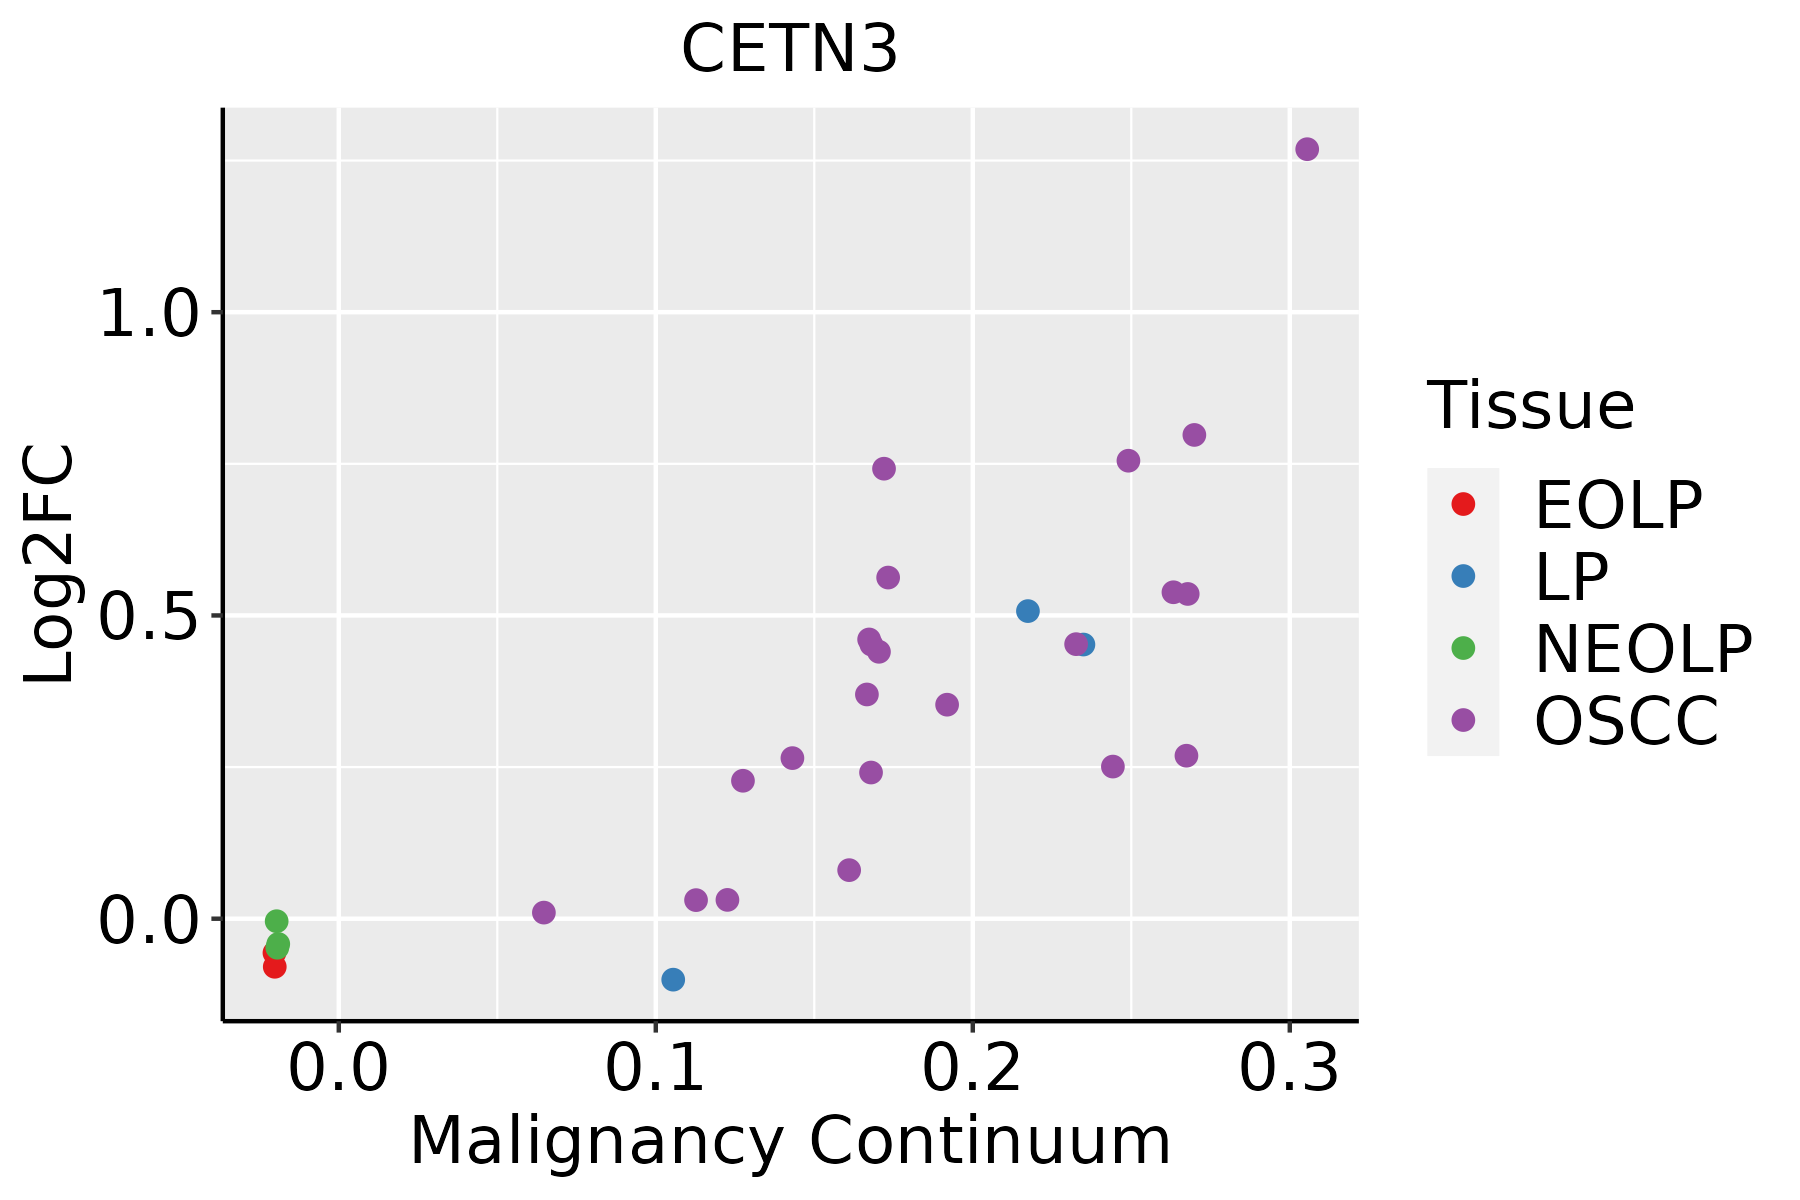 | EOLP: Erosive Oral lichen planus |
| LP: leukoplakia | ||
| NEOLP: Non-erosive oral lichen planus | ||
| OSCC: Oral squamous cell carcinoma | ||
| Skin | 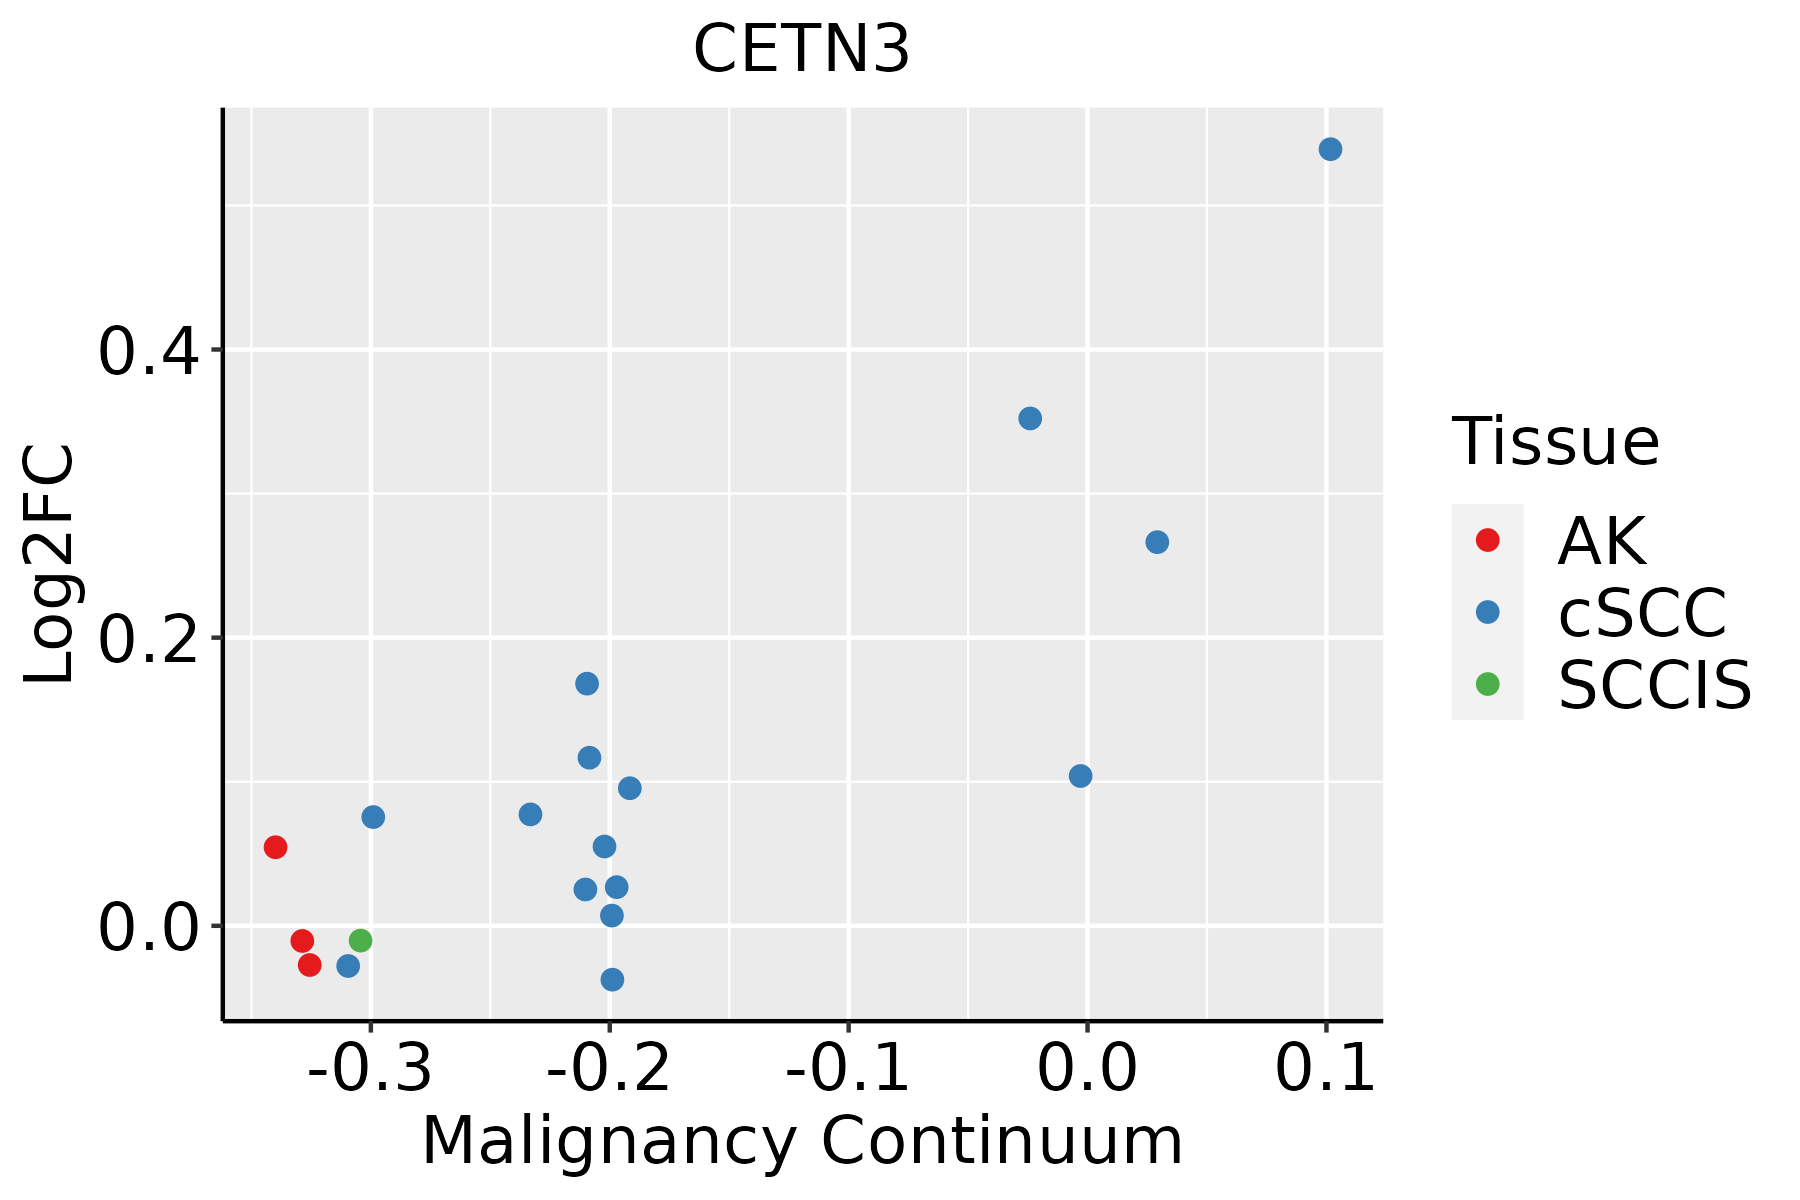 | AK: Actinic keratosis |
| cSCC: Cutaneous squamous cell carcinoma | ||
| SCCIS:squamous cell carcinoma in situ |
| ∗log2FC in expression of this searched gene in stem-like cells from each diseased tissue sample relative to stem-like cells in normal samples in each tissue plotted against the malignancy continuum. Samples are colored based on if they are from different disease stage. |
Top |
Malignant transformation related pathway analysis |
| Find out the enriched GO biological processes and KEGG pathways involved in transition from healthy to precancer to cancer |
| Tissue | Disease Stage | Enriched GO biological Processes |
| Colorectum | AD |  |
| Colorectum | SER |  |
| Colorectum | MSS |  |
| Colorectum | MSI-H |  |
| Colorectum | FAP |  |
| ∗Top 15 enriched GO BP terms are showed in the bar plot of each disease state in each tissue. Each row represents a significant GO biological process which is colored according to the -log10(p.adjust). |
| Page: 1 2 3 4 5 6 7 8 9 |
| GO ID | Tissue | Disease Stage | Description | Gene Ratio | Bg Ratio | pvalue | p.adjust | Count |
| GO:0006403110 | Esophagus | ESCC | RNA localization | 166/8552 | 201/18723 | 1.95e-27 | 6.18e-25 | 166 |
| GO:005123617 | Esophagus | ESCC | establishment of RNA localization | 134/8552 | 166/18723 | 1.23e-20 | 1.81e-18 | 134 |
| GO:005102815 | Esophagus | ESCC | mRNA transport | 110/8552 | 130/18723 | 2.76e-20 | 3.80e-18 | 110 |
| GO:005065717 | Esophagus | ESCC | nucleic acid transport | 131/8552 | 163/18723 | 6.94e-20 | 8.46e-18 | 131 |
| GO:005065817 | Esophagus | ESCC | RNA transport | 131/8552 | 163/18723 | 6.94e-20 | 8.46e-18 | 131 |
| GO:001593117 | Esophagus | ESCC | nucleobase-containing compound transport | 162/8552 | 222/18723 | 9.87e-17 | 7.93e-15 | 162 |
| GO:00070982 | Esophagus | ESCC | centrosome cycle | 85/8552 | 130/18723 | 4.41e-06 | 4.69e-05 | 85 |
| GO:00310233 | Esophagus | ESCC | microtubule organizing center organization | 92/8552 | 143/18723 | 5.04e-06 | 5.31e-05 | 92 |
| GO:000640318 | Oral cavity | OSCC | RNA localization | 150/7305 | 201/18723 | 6.90e-25 | 1.98e-22 | 150 |
| GO:00510287 | Oral cavity | OSCC | mRNA transport | 101/7305 | 130/18723 | 2.19e-19 | 3.15e-17 | 101 |
| GO:005065714 | Oral cavity | OSCC | nucleic acid transport | 120/7305 | 163/18723 | 2.31e-19 | 3.18e-17 | 120 |
| GO:005065814 | Oral cavity | OSCC | RNA transport | 120/7305 | 163/18723 | 2.31e-19 | 3.18e-17 | 120 |
| GO:005123614 | Oral cavity | OSCC | establishment of RNA localization | 121/7305 | 166/18723 | 6.38e-19 | 8.24e-17 | 121 |
| GO:001593114 | Oral cavity | OSCC | nucleobase-containing compound transport | 150/7305 | 222/18723 | 4.86e-18 | 5.04e-16 | 150 |
| GO:00070981 | Oral cavity | OSCC | centrosome cycle | 66/7305 | 130/18723 | 4.17e-03 | 1.70e-02 | 66 |
| GO:00310232 | Oral cavity | OSCC | microtubule organizing center organization | 70/7305 | 143/18723 | 9.71e-03 | 3.44e-02 | 70 |
| GO:0006403111 | Skin | cSCC | RNA localization | 120/4864 | 201/18723 | 4.17e-24 | 1.01e-21 | 120 |
| GO:005065719 | Skin | cSCC | nucleic acid transport | 92/4864 | 163/18723 | 1.35e-16 | 1.33e-14 | 92 |
| GO:005065819 | Skin | cSCC | RNA transport | 92/4864 | 163/18723 | 1.35e-16 | 1.33e-14 | 92 |
| GO:005123619 | Skin | cSCC | establishment of RNA localization | 93/4864 | 166/18723 | 1.78e-16 | 1.69e-14 | 93 |
| Page: 1 2 |
| Pathway ID | Tissue | Disease Stage | Description | Gene Ratio | Bg Ratio | pvalue | p.adjust | qvalue | Count |
| Page: 1 |
Top |
Cell-cell communication analysis |
| Identification of potential cell-cell interactions between two cell types and their ligand-receptor pairs for different disease states |
| Ligand | Receptor | LRpair | Pathway | Tissue | Disease Stage |
| Page: 1 |
Top |
Single-cell gene regulatory network inference analysis |
| Find out the significant the regulons (TFs) and the target genes of each regulon across cell types for different disease states |
| TF | Cell Type | Tissue | Disease Stage | Target Gene | RSS | Regulon Activity |
| ∗The dot plots of a searched regulon are shown for all cell subpopulations in each disease state of each tissue based on the regulon specific score inferred using pySCENIC and by calculating the average expression. |
| Page: 1 |
Top |
Somatic mutation of malignant transformation related genes |
| Annotation of somatic variants for genes involved in malignant transformation |
| Hugo Symbol | Variant Class | Variant Classification | dbSNP RS | HGVSc | HGVSp | HGVSp Short | SWISSPROT | BIOTYPE | SIFT | PolyPhen | Tumor Sample Barcode | Tissue | Histology | Sex | Age | Stage | Therapy Types | Drugs | Outcome |
| CETN3 | SNV | Missense_Mutation | novel | c.94N>T | p.Asp32Tyr | p.D32Y | protein_coding | deleterious(0) | possibly_damaging(0.861) | TCGA-CA-6717-01 | Colorectum | colon adenocarcinoma | Male | <65 | I/II | Chemotherapy | oxaliplatin | CR | |
| CETN3 | deletion | Frame_Shift_Del | c.189delA | p.Ala64LeufsTer4 | p.A64Lfs*4 | protein_coding | TCGA-A6-6781-01 | Colorectum | colon adenocarcinoma | Male | <65 | III/IV | Chemotherapy | oxaliplatin | SD | ||||
| CETN3 | deletion | Frame_Shift_Del | c.189delN | p.Ala64LeufsTer4 | p.A64Lfs*4 | protein_coding | TCGA-CM-6162-01 | Colorectum | colon adenocarcinoma | Female | <65 | III/IV | Chemotherapy | oxaliplatin | SD | ||||
| CETN3 | deletion | Frame_Shift_Del | c.189delN | p.Ala64LeufsTer4 | p.A64Lfs*4 | protein_coding | TCGA-CM-6171-01 | Colorectum | colon adenocarcinoma | Female | >=65 | I/II | Unknown | Unknown | SD | ||||
| CETN3 | insertion | Frame_Shift_Ins | rs763570929 | c.189dupA | p.Ala64SerfsTer2 | p.A64Sfs*2 | protein_coding | TCGA-G4-6586-01 | Colorectum | colon adenocarcinoma | Female | >=65 | I/II | Unknown | Unknown | SD | |||
| CETN3 | deletion | Frame_Shift_Del | c.189delA | p.Ala64LeufsTer4 | p.A64Lfs*4 | protein_coding | TCGA-G4-6628-01 | Colorectum | colon adenocarcinoma | Male | >=65 | I/II | Unknown | Unknown | SD | ||||
| CETN3 | deletion | Frame_Shift_Del | c.189delA | p.Ala64LeufsTer4 | p.A64Lfs*4 | protein_coding | TCGA-NH-A5IV-01 | Colorectum | colon adenocarcinoma | Female | >=65 | I/II | Unknown | Unknown | SD | ||||
| CETN3 | SNV | Missense_Mutation | c.373N>T | p.Arg125Cys | p.R125C | protein_coding | deleterious(0) | probably_damaging(0.978) | TCGA-AP-A059-01 | Endometrium | uterine corpus endometrioid carcinoma | Female | >=65 | I/II | Unknown | Unknown | SD | ||
| CETN3 | SNV | Missense_Mutation | rs372629434 | c.374N>A | p.Arg125His | p.R125H | protein_coding | deleterious(0) | probably_damaging(0.952) | TCGA-AX-A1CE-01 | Endometrium | uterine corpus endometrioid carcinoma | Female | <65 | I/II | Unspecific | Paclitaxel | SD | |
| CETN3 | SNV | Missense_Mutation | novel | c.253N>T | p.Asp85Tyr | p.D85Y | protein_coding | deleterious(0) | probably_damaging(0.999) | TCGA-EO-A22X-01 | Endometrium | uterine corpus endometrioid carcinoma | Female | <65 | III/IV | Unspecific | Carboplatin | Complete Response |
| Page: 1 2 3 |
Top |
Related drugs of malignant transformation related genes |
| Identification of chemicals and drugs interact with genes involved in malignant transfromation |
| (DGIdb 4.0) |
| Entrez ID | Symbol | Category | Interaction Types | Drug Claim Name | Drug Name | PMIDs |
| Page: 1 |

Copyright 2023-Present -The University of Texas Health Science Center at Houston |