
|
|||||
|
 | |
| |
| |
| |
| |
| |
|
Gene: CES2 |
Gene summary for CES2 |
| Gene information | Species | Human | Gene symbol | CES2 | Gene ID | 8824 |
| Gene name | carboxylesterase 2 | |
| Gene Alias | CE-2 | |
| Cytomap | 16q22.1 | |
| Gene Type | protein-coding | GO ID | GO:0006082 | UniProtAcc | A0A024R6X1 |
Top |
Malignant transformation analysis |
| Identification of the aberrant gene expression in precancerous and cancerous lesions by comparing the gene expression of stem-like cells in diseased tissues with normal stem cells |
| Entrez ID | Symbol | Replicates | Species | Organ | Tissue | Adj P-value | Log2FC | Malignancy |
| 8824 | CES2 | HTA11_2487_2000001011 | Human | Colorectum | SER | 2.53e-38 | 1.67e+00 | -0.1808 |
| 8824 | CES2 | HTA11_1938_2000001011 | Human | Colorectum | AD | 4.41e-09 | 7.89e-01 | -0.0811 |
| 8824 | CES2 | HTA11_78_2000001011 | Human | Colorectum | AD | 6.81e-17 | 1.48e+00 | -0.1088 |
| 8824 | CES2 | HTA11_347_2000001011 | Human | Colorectum | AD | 5.61e-85 | 2.80e+00 | -0.1954 |
| 8824 | CES2 | HTA11_411_2000001011 | Human | Colorectum | SER | 2.07e-17 | 2.63e+00 | -0.2602 |
| 8824 | CES2 | HTA11_2112_2000001011 | Human | Colorectum | SER | 2.05e-12 | 1.83e+00 | -0.2196 |
| 8824 | CES2 | HTA11_3361_2000001011 | Human | Colorectum | AD | 4.81e-11 | 1.16e+00 | -0.1207 |
| 8824 | CES2 | HTA11_83_2000001011 | Human | Colorectum | SER | 5.68e-35 | 2.16e+00 | -0.1526 |
| 8824 | CES2 | HTA11_696_2000001011 | Human | Colorectum | AD | 4.42e-40 | 1.92e+00 | -0.1464 |
| 8824 | CES2 | HTA11_866_2000001011 | Human | Colorectum | AD | 3.26e-28 | 1.37e+00 | -0.1001 |
| 8824 | CES2 | HTA11_1391_2000001011 | Human | Colorectum | AD | 2.00e-22 | 1.36e+00 | -0.059 |
| 8824 | CES2 | HTA11_2992_2000001011 | Human | Colorectum | SER | 3.06e-11 | 1.83e+00 | -0.1706 |
| 8824 | CES2 | HTA11_5212_2000001011 | Human | Colorectum | AD | 1.49e-25 | 2.19e+00 | -0.2061 |
| 8824 | CES2 | HTA11_5216_2000001011 | Human | Colorectum | SER | 6.83e-15 | 1.81e+00 | -0.1462 |
| 8824 | CES2 | HTA11_546_2000001011 | Human | Colorectum | AD | 1.58e-09 | 1.21e+00 | -0.0842 |
| 8824 | CES2 | HTA11_9341_2000001011 | Human | Colorectum | SER | 4.02e-07 | 1.15e+00 | -0.00410000000000005 |
| 8824 | CES2 | HTA11_7862_2000001011 | Human | Colorectum | AD | 1.62e-08 | 1.01e+00 | -0.0179 |
| 8824 | CES2 | HTA11_8622_2000001021 | Human | Colorectum | SER | 4.44e-05 | 8.02e-01 | 0.0528 |
| 8824 | CES2 | HTA11_10623_2000001011 | Human | Colorectum | AD | 1.44e-07 | 8.96e-01 | -0.0177 |
| 8824 | CES2 | HTA11_7469_2000001011 | Human | Colorectum | AD | 1.70e-04 | 1.05e+00 | -0.0124 |
| Page: 1 2 3 4 5 6 7 8 9 10 |
| Tissue | Expression Dynamics | Abbreviation |
| Colorectum (GSE201348) |  | FAP: Familial adenomatous polyposis |
| CRC: Colorectal cancer | ||
| Colorectum (HTA11) | 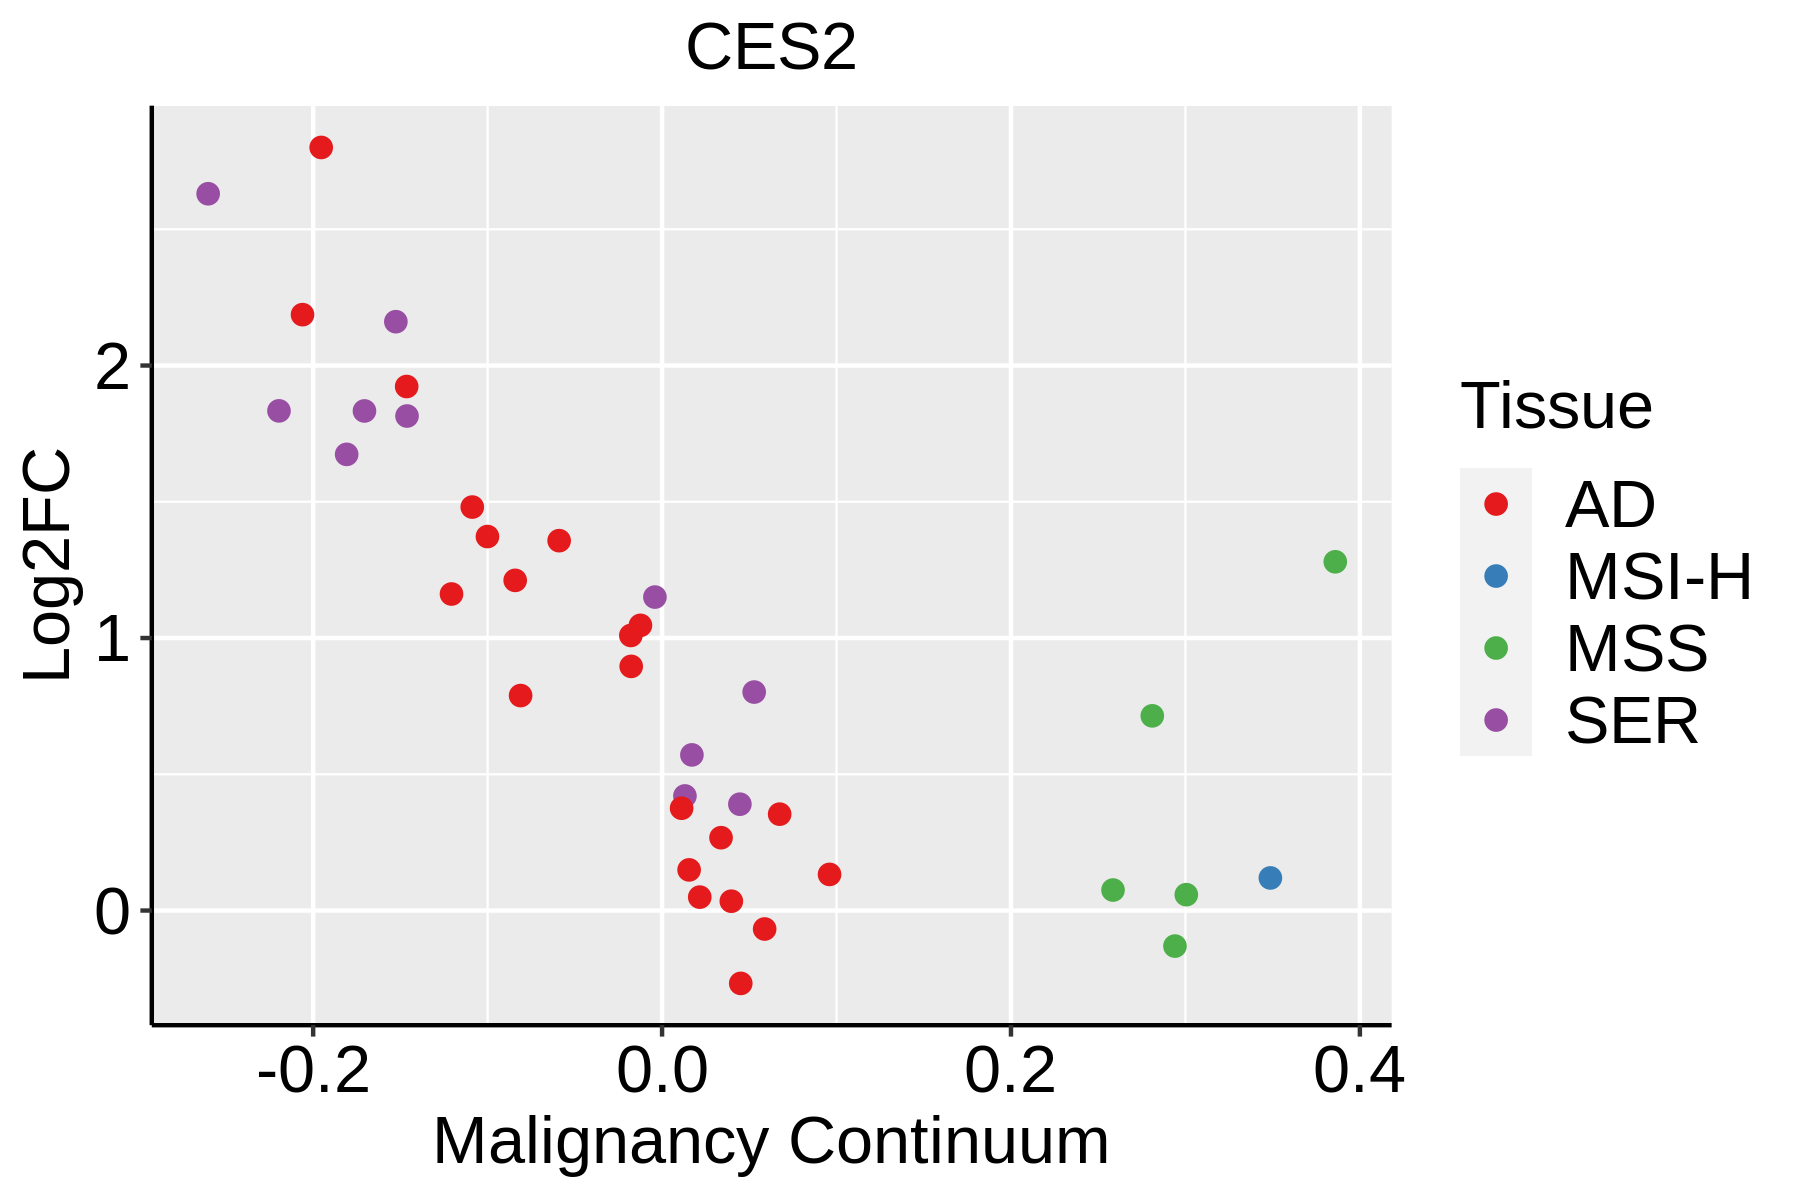 | AD: Adenomas |
| SER: Sessile serrated lesions | ||
| MSI-H: Microsatellite-high colorectal cancer | ||
| MSS: Microsatellite stable colorectal cancer | ||
| Esophagus |  | ESCC: Esophageal squamous cell carcinoma |
| HGIN: High-grade intraepithelial neoplasias | ||
| LGIN: Low-grade intraepithelial neoplasias | ||
| GC | 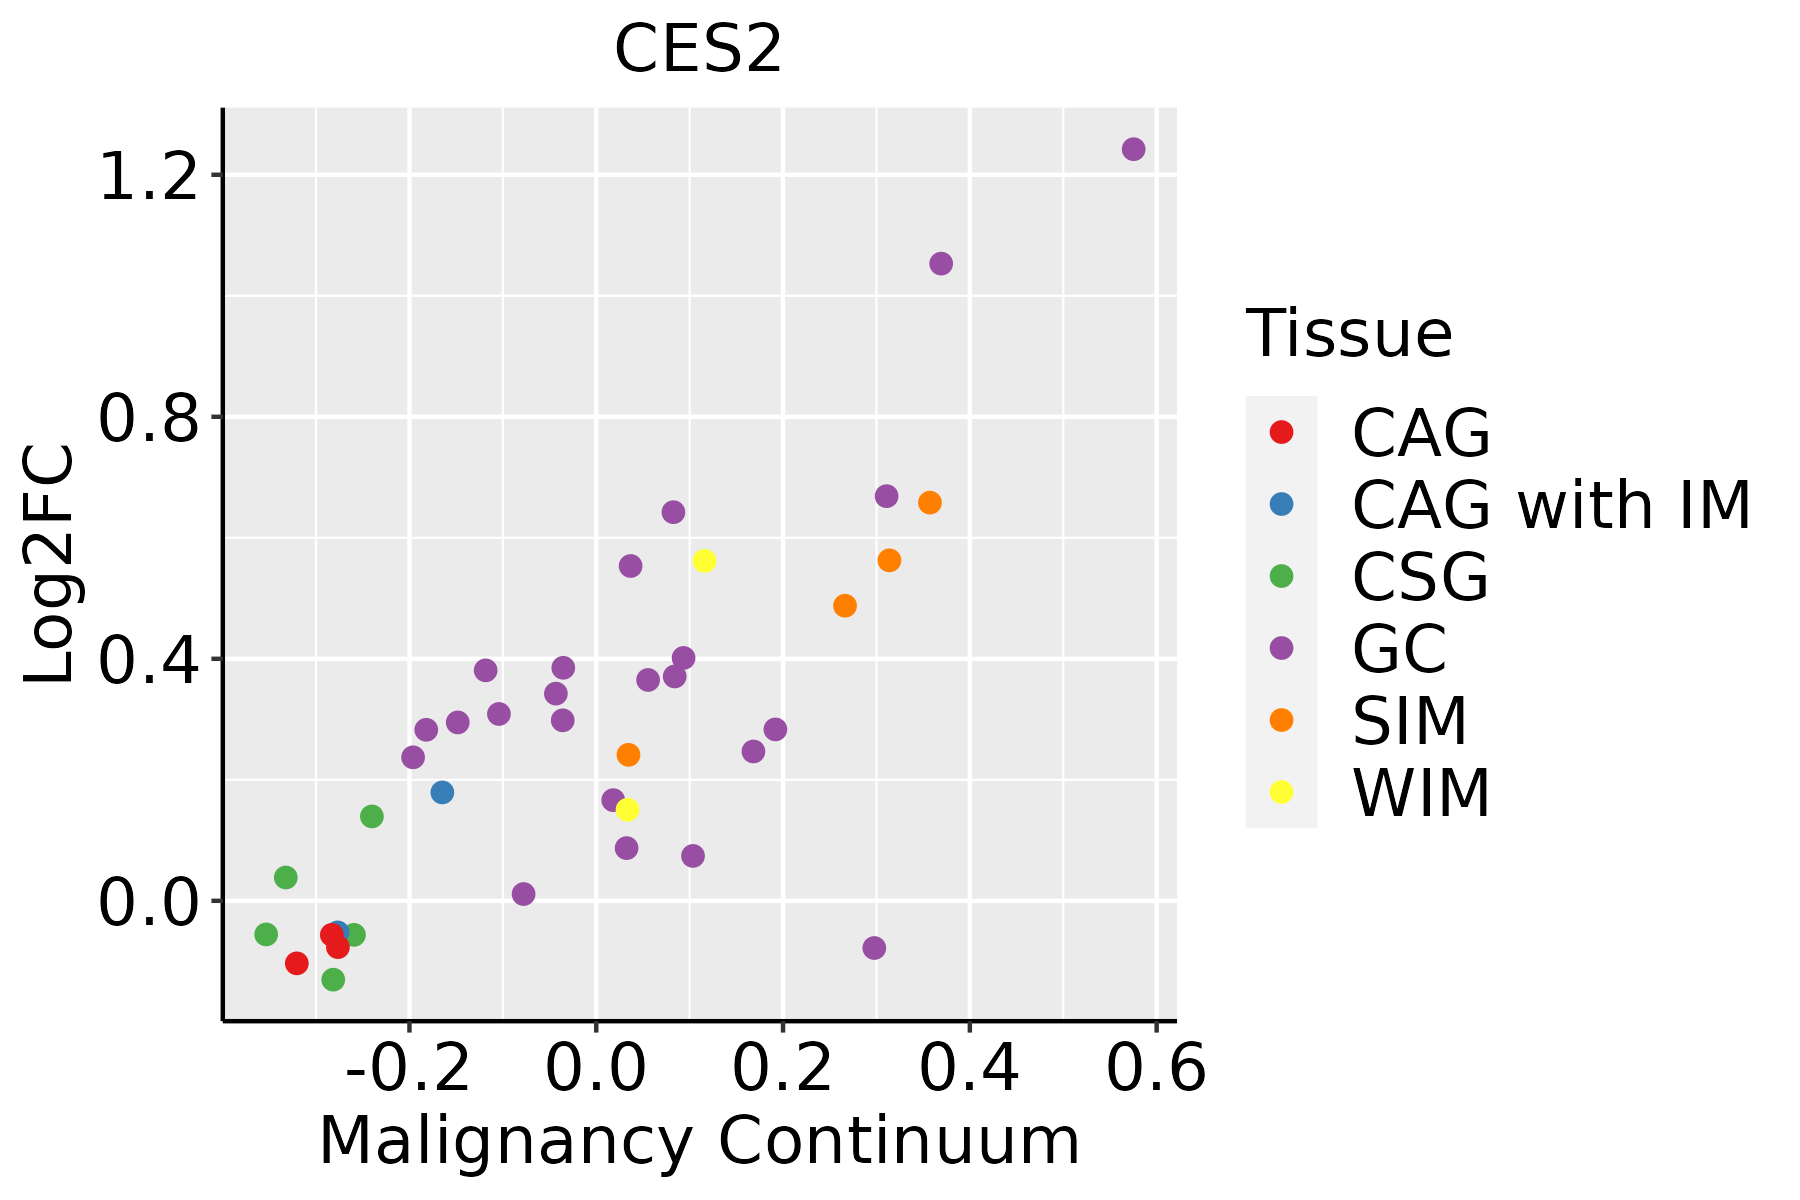 | CAG: Chronic atrophic gastritis |
| CAG with IM: Chronic atrophic gastritis with intestinal metaplasia | ||
| CSG: Chronic superficial gastritis | ||
| GC: Gastric cancer | ||
| SIM: Severe intestinal metaplasia | ||
| WIM: Wild intestinal metaplasia | ||
| Liver | 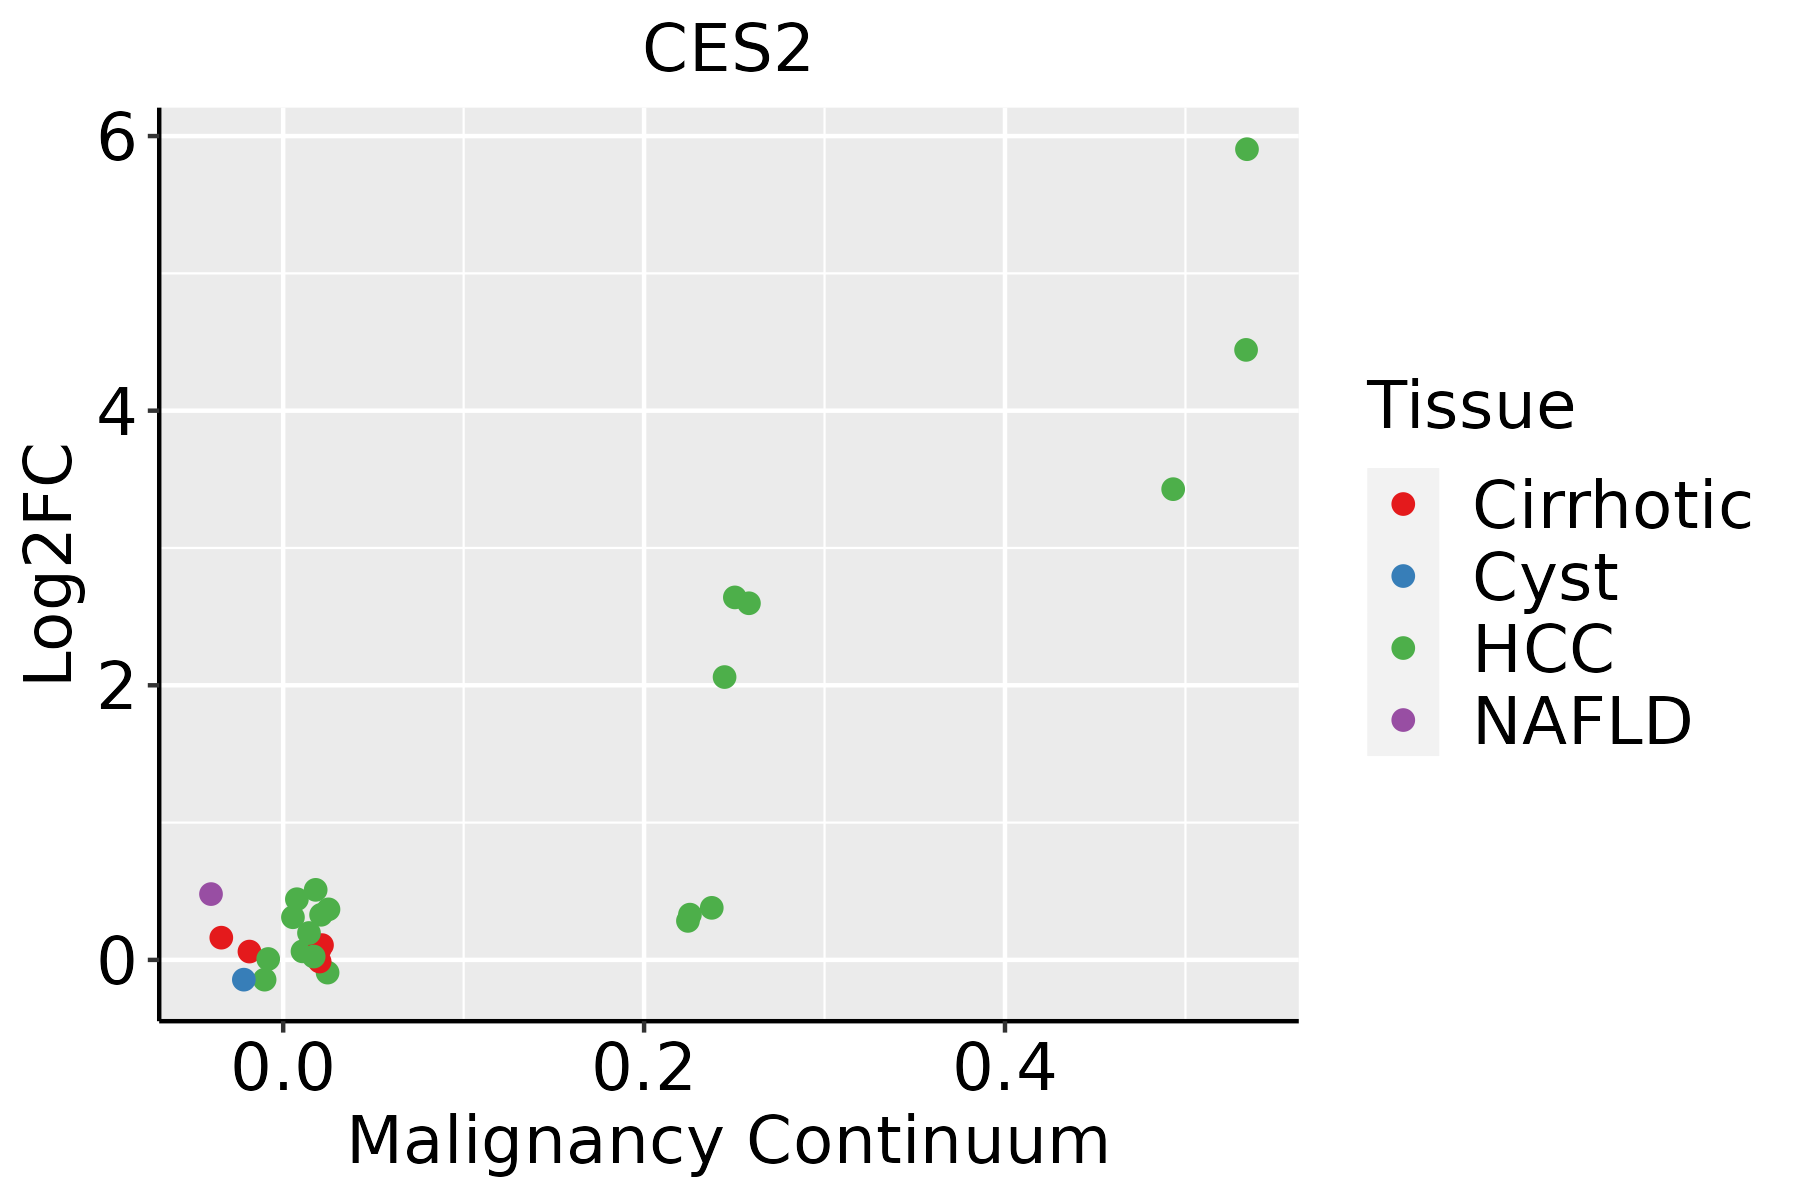 | HCC: Hepatocellular carcinoma |
| NAFLD: Non-alcoholic fatty liver disease | ||
| Oral Cavity |  | EOLP: Erosive Oral lichen planus |
| LP: leukoplakia | ||
| NEOLP: Non-erosive oral lichen planus | ||
| OSCC: Oral squamous cell carcinoma | ||
| Prostate | 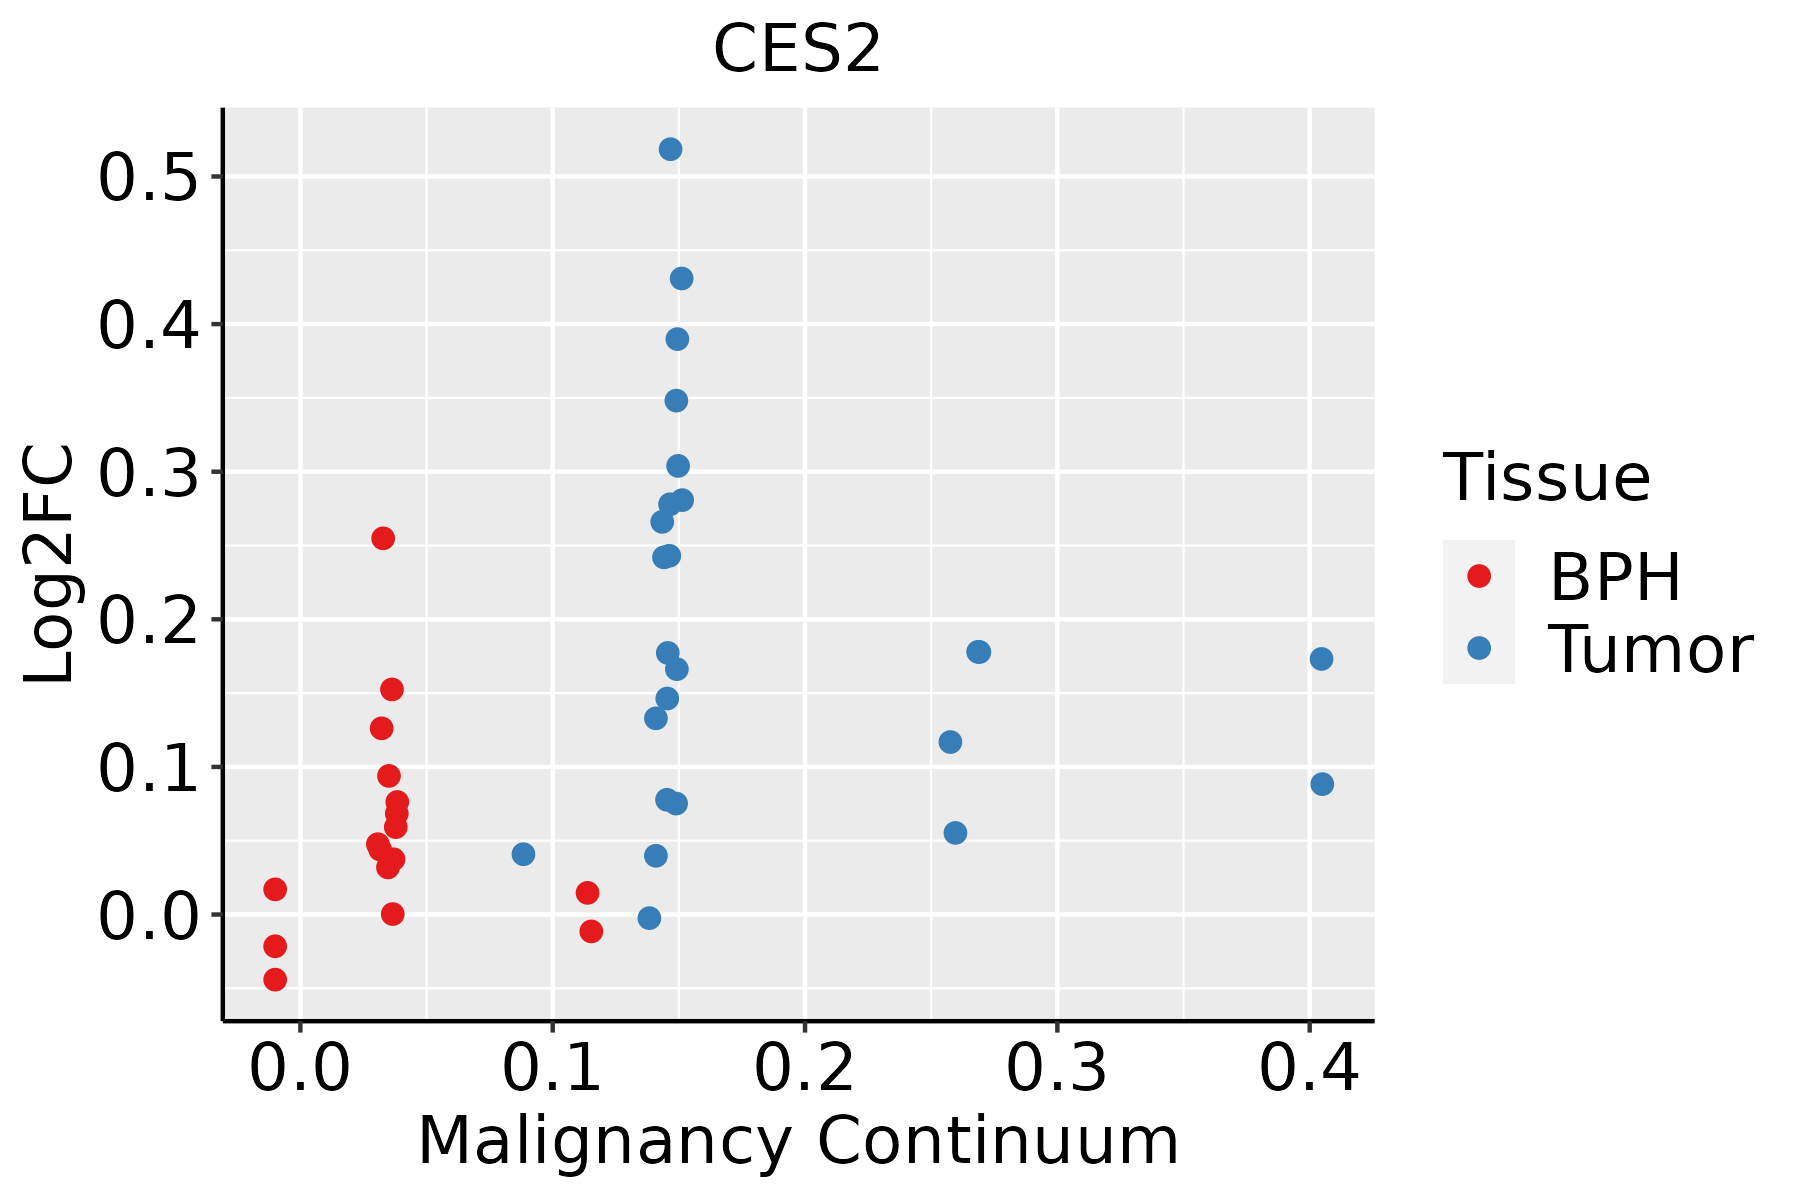 | BPH: Benign Prostatic Hyperplasia |
| Skin |  | AK: Actinic keratosis |
| cSCC: Cutaneous squamous cell carcinoma | ||
| SCCIS:squamous cell carcinoma in situ | ||
| Thyroid |  | ATC: Anaplastic thyroid cancer |
| HT: Hashimoto's thyroiditis | ||
| PTC: Papillary thyroid cancer |
| ∗log2FC in expression of this searched gene in stem-like cells from each diseased tissue sample relative to stem-like cells in normal samples in each tissue plotted against the malignancy continuum. Samples are colored based on if they are from different disease stage. |
Top |
Malignant transformation related pathway analysis |
| Find out the enriched GO biological processes and KEGG pathways involved in transition from healthy to precancer to cancer |
| Tissue | Disease Stage | Enriched GO biological Processes |
| Colorectum | AD |  |
| Colorectum | SER |  |
| Colorectum | MSS |  |
| Colorectum | MSI-H |  |
| Colorectum | FAP |  |
| ∗Top 15 enriched GO BP terms are showed in the bar plot of each disease state in each tissue. Each row represents a significant GO biological process which is colored according to the -log10(p.adjust). |
| Page: 1 2 3 4 5 6 7 8 9 |
| GO ID | Tissue | Disease Stage | Description | Gene Ratio | Bg Ratio | pvalue | p.adjust | Count |
| GO:0006631 | Colorectum | AD | fatty acid metabolic process | 114/3918 | 390/18723 | 5.58e-05 | 9.44e-04 | 114 |
| GO:00066311 | Colorectum | SER | fatty acid metabolic process | 79/2897 | 390/18723 | 6.34e-03 | 4.56e-02 | 79 |
| GO:00066312 | Colorectum | MSS | fatty acid metabolic process | 95/3467 | 390/18723 | 2.20e-03 | 1.84e-02 | 95 |
| GO:00066313 | Colorectum | FAP | fatty acid metabolic process | 81/2622 | 390/18723 | 1.43e-04 | 2.24e-03 | 81 |
| GO:00066314 | Colorectum | CRC | fatty acid metabolic process | 65/2078 | 390/18723 | 5.30e-04 | 7.42e-03 | 65 |
| GO:00066318 | Esophagus | ESCC | fatty acid metabolic process | 217/8552 | 390/18723 | 4.21e-05 | 3.39e-04 | 217 |
| GO:000669211 | Esophagus | ESCC | prostanoid metabolic process | 33/8552 | 49/18723 | 1.80e-03 | 8.26e-03 | 33 |
| GO:000669311 | Esophagus | ESCC | prostaglandin metabolic process | 33/8552 | 49/18723 | 1.80e-03 | 8.26e-03 | 33 |
| GO:00066316 | Liver | NAFLD | fatty acid metabolic process | 92/1882 | 390/18723 | 3.38e-15 | 3.29e-12 | 92 |
| GO:00335596 | Liver | NAFLD | unsaturated fatty acid metabolic process | 24/1882 | 116/18723 | 4.64e-04 | 6.74e-03 | 24 |
| GO:00066906 | Liver | NAFLD | icosanoid metabolic process | 22/1882 | 123/18723 | 5.33e-03 | 4.11e-02 | 22 |
| GO:000663112 | Liver | Cirrhotic | fatty acid metabolic process | 165/4634 | 390/18723 | 1.29e-14 | 1.26e-12 | 165 |
| GO:00066926 | Liver | Cirrhotic | prostanoid metabolic process | 22/4634 | 49/18723 | 1.64e-03 | 1.05e-02 | 22 |
| GO:00066936 | Liver | Cirrhotic | prostaglandin metabolic process | 22/4634 | 49/18723 | 1.64e-03 | 1.05e-02 | 22 |
| GO:003355911 | Liver | Cirrhotic | unsaturated fatty acid metabolic process | 43/4634 | 116/18723 | 2.09e-03 | 1.29e-02 | 43 |
| GO:000663122 | Liver | HCC | fatty acid metabolic process | 238/7958 | 390/18723 | 8.24e-14 | 4.84e-12 | 238 |
| GO:00066317 | Oral cavity | OSCC | fatty acid metabolic process | 186/7305 | 390/18723 | 2.65e-04 | 1.69e-03 | 186 |
| GO:00066928 | Oral cavity | OSCC | prostanoid metabolic process | 29/7305 | 49/18723 | 3.33e-03 | 1.42e-02 | 29 |
| GO:00066938 | Oral cavity | OSCC | prostaglandin metabolic process | 29/7305 | 49/18723 | 3.33e-03 | 1.42e-02 | 29 |
| GO:00066315 | Stomach | GC | fatty acid metabolic process | 55/1159 | 390/18723 | 8.63e-09 | 8.38e-07 | 55 |
| Page: 1 2 3 |
| Pathway ID | Tissue | Disease Stage | Description | Gene Ratio | Bg Ratio | pvalue | p.adjust | qvalue | Count |
| hsa00983 | Liver | Cirrhotic | Drug metabolism - other enzymes | 34/2530 | 80/8465 | 1.08e-02 | 3.57e-02 | 2.20e-02 | 34 |
| hsa009831 | Liver | Cirrhotic | Drug metabolism - other enzymes | 34/2530 | 80/8465 | 1.08e-02 | 3.57e-02 | 2.20e-02 | 34 |
| hsa009832 | Liver | HCC | Drug metabolism - other enzymes | 54/4020 | 80/8465 | 2.25e-04 | 1.09e-03 | 6.08e-04 | 54 |
| hsa009833 | Liver | HCC | Drug metabolism - other enzymes | 54/4020 | 80/8465 | 2.25e-04 | 1.09e-03 | 6.08e-04 | 54 |
| Page: 1 |
Top |
Cell-cell communication analysis |
| Identification of potential cell-cell interactions between two cell types and their ligand-receptor pairs for different disease states |
| Ligand | Receptor | LRpair | Pathway | Tissue | Disease Stage |
| Page: 1 |
Top |
Single-cell gene regulatory network inference analysis |
| Find out the significant the regulons (TFs) and the target genes of each regulon across cell types for different disease states |
| TF | Cell Type | Tissue | Disease Stage | Target Gene | RSS | Regulon Activity |
| ∗The dot plots of a searched regulon are shown for all cell subpopulations in each disease state of each tissue based on the regulon specific score inferred using pySCENIC and by calculating the average expression. |
| Page: 1 |
Top |
Somatic mutation of malignant transformation related genes |
| Annotation of somatic variants for genes involved in malignant transformation |
| Hugo Symbol | Variant Class | Variant Classification | dbSNP RS | HGVSc | HGVSp | HGVSp Short | SWISSPROT | BIOTYPE | SIFT | PolyPhen | Tumor Sample Barcode | Tissue | Histology | Sex | Age | Stage | Therapy Types | Drugs | Outcome |
| CES2 | SNV | Missense_Mutation | c.724N>T | p.Arg242Cys | p.R242C | protein_coding | deleterious(0) | probably_damaging(0.999) | TCGA-BH-A202-01 | Breast | breast invasive carcinoma | Female | <65 | I/II | Chemotherapy | carboplatin | CR | ||
| CES2 | insertion | In_Frame_Ins | novel | c.229_230insGGA | p.Val77delinsGlyMet | p.V77delinsGM | protein_coding | TCGA-A8-A0A4-01 | Breast | breast invasive carcinoma | Female | >=65 | I/II | Hormone Therapy | tamoxiphen | CR | |||
| CES2 | SNV | Missense_Mutation | novel | c.223A>G | p.Ser75Gly | p.S75G | protein_coding | tolerated(0.39) | benign(0.273) | TCGA-C5-A8XJ-01 | Cervix | cervical & endocervical cancer | Female | >=65 | I/II | Chemotherapy | cisplatin | SD | |
| CES2 | SNV | Missense_Mutation | rs773056840 | c.184N>C | p.Glu62Gln | p.E62Q | protein_coding | tolerated(0.18) | benign(0.186) | TCGA-LP-A5U2-01 | Cervix | cervical & endocervical cancer | Female | <65 | III/IV | Unknown | Unknown | SD | |
| CES2 | SNV | Missense_Mutation | rs761698722 | c.808N>T | p.Arg270Cys | p.R270C | protein_coding | deleterious(0) | benign(0.033) | TCGA-AA-3864-01 | Colorectum | colon adenocarcinoma | Male | >=65 | I/II | Unknown | Unknown | SD | |
| CES2 | SNV | Missense_Mutation | rs371064921 | c.878N>T | p.Ala293Val | p.A293V | protein_coding | deleterious(0) | probably_damaging(0.997) | TCGA-AA-A02R-01 | Colorectum | colon adenocarcinoma | Female | >=65 | I/II | Unknown | Unknown | PD | |
| CES2 | SNV | Missense_Mutation | rs753837525 | c.1766N>T | p.Ala589Val | p.A589V | protein_coding | tolerated(0.18) | benign(0.012) | TCGA-CM-6162-01 | Colorectum | colon adenocarcinoma | Female | <65 | III/IV | Chemotherapy | oxaliplatin | SD | |
| CES2 | deletion | Frame_Shift_Del | c.1470delT | p.Gln491SerfsTer27 | p.Q491Sfs*27 | protein_coding | TCGA-A6-3809-01 | Colorectum | colon adenocarcinoma | Female | >=65 | I/II | Unknown | Unknown | SD | ||||
| CES2 | SNV | Missense_Mutation | novel | c.1538N>T | p.Arg513Met | p.R513M | protein_coding | deleterious(0) | possibly_damaging(0.878) | TCGA-A5-A0G2-01 | Endometrium | uterine corpus endometrioid carcinoma | Female | <65 | III/IV | Unknown | Unknown | SD | |
| CES2 | SNV | Missense_Mutation | rs139864573 | c.634G>A | p.Gly212Ser | p.G212S | protein_coding | deleterious(0) | probably_damaging(1) | TCGA-AP-A1DK-01 | Endometrium | uterine corpus endometrioid carcinoma | Female | <65 | I/II | Unknown | Unknown | SD |
| Page: 1 2 3 4 5 |
Top |
Related drugs of malignant transformation related genes |
| Identification of chemicals and drugs interact with genes involved in malignant transfromation |
| (DGIdb 4.0) |
| Entrez ID | Symbol | Category | Interaction Types | Drug Claim Name | Drug Name | PMIDs |
| 8824 | CES2 | DRUGGABLE GENOME, ENZYME | SN-38 | 7-ETHYL-10-HYDROXYCAMPTOTHECIN | ||
| 8824 | CES2 | DRUGGABLE GENOME, ENZYME | irinotecan | IRINOTECAN | ||
| 8824 | CES2 | DRUGGABLE GENOME, ENZYME | mycophenolate mofetil | 24220207 | ||
| 8824 | CES2 | DRUGGABLE GENOME, ENZYME | mycophenolic acid | 24220207 |
| Page: 1 |

Copyright 2023-Present -The University of Texas Health Science Center at Houston |