
|
|||||
|
 | |
| |
| |
| |
| |
| |
|
Gene: CES1 |
Gene summary for CES1 |
| Gene information | Species | Human | Gene symbol | CES1 | Gene ID | 1066 |
| Gene name | carboxylesterase 1 | |
| Gene Alias | ACAT | |
| Cytomap | 16q12.2 | |
| Gene Type | protein-coding | GO ID | GO:0006066 | UniProtAcc | P23141 |
Top |
Malignant transformation analysis |
| Identification of the aberrant gene expression in precancerous and cancerous lesions by comparing the gene expression of stem-like cells in diseased tissues with normal stem cells |
| Entrez ID | Symbol | Replicates | Species | Organ | Tissue | Adj P-value | Log2FC | Malignancy |
| 1066 | CES1 | LZE2D | Human | Esophagus | HGIN | 9.44e-07 | 1.53e+00 | 0.0642 |
| 1066 | CES1 | LZE2T | Human | Esophagus | ESCC | 5.33e-21 | 3.55e+00 | 0.082 |
| 1066 | CES1 | LZE4T | Human | Esophagus | ESCC | 8.14e-64 | 3.34e+00 | 0.0811 |
| 1066 | CES1 | LZE7T | Human | Esophagus | ESCC | 2.35e-34 | 2.18e+00 | 0.0667 |
| 1066 | CES1 | LZE21D1 | Human | Esophagus | HGIN | 3.02e-02 | 9.29e-01 | 0.0632 |
| 1066 | CES1 | LZE22D1 | Human | Esophagus | HGIN | 3.90e-08 | 7.72e-01 | 0.0595 |
| 1066 | CES1 | LZE22T | Human | Esophagus | ESCC | 1.21e-10 | 1.19e+00 | 0.068 |
| 1066 | CES1 | LZE21T | Human | Esophagus | ESCC | 5.73e-13 | 1.66e+00 | 0.0655 |
| 1066 | CES1 | P9T-E | Human | Esophagus | ESCC | 7.41e-70 | 1.89e+00 | 0.1131 |
| 1066 | CES1 | P15T-E | Human | Esophagus | ESCC | 3.37e-50 | 2.77e+00 | 0.1149 |
| 1066 | CES1 | P20T-E | Human | Esophagus | ESCC | 8.77e-11 | 6.77e-01 | 0.1124 |
| 1066 | CES1 | P22T-E | Human | Esophagus | ESCC | 9.33e-25 | 7.95e-01 | 0.1236 |
| 1066 | CES1 | P28T-E | Human | Esophagus | ESCC | 5.56e-06 | 3.97e-01 | 0.1149 |
| 1066 | CES1 | P30T-E | Human | Esophagus | ESCC | 2.60e-65 | 4.65e+00 | 0.137 |
| 1066 | CES1 | P32T-E | Human | Esophagus | ESCC | 5.35e-16 | 9.97e-01 | 0.1666 |
| 1066 | CES1 | P39T-E | Human | Esophagus | ESCC | 3.42e-49 | 1.83e+00 | 0.0894 |
| 1066 | CES1 | P42T-E | Human | Esophagus | ESCC | 1.74e-13 | 1.58e+00 | 0.1175 |
| 1066 | CES1 | P44T-E | Human | Esophagus | ESCC | 7.08e-04 | 2.81e-01 | 0.1096 |
| 1066 | CES1 | P47T-E | Human | Esophagus | ESCC | 1.52e-12 | 5.04e-01 | 0.1067 |
| 1066 | CES1 | P48T-E | Human | Esophagus | ESCC | 4.37e-17 | 1.08e+00 | 0.0959 |
| Page: 1 2 3 4 |
| Tissue | Expression Dynamics | Abbreviation |
| Esophagus | 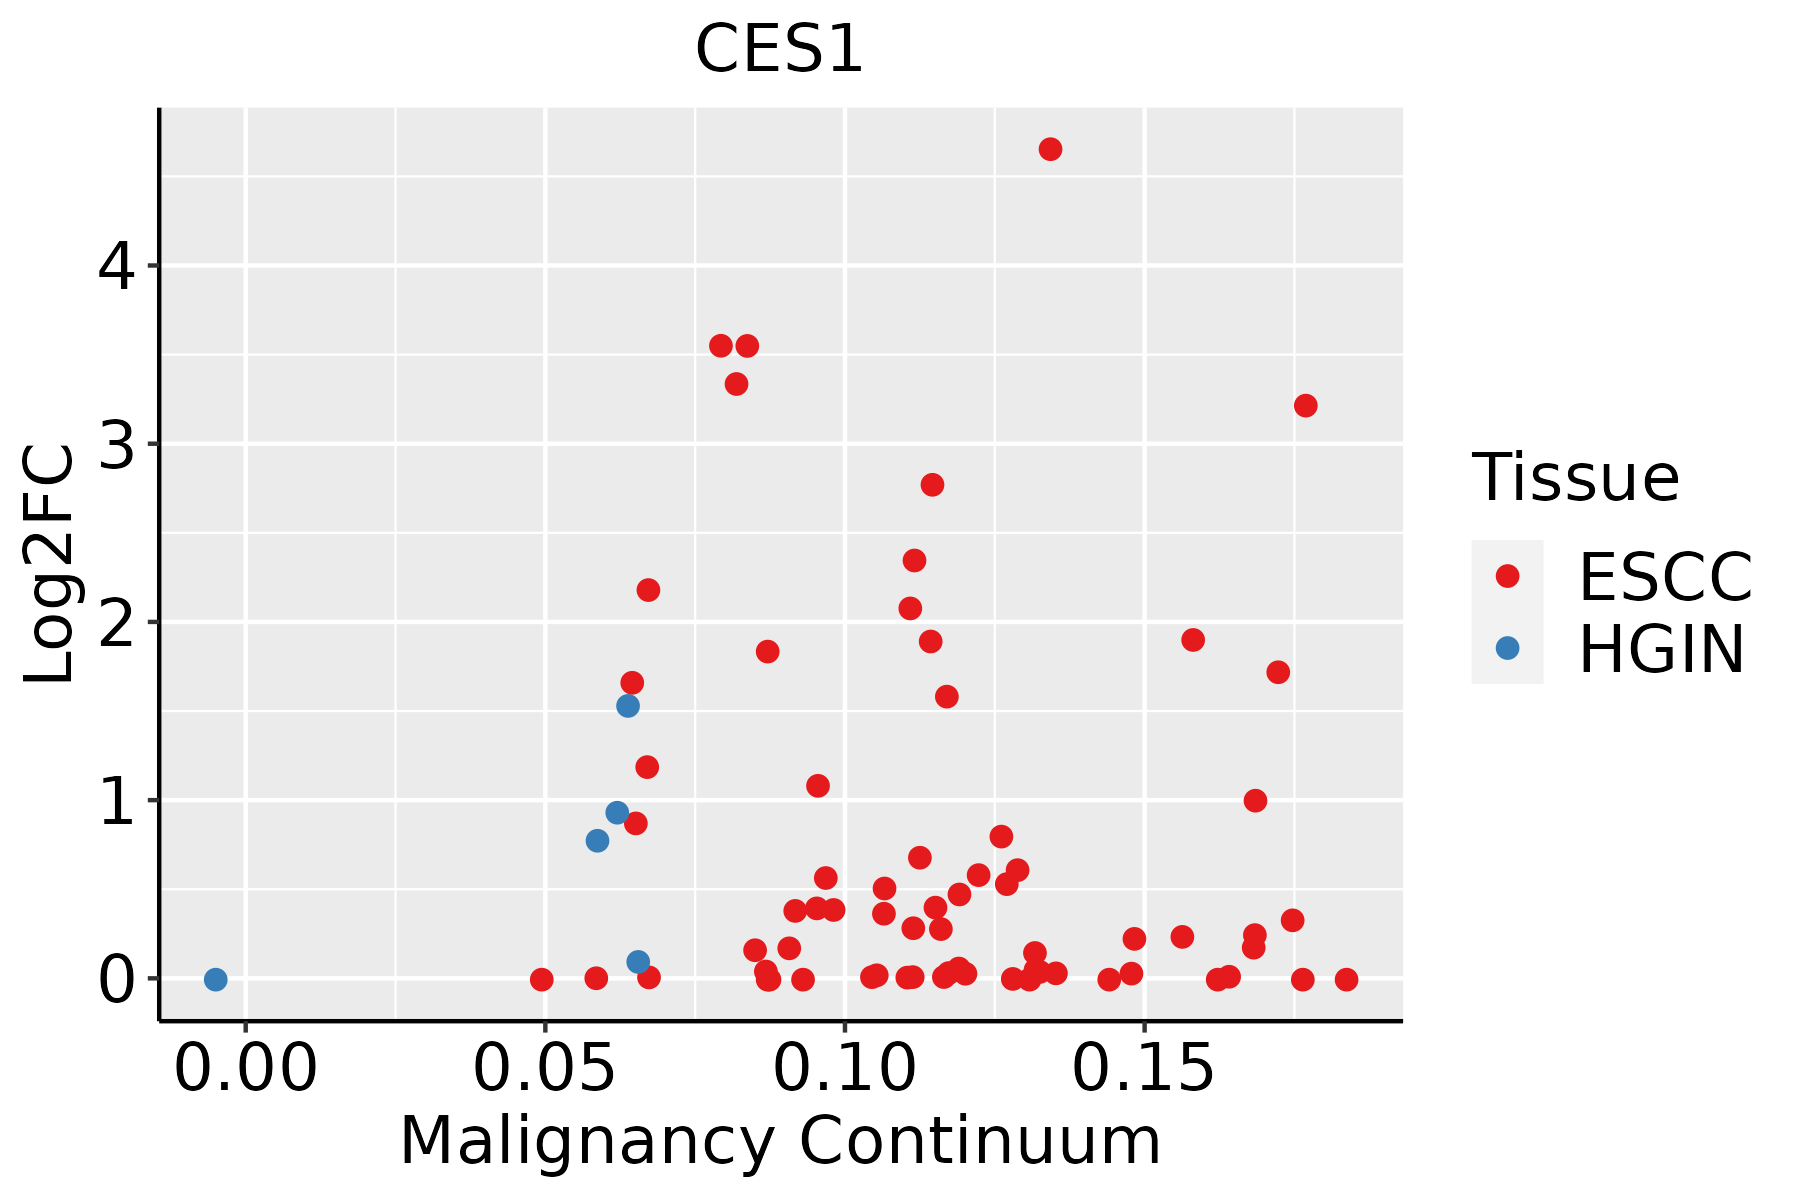 | ESCC: Esophageal squamous cell carcinoma |
| HGIN: High-grade intraepithelial neoplasias | ||
| LGIN: Low-grade intraepithelial neoplasias | ||
| Liver | 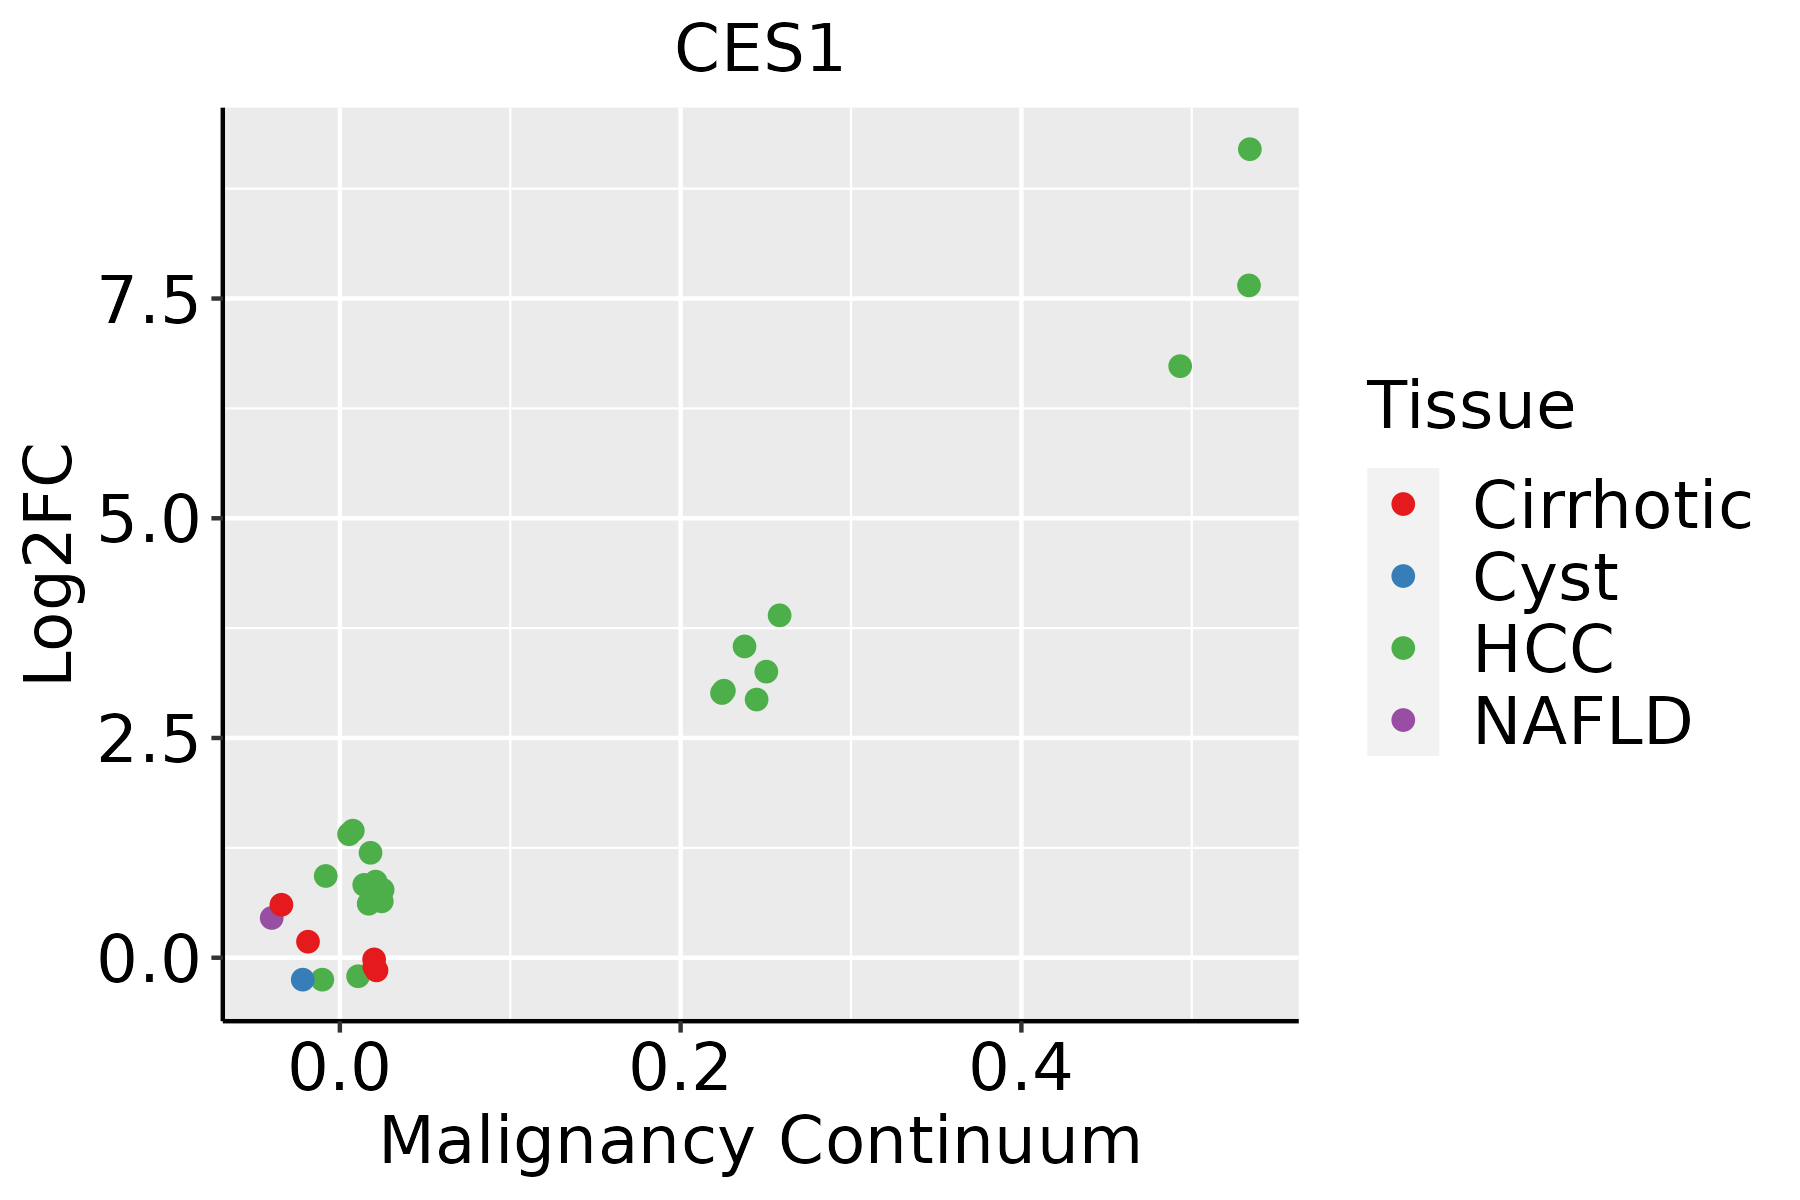 | HCC: Hepatocellular carcinoma |
| NAFLD: Non-alcoholic fatty liver disease | ||
| Oral Cavity | 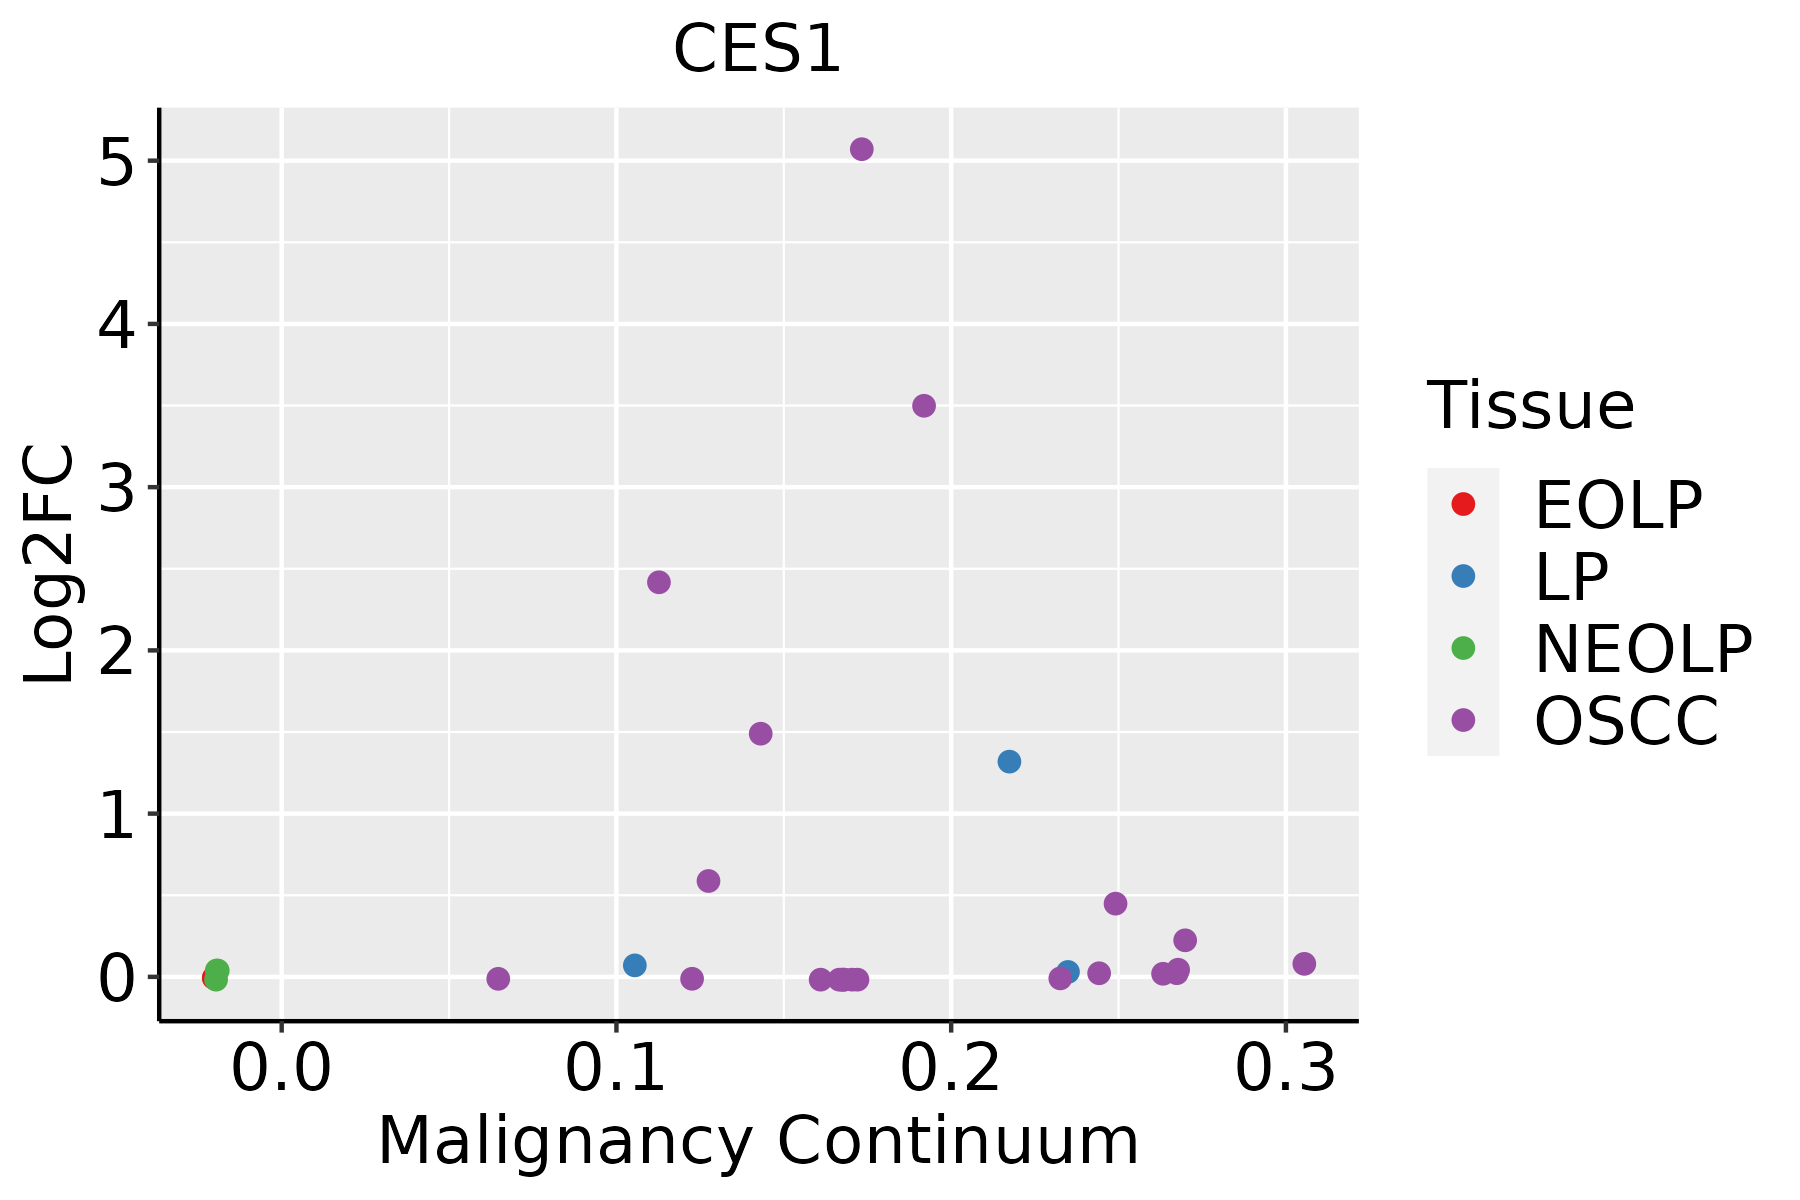 | EOLP: Erosive Oral lichen planus |
| LP: leukoplakia | ||
| NEOLP: Non-erosive oral lichen planus | ||
| OSCC: Oral squamous cell carcinoma |
| ∗log2FC in expression of this searched gene in stem-like cells from each diseased tissue sample relative to stem-like cells in normal samples in each tissue plotted against the malignancy continuum. Samples are colored based on if they are from different disease stage. |
Top |
Malignant transformation related pathway analysis |
| Find out the enriched GO biological processes and KEGG pathways involved in transition from healthy to precancer to cancer |
| Tissue | Disease Stage | Enriched GO biological Processes |
| Colorectum | AD |  |
| Colorectum | SER |  |
| Colorectum | MSS |  |
| Colorectum | MSI-H |  |
| Colorectum | FAP |  |
| ∗Top 15 enriched GO BP terms are showed in the bar plot of each disease state in each tissue. Each row represents a significant GO biological process which is colored according to the -log10(p.adjust). |
| Page: 1 2 3 4 5 6 7 8 9 |
| GO ID | Tissue | Disease Stage | Description | Gene Ratio | Bg Ratio | pvalue | p.adjust | Count |
| GO:005123520 | Esophagus | HGIN | maintenance of location | 73/2587 | 327/18723 | 1.73e-05 | 4.71e-04 | 73 |
| GO:009730520 | Esophagus | HGIN | response to alcohol | 54/2587 | 253/18723 | 6.46e-04 | 8.87e-03 | 54 |
| GO:001648210 | Esophagus | ESCC | cytosolic transport | 124/8552 | 168/18723 | 9.69e-14 | 4.69e-12 | 124 |
| GO:0051235110 | Esophagus | ESCC | maintenance of location | 200/8552 | 327/18723 | 1.01e-08 | 2.02e-07 | 200 |
| GO:00060668 | Esophagus | ESCC | alcohol metabolic process | 202/8552 | 353/18723 | 7.32e-06 | 7.26e-05 | 202 |
| GO:00161263 | Esophagus | ESCC | sterol biosynthetic process | 46/8552 | 64/18723 | 1.91e-05 | 1.67e-04 | 46 |
| GO:00066318 | Esophagus | ESCC | fatty acid metabolic process | 217/8552 | 390/18723 | 4.21e-05 | 3.39e-04 | 217 |
| GO:00066953 | Esophagus | ESCC | cholesterol biosynthetic process | 41/8552 | 57/18723 | 5.25e-05 | 4.06e-04 | 41 |
| GO:19026533 | Esophagus | ESCC | secondary alcohol biosynthetic process | 41/8552 | 57/18723 | 5.25e-05 | 4.06e-04 | 41 |
| GO:00199155 | Esophagus | ESCC | lipid storage | 58/8552 | 87/18723 | 6.15e-05 | 4.72e-04 | 58 |
| GO:000963620 | Esophagus | ESCC | response to toxic substance | 150/8552 | 262/18723 | 1.00e-04 | 7.12e-04 | 150 |
| GO:00463948 | Esophagus | ESCC | carboxylic acid biosynthetic process | 175/8552 | 314/18723 | 1.98e-04 | 1.26e-03 | 175 |
| GO:00160538 | Esophagus | ESCC | organic acid biosynthetic process | 175/8552 | 316/18723 | 3.04e-04 | 1.82e-03 | 175 |
| GO:00620129 | Esophagus | ESCC | regulation of small molecule metabolic process | 184/8552 | 334/18723 | 3.11e-04 | 1.85e-03 | 184 |
| GO:19026524 | Esophagus | ESCC | secondary alcohol metabolic process | 87/8552 | 147/18723 | 6.58e-04 | 3.50e-03 | 87 |
| GO:00421805 | Esophagus | ESCC | cellular ketone metabolic process | 120/8552 | 211/18723 | 6.70e-04 | 3.55e-03 | 120 |
| GO:00461653 | Esophagus | ESCC | alcohol biosynthetic process | 83/8552 | 140/18723 | 8.04e-04 | 4.16e-03 | 83 |
| GO:00108884 | Esophagus | ESCC | negative regulation of lipid storage | 18/8552 | 23/18723 | 1.50e-03 | 7.06e-03 | 18 |
| GO:00066946 | Esophagus | ESCC | steroid biosynthetic process | 98/8552 | 173/18723 | 2.34e-03 | 1.03e-02 | 98 |
| GO:0097305111 | Esophagus | ESCC | response to alcohol | 138/8552 | 253/18723 | 2.70e-03 | 1.14e-02 | 138 |
| Page: 1 2 3 4 5 6 7 8 9 10 |
| Pathway ID | Tissue | Disease Stage | Description | Gene Ratio | Bg Ratio | pvalue | p.adjust | qvalue | Count |
| hsa009832 | Liver | HCC | Drug metabolism - other enzymes | 54/4020 | 80/8465 | 2.25e-04 | 1.09e-03 | 6.08e-04 | 54 |
| hsa009833 | Liver | HCC | Drug metabolism - other enzymes | 54/4020 | 80/8465 | 2.25e-04 | 1.09e-03 | 6.08e-04 | 54 |
| Page: 1 |
Top |
Cell-cell communication analysis |
| Identification of potential cell-cell interactions between two cell types and their ligand-receptor pairs for different disease states |
| Ligand | Receptor | LRpair | Pathway | Tissue | Disease Stage |
| Page: 1 |
Top |
Single-cell gene regulatory network inference analysis |
| Find out the significant the regulons (TFs) and the target genes of each regulon across cell types for different disease states |
| TF | Cell Type | Tissue | Disease Stage | Target Gene | RSS | Regulon Activity |
| ∗The dot plots of a searched regulon are shown for all cell subpopulations in each disease state of each tissue based on the regulon specific score inferred using pySCENIC and by calculating the average expression. |
| Page: 1 |
Top |
Somatic mutation of malignant transformation related genes |
| Annotation of somatic variants for genes involved in malignant transformation |
| Hugo Symbol | Variant Class | Variant Classification | dbSNP RS | HGVSc | HGVSp | HGVSp Short | SWISSPROT | BIOTYPE | SIFT | PolyPhen | Tumor Sample Barcode | Tissue | Histology | Sex | Age | Stage | Therapy Types | Drugs | Outcome |
| CES1 | SNV | Missense_Mutation | rs369026668 | c.446N>T | p.Ala149Val | p.A149V | P23141 | protein_coding | deleterious(0.05) | benign(0.05) | TCGA-A8-A08R-01 | Breast | breast invasive carcinoma | Female | <65 | I/II | Unknown | Unknown | SD |
| CES1 | SNV | Missense_Mutation | novel | c.1206G>T | p.Glu402Asp | p.E402D | P23141 | protein_coding | tolerated(0.25) | benign(0.005) | TCGA-AN-A046-01 | Breast | breast invasive carcinoma | Female | >=65 | I/II | Unknown | Unknown | SD |
| CES1 | SNV | Missense_Mutation | c.478N>T | p.Ala160Ser | p.A160S | P23141 | protein_coding | deleterious(0.02) | benign(0.325) | TCGA-B6-A0RP-01 | Breast | breast invasive carcinoma | Female | >=65 | I/II | Unknown | Unknown | PD | |
| CES1 | SNV | Missense_Mutation | rs747321428 | c.1095N>C | p.Met365Ile | p.M365I | P23141 | protein_coding | tolerated(0.12) | benign(0.007) | TCGA-DS-A1OC-01 | Cervix | cervical & endocervical cancer | Female | <65 | I/II | Chemotherapy | gemcitabine | SD |
| CES1 | SNV | Missense_Mutation | c.1263N>C | p.Leu421Phe | p.L421F | P23141 | protein_coding | deleterious(0.05) | benign(0.197) | TCGA-IR-A3LA-01 | Cervix | cervical & endocervical cancer | Female | <65 | I/II | Chemotherapy | cisplatin | CR | |
| CES1 | SNV | Missense_Mutation | novel | c.958C>A | p.Leu320Met | p.L320M | P23141 | protein_coding | tolerated(0.08) | benign(0.239) | TCGA-MA-AA42-01 | Cervix | cervical & endocervical cancer | Female | >=65 | I/II | Unknown | Unknown | SD |
| CES1 | SNV | Missense_Mutation | rs369300055 | c.515N>A | p.Arg172His | p.R172H | P23141 | protein_coding | deleterious(0) | probably_damaging(0.993) | TCGA-UC-A7PG-06 | Cervix | cervical & endocervical cancer | Female | <65 | III/IV | Chemotherapy | cisplatin | PD |
| CES1 | SNV | Missense_Mutation | rs750790605 | c.404N>T | p.Pro135Leu | p.P135L | P23141 | protein_coding | deleterious(0.01) | possibly_damaging(0.873) | TCGA-VS-A9UV-01 | Cervix | cervical & endocervical cancer | Female | >=65 | I/II | Unknown | Unknown | PD |
| CES1 | SNV | Missense_Mutation | rs376173751 | c.727N>T | p.Arg243Trp | p.R243W | P23141 | protein_coding | deleterious(0.02) | probably_damaging(0.997) | TCGA-AA-3492-01 | Colorectum | colon adenocarcinoma | Female | >=65 | I/II | Unknown | Unknown | SD |
| CES1 | SNV | Missense_Mutation | c.668N>T | p.Ala223Val | p.A223V | P23141 | protein_coding | deleterious(0) | benign(0.304) | TCGA-AA-3492-01 | Colorectum | colon adenocarcinoma | Female | >=65 | I/II | Unknown | Unknown | SD |
| Page: 1 2 3 4 5 6 7 8 |
Top |
Related drugs of malignant transformation related genes |
| Identification of chemicals and drugs interact with genes involved in malignant transfromation |
| (DGIdb 4.0) |
| Entrez ID | Symbol | Category | Interaction Types | Drug Claim Name | Drug Name | PMIDs |
| 1066 | CES1 | DRUGGABLE GENOME, ENZYME | clopidogrel | CLOPIDOGREL | 23275066,27450232,25704243,24535487 | |
| 1066 | CES1 | DRUGGABLE GENOME, ENZYME | inhibitor | 178103312 | ||
| 1066 | CES1 | DRUGGABLE GENOME, ENZYME | K-604 | |||
| 1066 | CES1 | DRUGGABLE GENOME, ENZYME | mycophenolate mofetil | 24220207 | ||
| 1066 | CES1 | DRUGGABLE GENOME, ENZYME | 2-oxo-clopidogrel | 23275066 | ||
| 1066 | CES1 | DRUGGABLE GENOME, ENZYME | Eldacimibe | ELDACIMIBE | ||
| 1066 | CES1 | DRUGGABLE GENOME, ENZYME | trandolapril | TRANDOLAPRIL | 19185566 | |
| 1066 | CES1 | DRUGGABLE GENOME, ENZYME | irinotecan | IRINOTECAN | ||
| 1066 | CES1 | DRUGGABLE GENOME, ENZYME | Dabigatran | DABIGATRAN | 23467860,27261537 | |
| 1066 | CES1 | DRUGGABLE GENOME, ENZYME | enalapril | ENALAPRIL | 25919042 |
| Page: 1 2 |

Copyright 2023-Present -The University of Texas Health Science Center at Houston |