
|
|||||
|
 | |
| |
| |
| |
| |
| |
|
Gene: CERS4 |
Gene summary for CERS4 |
| Gene information | Species | Human | Gene symbol | CERS4 | Gene ID | 79603 |
| Gene name | ceramide synthase 4 | |
| Gene Alias | LASS4 | |
| Cytomap | 19p13.2 | |
| Gene Type | protein-coding | GO ID | GO:0006629 | UniProtAcc | Q53HF9 |
Top |
Malignant transformation analysis |
| Identification of the aberrant gene expression in precancerous and cancerous lesions by comparing the gene expression of stem-like cells in diseased tissues with normal stem cells |
| Entrez ID | Symbol | Replicates | Species | Organ | Tissue | Adj P-value | Log2FC | Malignancy |
| 79603 | CERS4 | GSM4909290 | Human | Breast | IDC | 2.51e-03 | 2.91e-01 | 0.2096 |
| 79603 | CERS4 | GSM4909291 | Human | Breast | IDC | 4.08e-16 | 5.82e-01 | 0.1753 |
| 79603 | CERS4 | GSM4909298 | Human | Breast | IDC | 2.39e-04 | 2.22e-01 | 0.1551 |
| 79603 | CERS4 | GSM4909305 | Human | Breast | IDC | 3.49e-03 | 2.55e-01 | 0.0436 |
| 79603 | CERS4 | GSM4909306 | Human | Breast | IDC | 1.63e-03 | 2.26e-01 | 0.1564 |
| 79603 | CERS4 | GSM4909308 | Human | Breast | IDC | 1.93e-10 | 3.66e-01 | 0.158 |
| 79603 | CERS4 | GSM4909311 | Human | Breast | IDC | 2.25e-02 | 7.04e-02 | 0.1534 |
| 79603 | CERS4 | GSM4909312 | Human | Breast | IDC | 1.20e-06 | 3.98e-01 | 0.1552 |
| 79603 | CERS4 | GSM4909313 | Human | Breast | IDC | 2.41e-02 | 2.84e-01 | 0.0391 |
| 79603 | CERS4 | GSM4909317 | Human | Breast | IDC | 7.32e-03 | 2.36e-01 | 0.1355 |
| 79603 | CERS4 | GSM4909319 | Human | Breast | IDC | 7.25e-07 | 6.52e-02 | 0.1563 |
| 79603 | CERS4 | brca2 | Human | Breast | Precancer | 1.21e-05 | 2.78e-01 | -0.024 |
| 79603 | CERS4 | brca3 | Human | Breast | Precancer | 1.57e-03 | 1.95e-01 | -0.0263 |
| 79603 | CERS4 | M1 | Human | Breast | IDC | 3.92e-05 | 3.04e-01 | 0.1577 |
| 79603 | CERS4 | DCIS2 | Human | Breast | DCIS | 6.39e-13 | 3.40e-02 | 0.0085 |
| 79603 | CERS4 | LZE4T | Human | Esophagus | ESCC | 2.25e-10 | 4.36e-01 | 0.0811 |
| 79603 | CERS4 | LZE5T | Human | Esophagus | ESCC | 1.12e-08 | 7.15e-01 | 0.0514 |
| 79603 | CERS4 | LZE20T | Human | Esophagus | ESCC | 3.22e-08 | 2.19e-01 | 0.0662 |
| 79603 | CERS4 | LZE22T | Human | Esophagus | ESCC | 1.35e-03 | 2.46e-01 | 0.068 |
| 79603 | CERS4 | LZE24T | Human | Esophagus | ESCC | 1.41e-22 | 7.26e-01 | 0.0596 |
| Page: 1 2 3 4 5 6 |
| Tissue | Expression Dynamics | Abbreviation |
| Breast |  | IDC: Invasive ductal carcinoma |
| DCIS: Ductal carcinoma in situ | ||
| Precancer(BRCA1-mut): Precancerous lesion from BRCA1 mutation carriers | ||
| Esophagus | 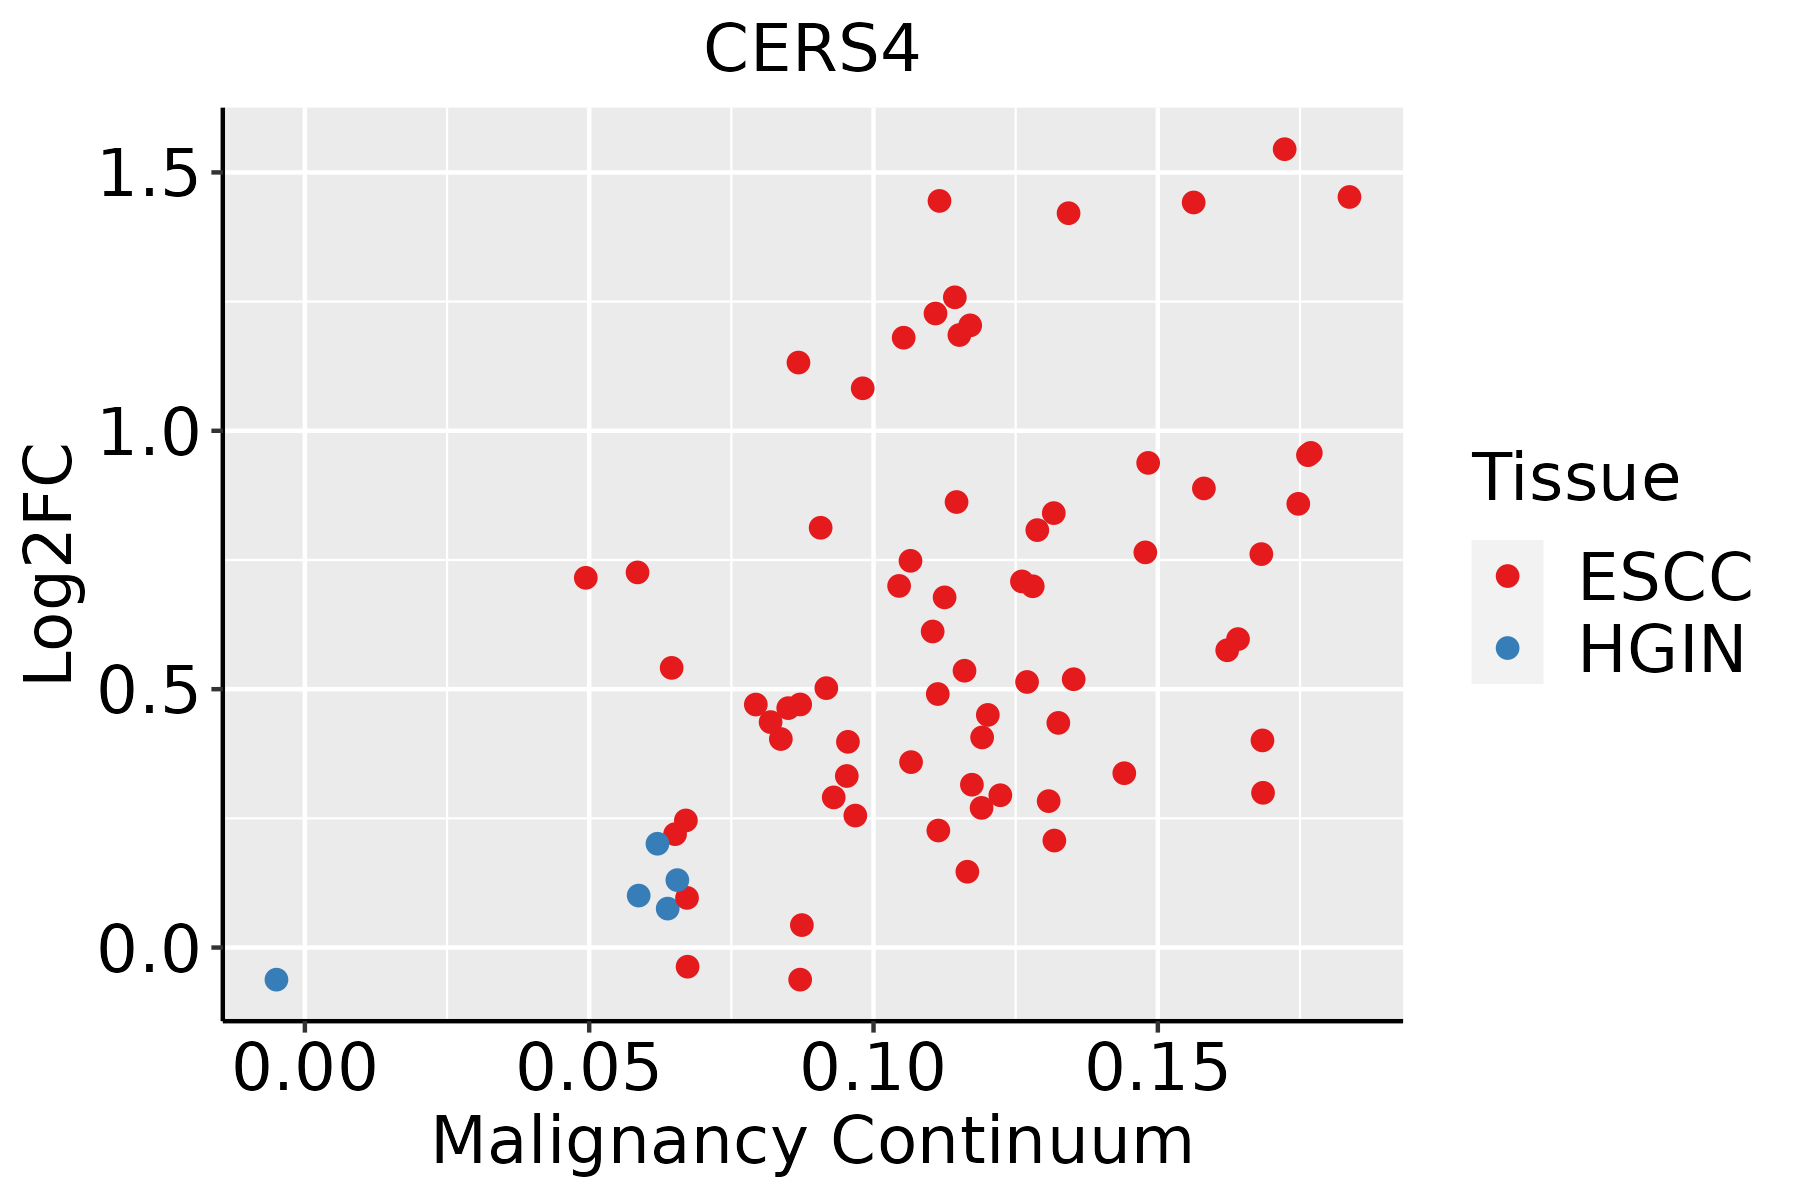 | ESCC: Esophageal squamous cell carcinoma |
| HGIN: High-grade intraepithelial neoplasias | ||
| LGIN: Low-grade intraepithelial neoplasias | ||
| Liver | 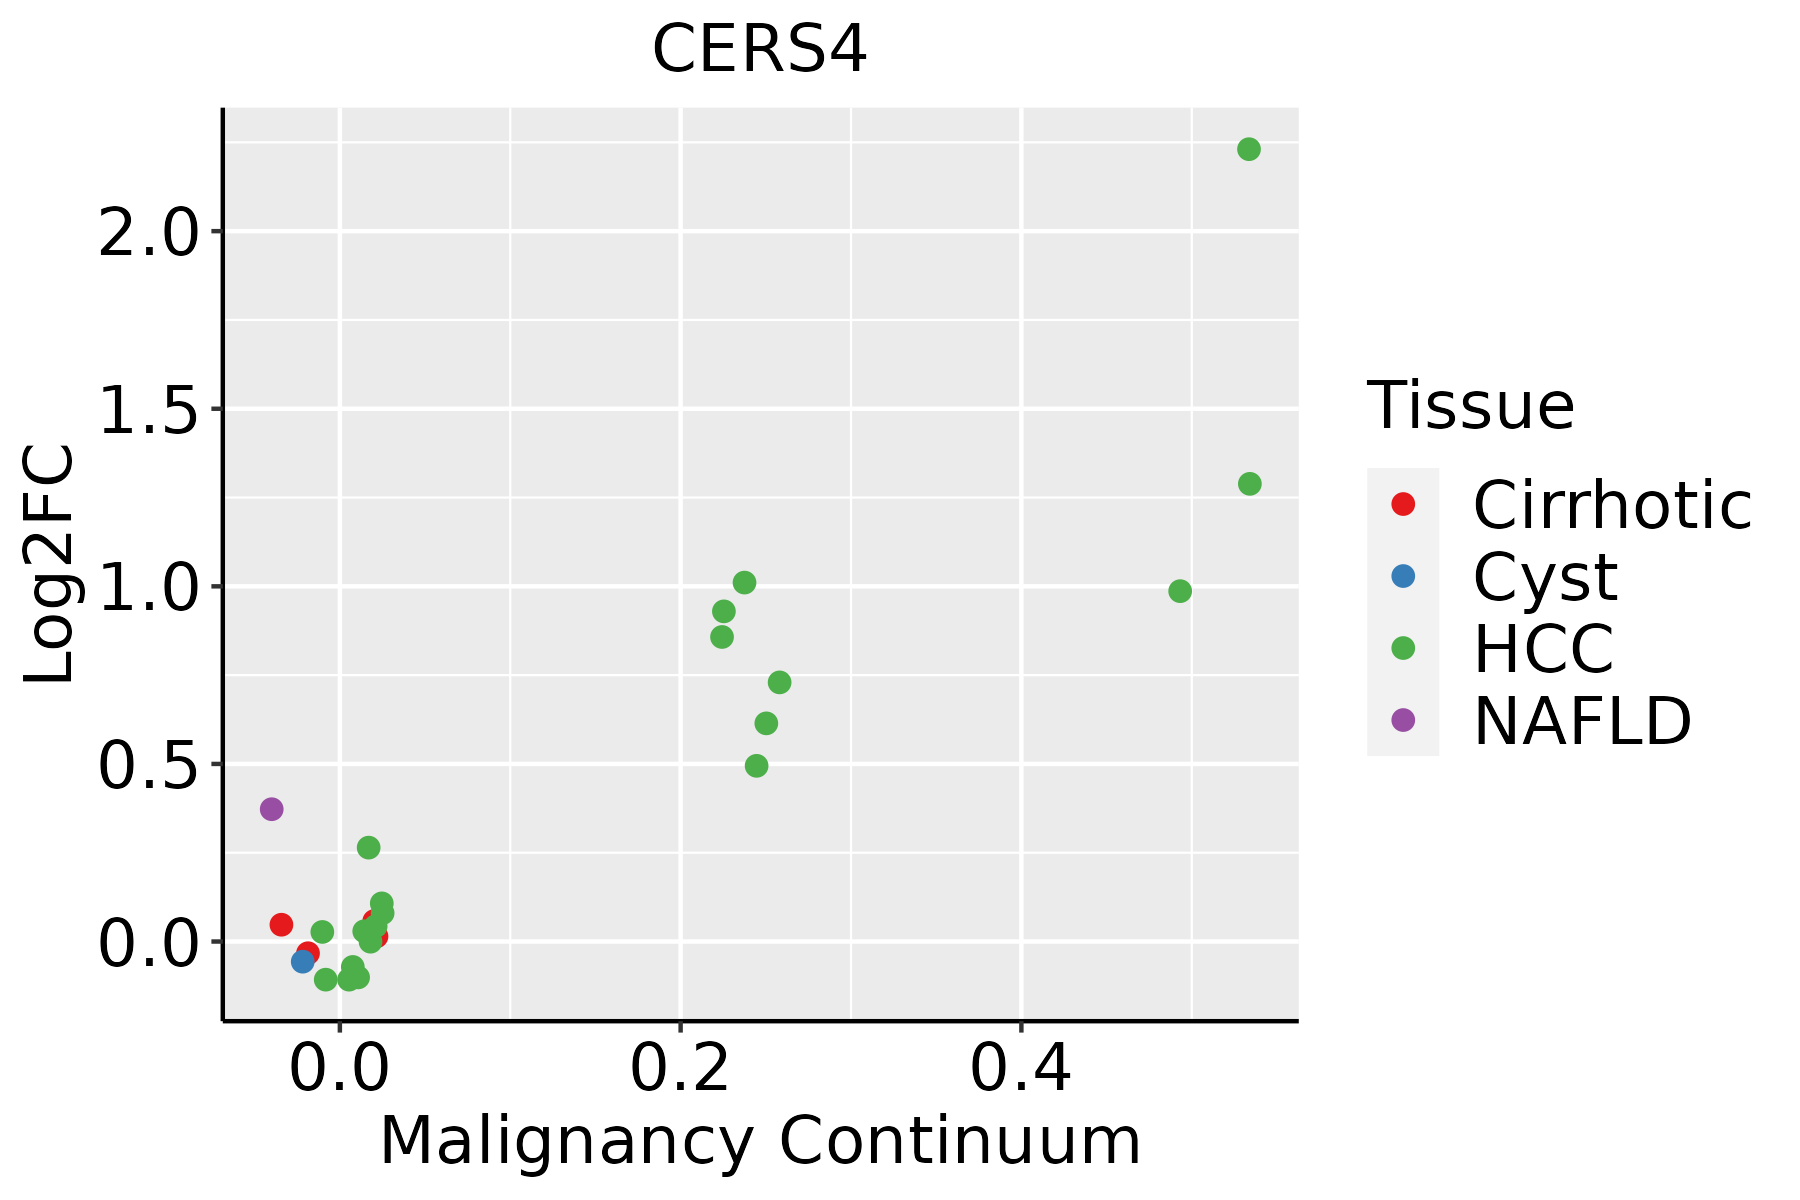 | HCC: Hepatocellular carcinoma |
| NAFLD: Non-alcoholic fatty liver disease | ||
| Oral Cavity | 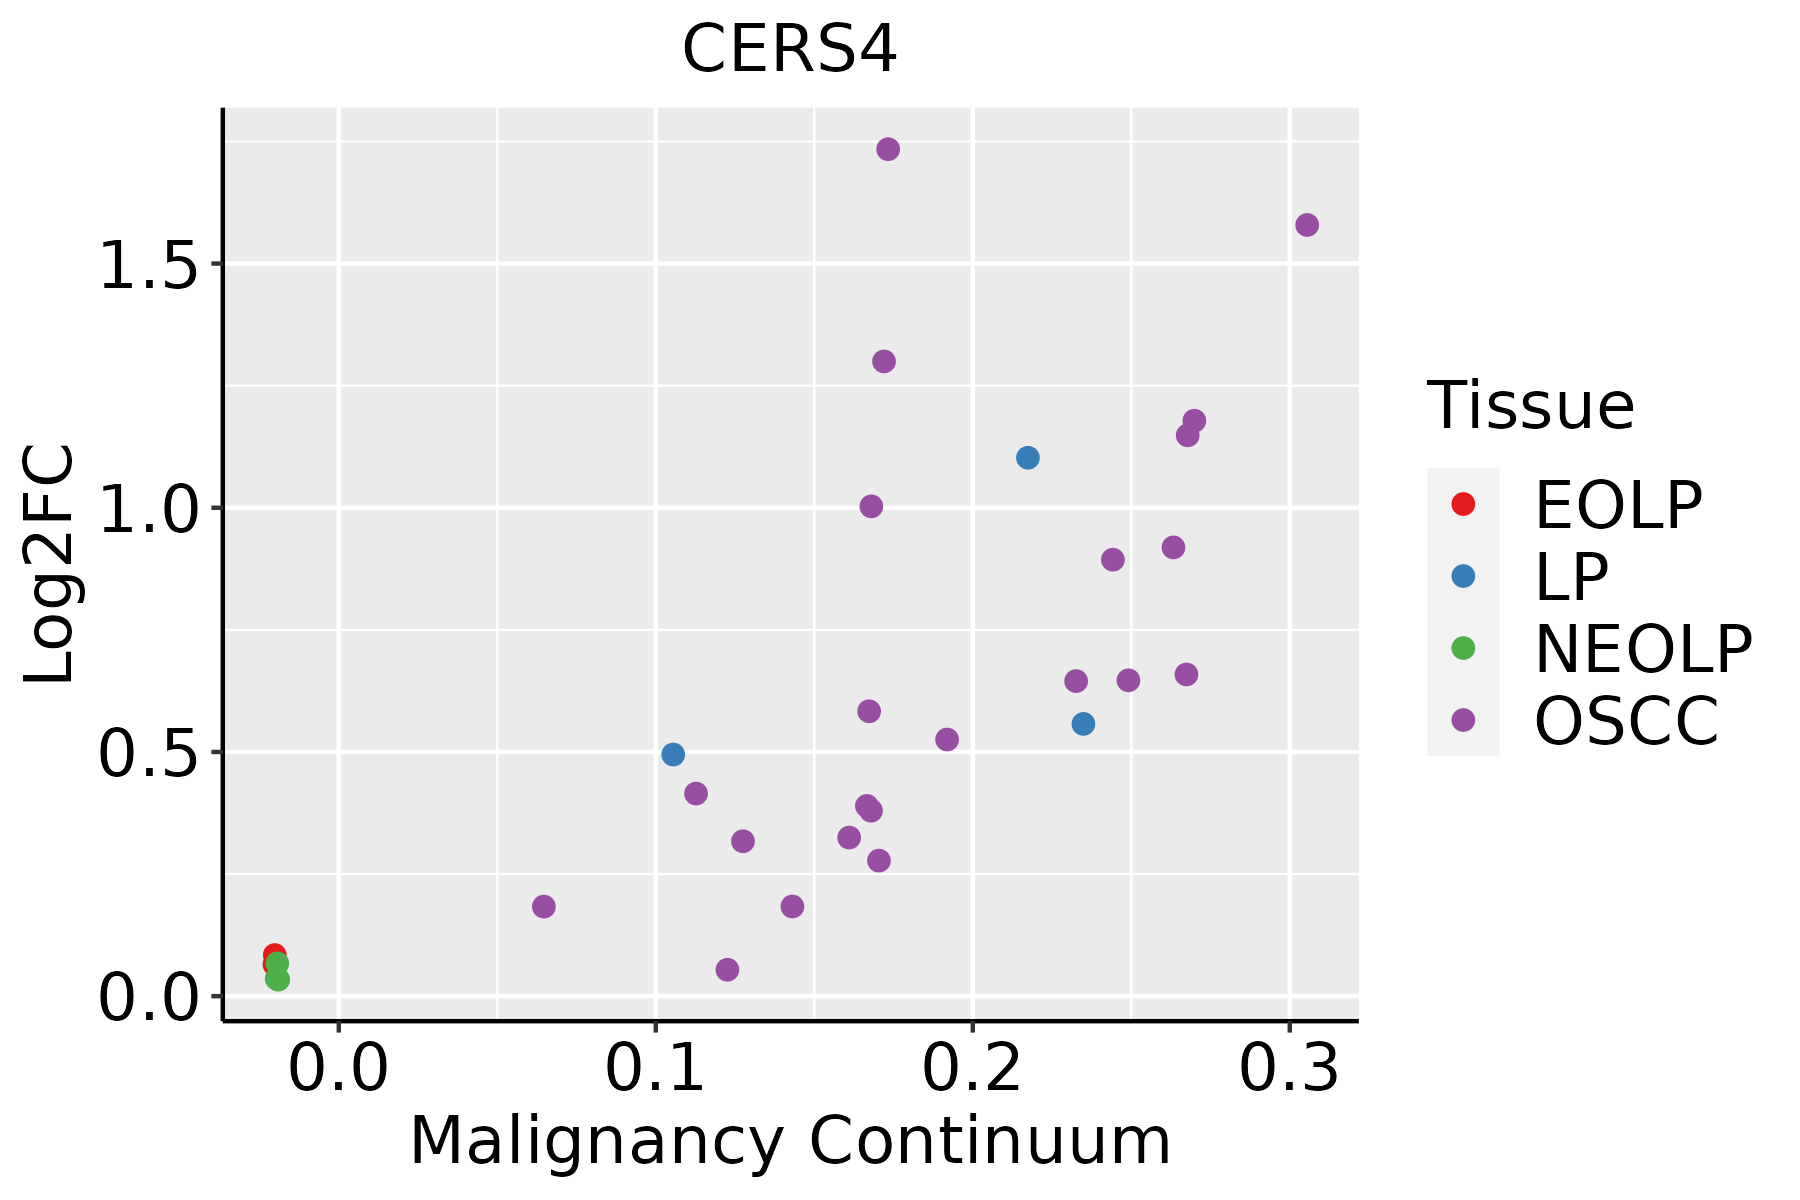 | EOLP: Erosive Oral lichen planus |
| LP: leukoplakia | ||
| NEOLP: Non-erosive oral lichen planus | ||
| OSCC: Oral squamous cell carcinoma | ||
| Prostate | 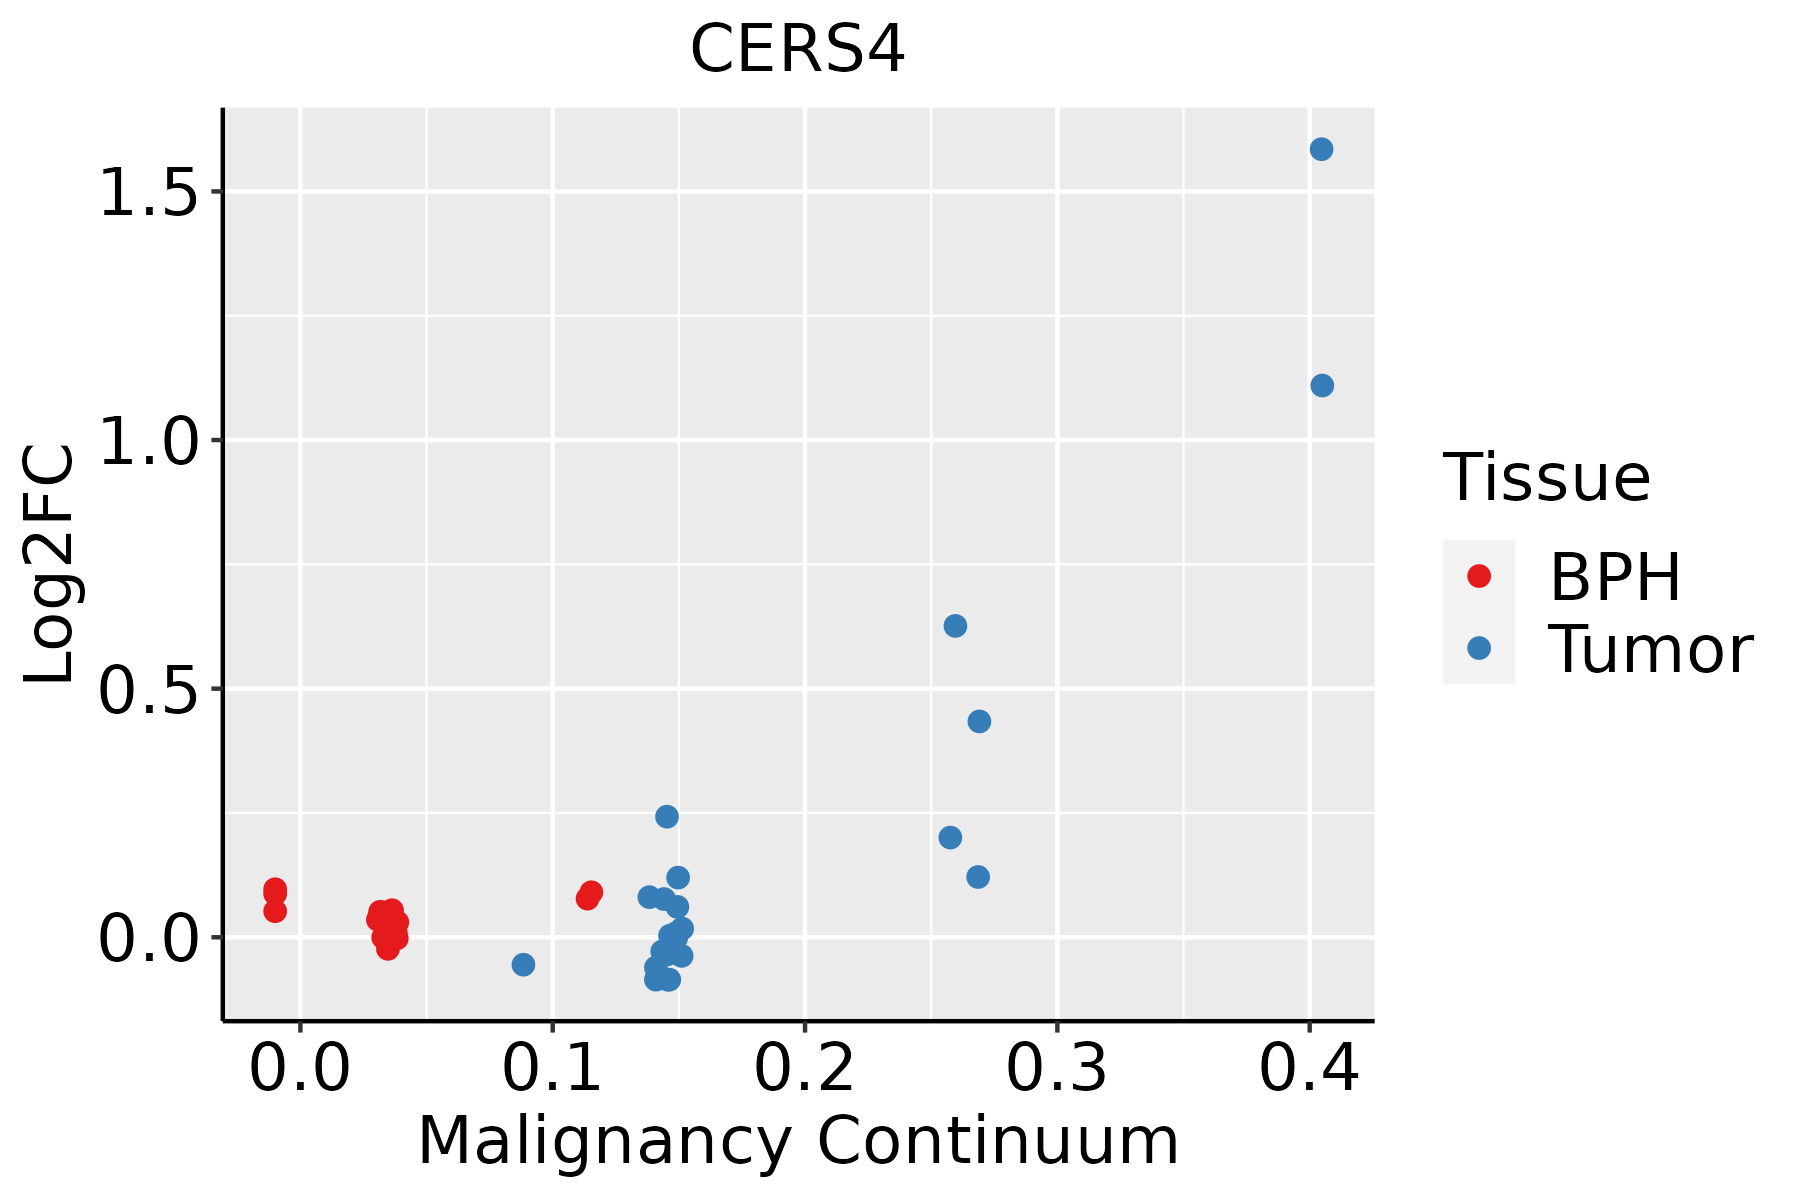 | BPH: Benign Prostatic Hyperplasia |
| Skin |  | AK: Actinic keratosis |
| cSCC: Cutaneous squamous cell carcinoma | ||
| SCCIS:squamous cell carcinoma in situ | ||
| Thyroid |  | ATC: Anaplastic thyroid cancer |
| HT: Hashimoto's thyroiditis | ||
| PTC: Papillary thyroid cancer |
| ∗log2FC in expression of this searched gene in stem-like cells from each diseased tissue sample relative to stem-like cells in normal samples in each tissue plotted against the malignancy continuum. Samples are colored based on if they are from different disease stage. |
Top |
Malignant transformation related pathway analysis |
| Find out the enriched GO biological processes and KEGG pathways involved in transition from healthy to precancer to cancer |
| Tissue | Disease Stage | Enriched GO biological Processes |
| Colorectum | AD |  |
| Colorectum | SER |  |
| Colorectum | MSS |  |
| Colorectum | MSI-H |  |
| Colorectum | FAP |  |
| ∗Top 15 enriched GO BP terms are showed in the bar plot of each disease state in each tissue. Each row represents a significant GO biological process which is colored according to the -log10(p.adjust). |
| Page: 1 2 3 4 5 6 7 8 9 |
| GO ID | Tissue | Disease Stage | Description | Gene Ratio | Bg Ratio | pvalue | p.adjust | Count |
| GO:00066433 | Esophagus | ESCC | membrane lipid metabolic process | 130/8552 | 203/18723 | 9.29e-08 | 1.54e-06 | 130 |
| GO:00464673 | Esophagus | ESCC | membrane lipid biosynthetic process | 91/8552 | 142/18723 | 7.19e-06 | 7.19e-05 | 91 |
| GO:00066652 | Esophagus | ESCC | sphingolipid metabolic process | 96/8552 | 155/18723 | 3.21e-05 | 2.66e-04 | 96 |
| GO:00301481 | Esophagus | ESCC | sphingolipid biosynthetic process | 62/8552 | 103/18723 | 2.10e-03 | 9.38e-03 | 62 |
| GO:00066721 | Esophagus | ESCC | ceramide metabolic process | 61/8552 | 102/18723 | 2.82e-03 | 1.19e-02 | 61 |
| GO:0046513 | Esophagus | ESCC | ceramide biosynthetic process | 40/8552 | 65/18723 | 7.25e-03 | 2.63e-02 | 40 |
| GO:00066431 | Liver | HCC | membrane lipid metabolic process | 115/7958 | 203/18723 | 3.17e-05 | 3.22e-04 | 115 |
| GO:0006665 | Liver | HCC | sphingolipid metabolic process | 85/7958 | 155/18723 | 1.27e-03 | 6.92e-03 | 85 |
| GO:0046467 | Liver | HCC | membrane lipid biosynthetic process | 78/7958 | 142/18723 | 1.85e-03 | 9.46e-03 | 78 |
| GO:00066432 | Oral cavity | OSCC | membrane lipid metabolic process | 111/7305 | 203/18723 | 4.02e-06 | 4.69e-05 | 111 |
| GO:00066651 | Oral cavity | OSCC | sphingolipid metabolic process | 84/7305 | 155/18723 | 8.64e-05 | 6.61e-04 | 84 |
| GO:00464672 | Oral cavity | OSCC | membrane lipid biosynthetic process | 77/7305 | 142/18723 | 1.63e-04 | 1.13e-03 | 77 |
| GO:0006672 | Oral cavity | OSCC | ceramide metabolic process | 53/7305 | 102/18723 | 5.28e-03 | 2.06e-02 | 53 |
| GO:0030148 | Oral cavity | OSCC | sphingolipid biosynthetic process | 53/7305 | 103/18723 | 6.81e-03 | 2.53e-02 | 53 |
| GO:000664311 | Oral cavity | LP | membrane lipid metabolic process | 69/4623 | 203/18723 | 1.77e-03 | 1.34e-02 | 69 |
| GO:00464671 | Oral cavity | LP | membrane lipid biosynthetic process | 49/4623 | 142/18723 | 5.44e-03 | 3.31e-02 | 49 |
| Page: 1 |
| Pathway ID | Tissue | Disease Stage | Description | Gene Ratio | Bg Ratio | pvalue | p.adjust | qvalue | Count |
| hsa0407116 | Esophagus | ESCC | Sphingolipid signaling pathway | 85/4205 | 121/8465 | 3.04e-06 | 1.73e-05 | 8.84e-06 | 85 |
| hsa006003 | Esophagus | ESCC | Sphingolipid metabolism | 36/4205 | 53/8465 | 5.41e-03 | 1.36e-02 | 6.99e-03 | 36 |
| hsa0407117 | Esophagus | ESCC | Sphingolipid signaling pathway | 85/4205 | 121/8465 | 3.04e-06 | 1.73e-05 | 8.84e-06 | 85 |
| hsa0060012 | Esophagus | ESCC | Sphingolipid metabolism | 36/4205 | 53/8465 | 5.41e-03 | 1.36e-02 | 6.99e-03 | 36 |
| hsa040718 | Liver | HCC | Sphingolipid signaling pathway | 72/4020 | 121/8465 | 5.01e-03 | 1.47e-02 | 8.18e-03 | 72 |
| hsa00600 | Liver | HCC | Sphingolipid metabolism | 34/4020 | 53/8465 | 1.06e-02 | 2.71e-02 | 1.51e-02 | 34 |
| hsa0407111 | Liver | HCC | Sphingolipid signaling pathway | 72/4020 | 121/8465 | 5.01e-03 | 1.47e-02 | 8.18e-03 | 72 |
| hsa006001 | Liver | HCC | Sphingolipid metabolism | 34/4020 | 53/8465 | 1.06e-02 | 2.71e-02 | 1.51e-02 | 34 |
| hsa0407114 | Oral cavity | OSCC | Sphingolipid signaling pathway | 82/3704 | 121/8465 | 6.97e-08 | 5.08e-07 | 2.58e-07 | 82 |
| hsa006002 | Oral cavity | OSCC | Sphingolipid metabolism | 33/3704 | 53/8465 | 5.00e-03 | 1.20e-02 | 6.13e-03 | 33 |
| hsa0407115 | Oral cavity | OSCC | Sphingolipid signaling pathway | 82/3704 | 121/8465 | 6.97e-08 | 5.08e-07 | 2.58e-07 | 82 |
| hsa0060011 | Oral cavity | OSCC | Sphingolipid metabolism | 33/3704 | 53/8465 | 5.00e-03 | 1.20e-02 | 6.13e-03 | 33 |
| hsa0407122 | Oral cavity | LP | Sphingolipid signaling pathway | 48/2418 | 121/8465 | 5.30e-03 | 2.15e-02 | 1.39e-02 | 48 |
| hsa0407132 | Oral cavity | LP | Sphingolipid signaling pathway | 48/2418 | 121/8465 | 5.30e-03 | 2.15e-02 | 1.39e-02 | 48 |
| Page: 1 |
Top |
Cell-cell communication analysis |
| Identification of potential cell-cell interactions between two cell types and their ligand-receptor pairs for different disease states |
| Ligand | Receptor | LRpair | Pathway | Tissue | Disease Stage |
| Page: 1 |
Top |
Single-cell gene regulatory network inference analysis |
| Find out the significant the regulons (TFs) and the target genes of each regulon across cell types for different disease states |
| TF | Cell Type | Tissue | Disease Stage | Target Gene | RSS | Regulon Activity |
| CERS4 | ACINAR | Pancreas | ADJ | RBPJL,REG1B,FGFR1, etc. | 3.33e-01 |  |
| ∗The dot plots of a searched regulon are shown for all cell subpopulations in each disease state of each tissue based on the regulon specific score inferred using pySCENIC and by calculating the average expression. |
| Page: 1 |
Top |
Somatic mutation of malignant transformation related genes |
| Annotation of somatic variants for genes involved in malignant transformation |
| Hugo Symbol | Variant Class | Variant Classification | dbSNP RS | HGVSc | HGVSp | HGVSp Short | SWISSPROT | BIOTYPE | SIFT | PolyPhen | Tumor Sample Barcode | Tissue | Histology | Sex | Age | Stage | Therapy Types | Drugs | Outcome |
| CERS4 | SNV | Missense_Mutation | rs781132558 | c.157C>T | p.Arg53Cys | p.R53C | Q9HA82 | protein_coding | deleterious(0) | probably_damaging(1) | TCGA-A8-A07W-01 | Breast | breast invasive carcinoma | Female | >=65 | III/IV | Hormone Therapy | exemestane | SD |
| CERS4 | SNV | Missense_Mutation | rs777818786 | c.688N>T | p.Arg230Cys | p.R230C | Q9HA82 | protein_coding | deleterious(0) | probably_damaging(0.992) | TCGA-BH-A0B6-01 | Breast | breast invasive carcinoma | Female | <65 | I/II | Unknown | Unknown | SD |
| CERS4 | insertion | Nonsense_Mutation | novel | c.2_3insACCCACCTTGGCCTTCTAAAGTGCTGGGATTACAGGCGTGAGCAACTGC | p.Met1? | p.M1? | Q9HA82 | protein_coding | TCGA-B6-A0IK-01 | Breast | breast invasive carcinoma | Female | <65 | III/IV | Unknown | Unknown | PD | ||
| CERS4 | SNV | Missense_Mutation | rs377204315 | c.1061N>T | p.Ala354Val | p.A354V | Q9HA82 | protein_coding | tolerated(0.24) | benign(0.001) | TCGA-2W-A8YY-01 | Cervix | cervical & endocervical cancer | Female | <65 | I/II | Chemotherapy | cisplatin | CR |
| CERS4 | insertion | Frame_Shift_Ins | novel | c.104_105insC | p.Gln37ProfsTer21 | p.Q37Pfs*21 | Q9HA82 | protein_coding | TCGA-VS-A9U6-01 | Cervix | cervical & endocervical cancer | Female | <65 | I/II | Chemotherapy | cisplatin | PD | ||
| CERS4 | SNV | Missense_Mutation | rs200803317 | c.92N>A | p.Arg31His | p.R31H | Q9HA82 | protein_coding | tolerated(0.22) | benign(0.071) | TCGA-A6-6650-01 | Colorectum | colon adenocarcinoma | Female | >=65 | I/II | Unknown | Unknown | SD |
| CERS4 | SNV | Missense_Mutation | rs775538437 | c.973N>T | p.Arg325Cys | p.R325C | Q9HA82 | protein_coding | deleterious(0.04) | benign(0.133) | TCGA-AA-A02R-01 | Colorectum | colon adenocarcinoma | Female | >=65 | I/II | Unknown | Unknown | PD |
| CERS4 | SNV | Missense_Mutation | novel | c.1021N>T | p.Arg341Cys | p.R341C | Q9HA82 | protein_coding | deleterious(0) | probably_damaging(1) | TCGA-AZ-4315-01 | Colorectum | colon adenocarcinoma | Male | <65 | I/II | Unknown | Unknown | SD |
| CERS4 | SNV | Missense_Mutation | c.227N>T | p.Arg76Met | p.R76M | Q9HA82 | protein_coding | tolerated(0.28) | benign(0.113) | TCGA-CM-6162-01 | Colorectum | colon adenocarcinoma | Female | <65 | III/IV | Chemotherapy | oxaliplatin | SD | |
| CERS4 | SNV | Missense_Mutation | novel | c.952N>G | p.Phe318Val | p.F318V | Q9HA82 | protein_coding | deleterious(0) | probably_damaging(0.957) | TCGA-AP-A1DV-01 | Endometrium | uterine corpus endometrioid carcinoma | Female | <65 | I/II | Unknown | Unknown | SD |
| Page: 1 2 3 4 |
Top |
Related drugs of malignant transformation related genes |
| Identification of chemicals and drugs interact with genes involved in malignant transfromation |
| (DGIdb 4.0) |
| Entrez ID | Symbol | Category | Interaction Types | Drug Claim Name | Drug Name | PMIDs |
| Page: 1 |

Copyright 2023-Present -The University of Texas Health Science Center at Houston |