
|
|||||
|
 | |
| |
| |
| |
| |
| |
|
Gene: CERS3 |
Gene summary for CERS3 |
| Gene information | Species | Human | Gene symbol | CERS3 | Gene ID | 204219 |
| Gene name | ceramide synthase 3 | |
| Gene Alias | ARCI9 | |
| Cytomap | 15q26.3 | |
| Gene Type | protein-coding | GO ID | GO:0006629 | UniProtAcc | Q8IU89 |
Top |
Malignant transformation analysis |
| Identification of the aberrant gene expression in precancerous and cancerous lesions by comparing the gene expression of stem-like cells in diseased tissues with normal stem cells |
| Entrez ID | Symbol | Replicates | Species | Organ | Tissue | Adj P-value | Log2FC | Malignancy |
| 204219 | CERS3 | CCI_1 | Human | Cervix | CC | 2.84e-12 | 9.68e-01 | 0.528 |
| 204219 | CERS3 | CCI_2 | Human | Cervix | CC | 7.76e-05 | 5.69e-01 | 0.5249 |
| 204219 | CERS3 | Tumor | Human | Cervix | CC | 8.19e-03 | 2.02e-01 | 0.1241 |
| 204219 | CERS3 | sample3 | Human | Cervix | CC | 2.45e-08 | 2.39e-01 | 0.1387 |
| 204219 | CERS3 | T3 | Human | Cervix | CC | 6.69e-05 | 2.66e-01 | 0.1389 |
| 204219 | CERS3 | LZE2T | Human | Esophagus | ESCC | 4.79e-03 | 4.54e-01 | 0.082 |
| 204219 | CERS3 | LZE4T | Human | Esophagus | ESCC | 3.77e-12 | 3.15e-01 | 0.0811 |
| 204219 | CERS3 | LZE20T | Human | Esophagus | ESCC | 1.51e-02 | 1.94e-01 | 0.0662 |
| 204219 | CERS3 | LZE21T | Human | Esophagus | ESCC | 1.43e-02 | 1.69e-01 | 0.0655 |
| 204219 | CERS3 | P1T-E | Human | Esophagus | ESCC | 3.66e-04 | 4.62e-01 | 0.0875 |
| 204219 | CERS3 | P2T-E | Human | Esophagus | ESCC | 1.02e-04 | 1.72e-01 | 0.1177 |
| 204219 | CERS3 | P4T-E | Human | Esophagus | ESCC | 7.41e-32 | 8.61e-01 | 0.1323 |
| 204219 | CERS3 | P5T-E | Human | Esophagus | ESCC | 7.31e-13 | 3.69e-01 | 0.1327 |
| 204219 | CERS3 | P9T-E | Human | Esophagus | ESCC | 4.00e-16 | 4.79e-01 | 0.1131 |
| 204219 | CERS3 | P10T-E | Human | Esophagus | ESCC | 1.95e-18 | 4.21e-01 | 0.116 |
| 204219 | CERS3 | P11T-E | Human | Esophagus | ESCC | 9.93e-04 | 2.81e-01 | 0.1426 |
| 204219 | CERS3 | P12T-E | Human | Esophagus | ESCC | 7.76e-40 | 8.79e-01 | 0.1122 |
| 204219 | CERS3 | P15T-E | Human | Esophagus | ESCC | 3.33e-27 | 5.50e-01 | 0.1149 |
| 204219 | CERS3 | P16T-E | Human | Esophagus | ESCC | 2.49e-20 | 4.73e-01 | 0.1153 |
| 204219 | CERS3 | P20T-E | Human | Esophagus | ESCC | 4.42e-30 | 7.56e-01 | 0.1124 |
| Page: 1 2 3 4 |
| Tissue | Expression Dynamics | Abbreviation |
| Cervix | 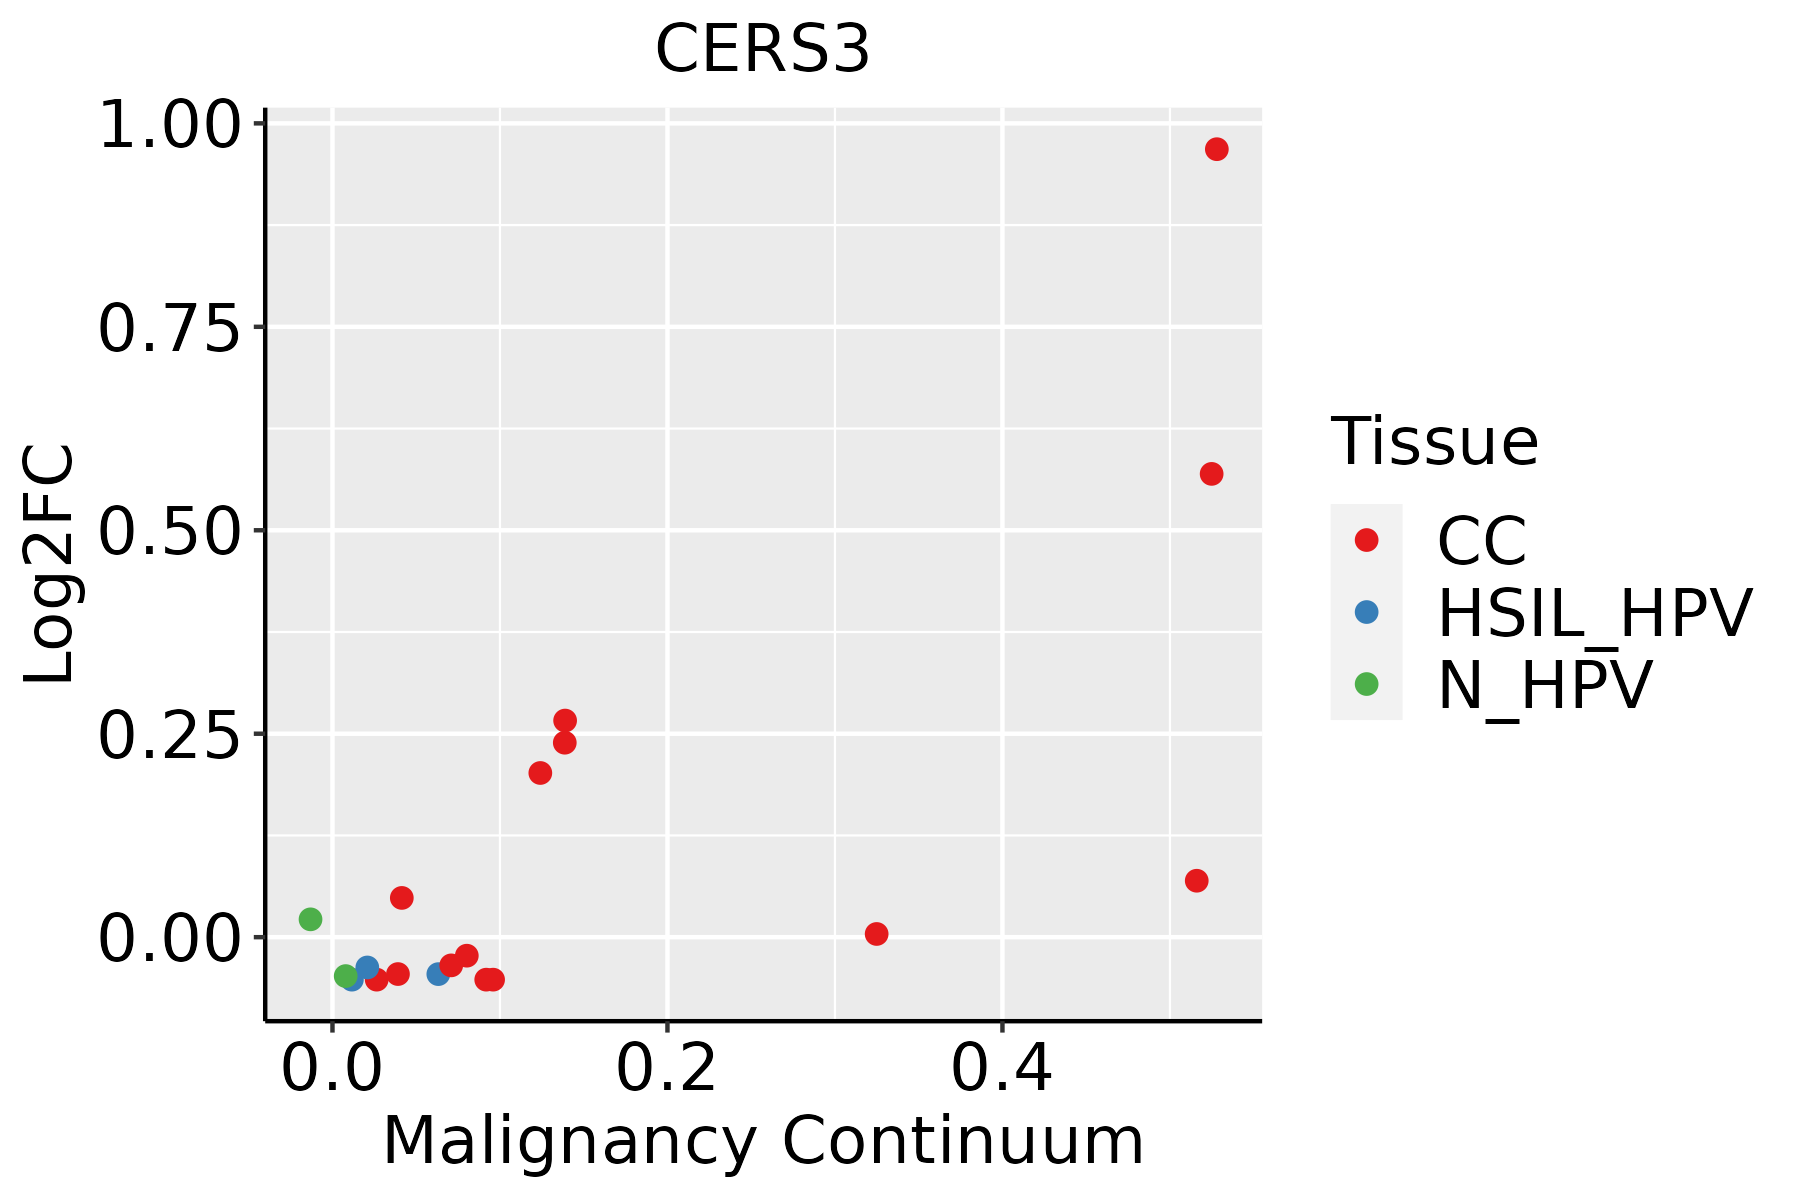 | CC: Cervix cancer |
| HSIL_HPV: HPV-infected high-grade squamous intraepithelial lesions | ||
| N_HPV: HPV-infected normal cervix | ||
| Esophagus | 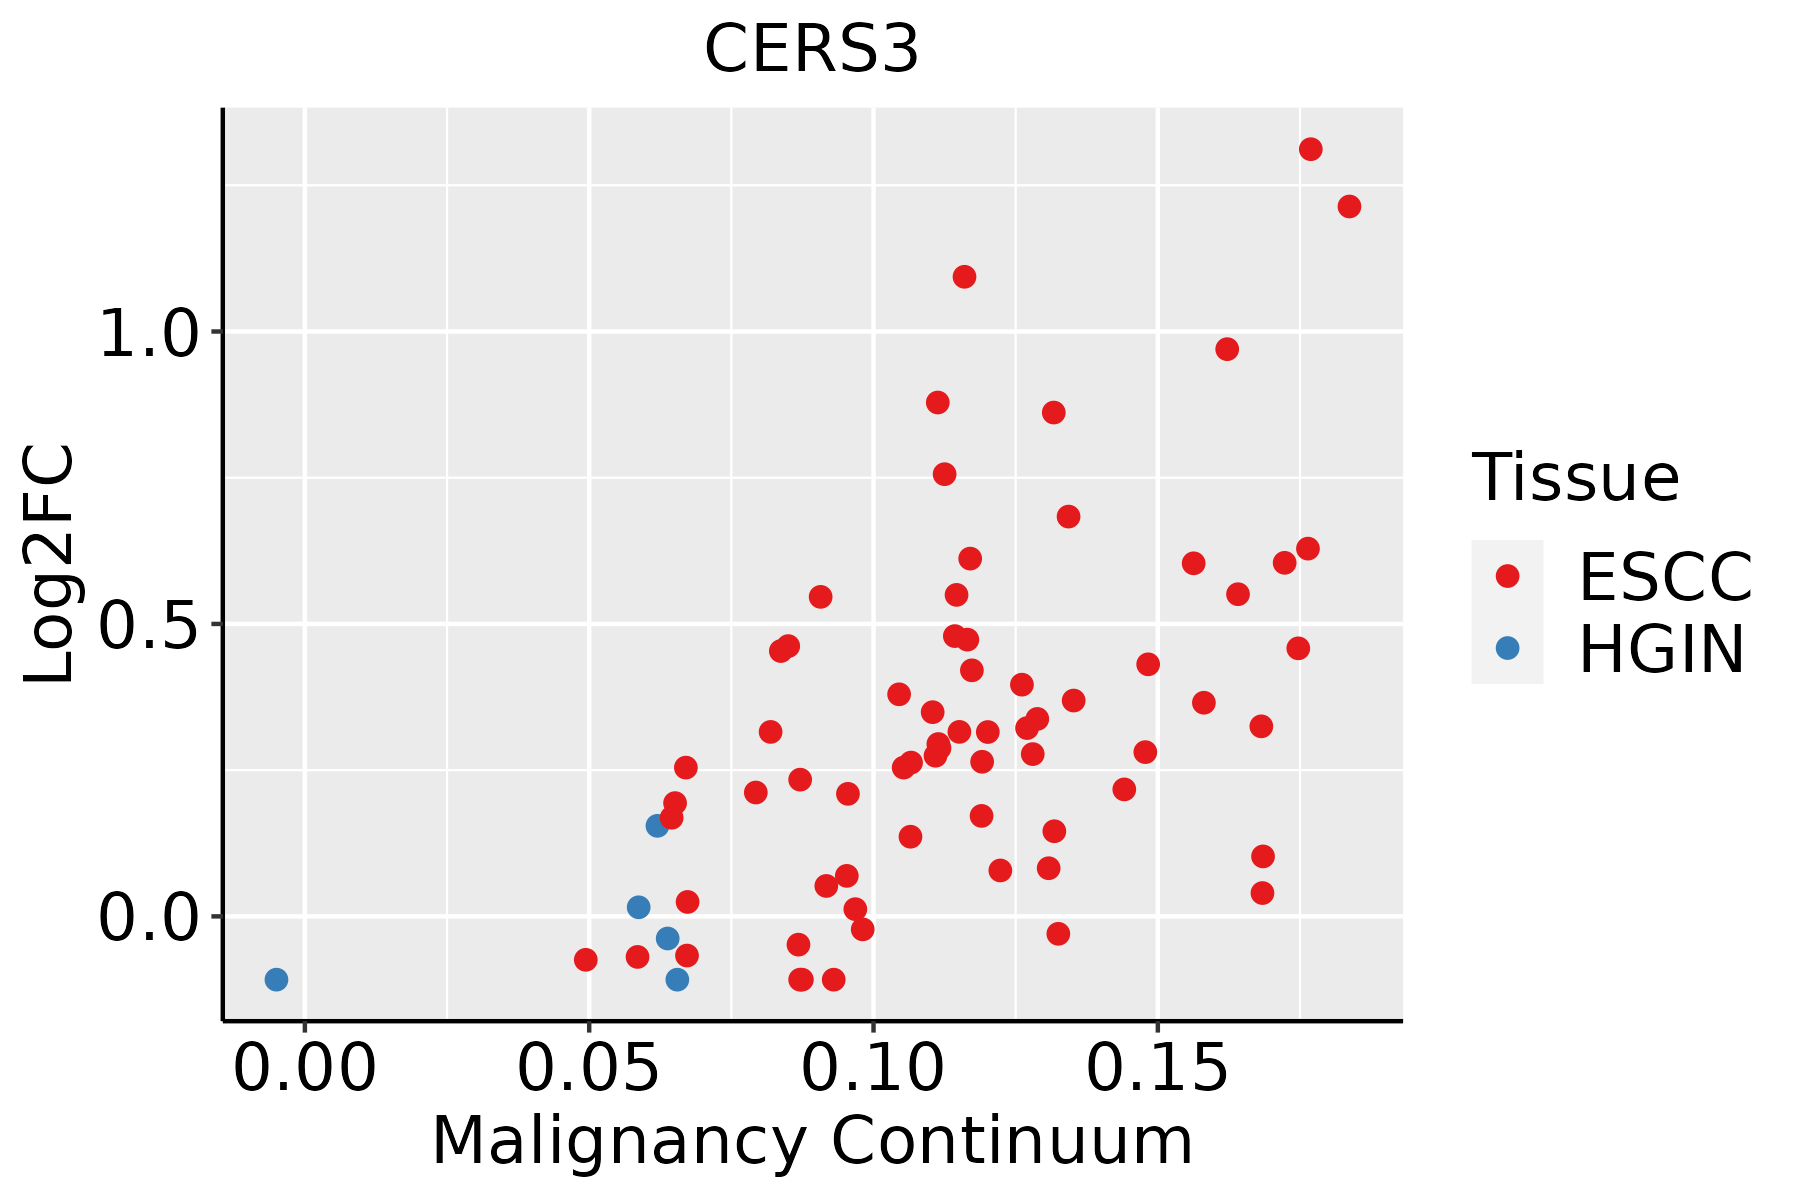 | ESCC: Esophageal squamous cell carcinoma |
| HGIN: High-grade intraepithelial neoplasias | ||
| LGIN: Low-grade intraepithelial neoplasias | ||
| Oral Cavity | 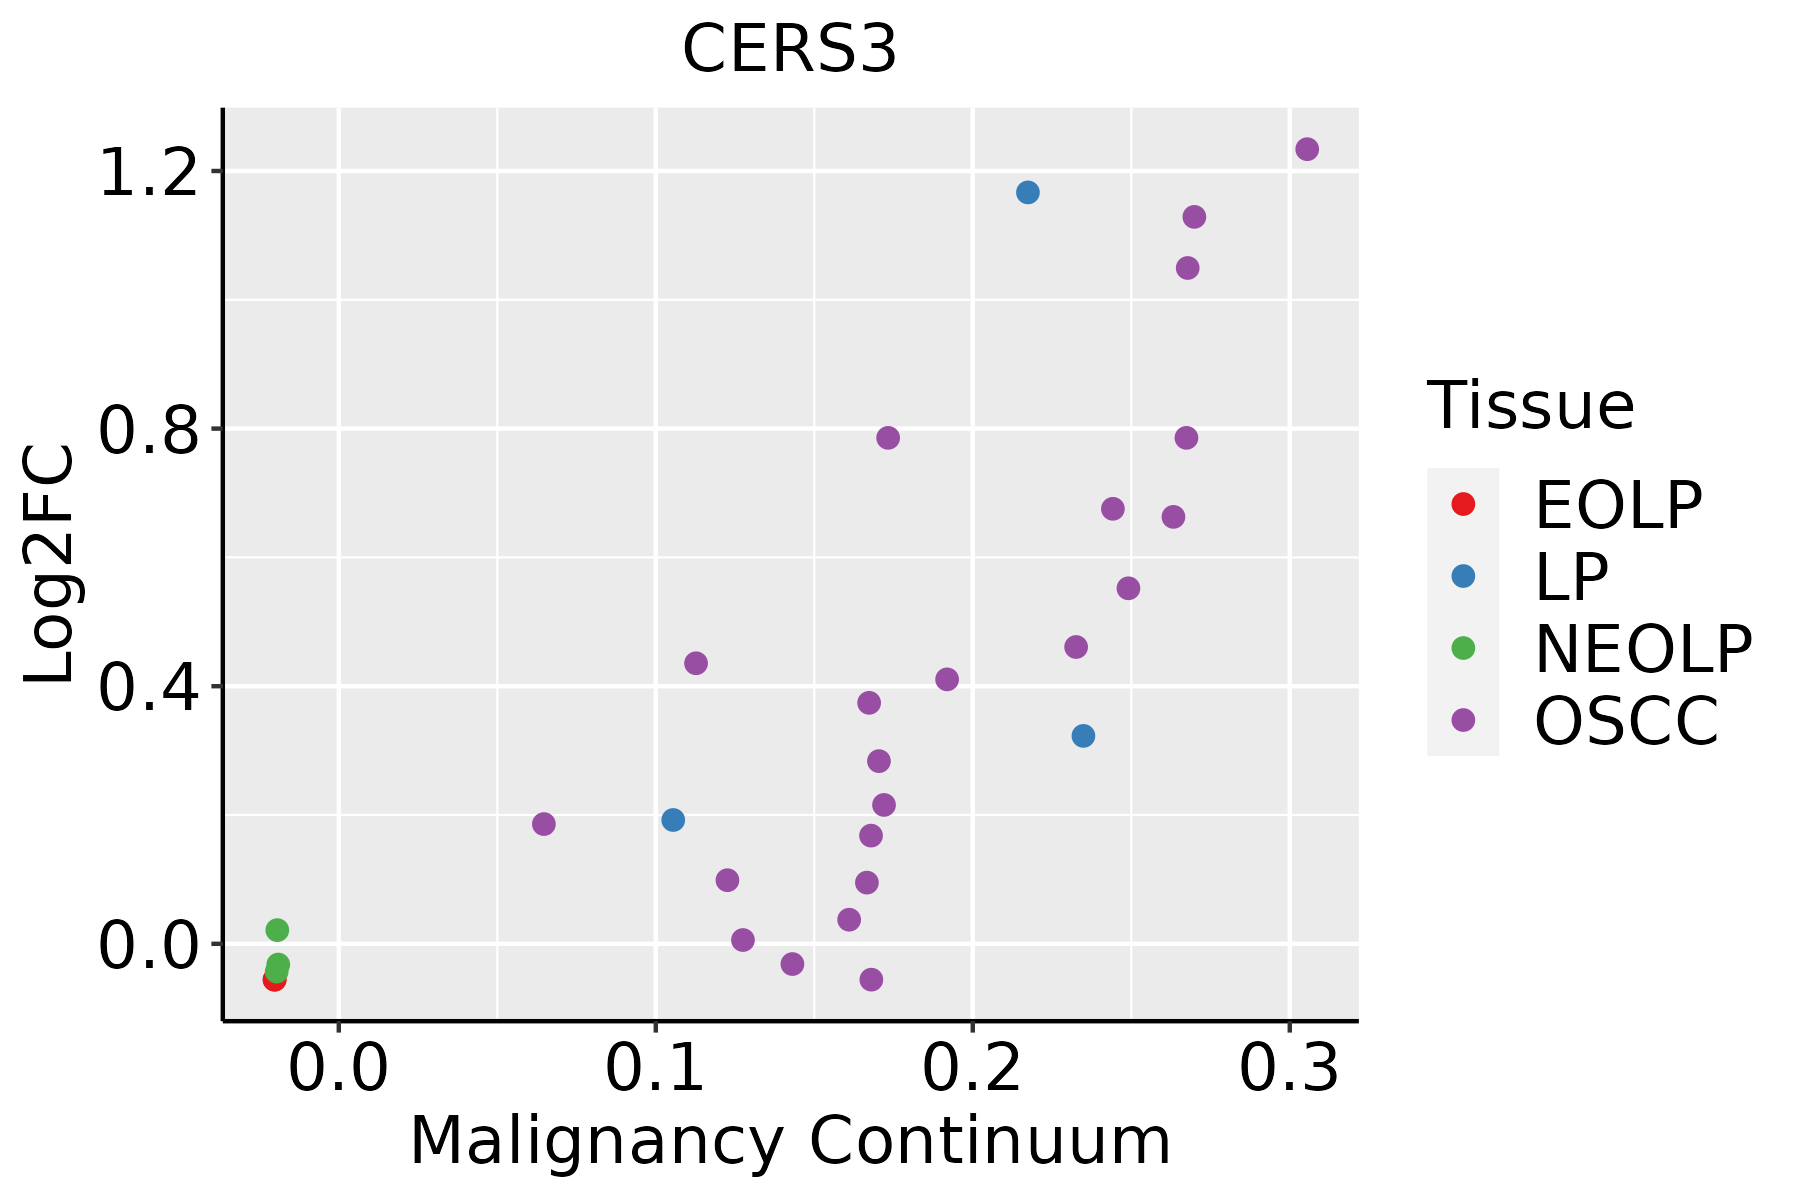 | EOLP: Erosive Oral lichen planus |
| LP: leukoplakia | ||
| NEOLP: Non-erosive oral lichen planus | ||
| OSCC: Oral squamous cell carcinoma | ||
| Skin |  | AK: Actinic keratosis |
| cSCC: Cutaneous squamous cell carcinoma | ||
| SCCIS:squamous cell carcinoma in situ |
| ∗log2FC in expression of this searched gene in stem-like cells from each diseased tissue sample relative to stem-like cells in normal samples in each tissue plotted against the malignancy continuum. Samples are colored based on if they are from different disease stage. |
Top |
Malignant transformation related pathway analysis |
| Find out the enriched GO biological processes and KEGG pathways involved in transition from healthy to precancer to cancer |
| Tissue | Disease Stage | Enriched GO biological Processes |
| Colorectum | AD |  |
| Colorectum | SER |  |
| Colorectum | MSS |  |
| Colorectum | MSI-H |  |
| Colorectum | FAP |  |
| ∗Top 15 enriched GO BP terms are showed in the bar plot of each disease state in each tissue. Each row represents a significant GO biological process which is colored according to the -log10(p.adjust). |
| Page: 1 2 3 4 5 6 7 8 9 |
| GO ID | Tissue | Disease Stage | Description | Gene Ratio | Bg Ratio | pvalue | p.adjust | Count |
| GO:00085446 | Cervix | CC | epidermis development | 83/2311 | 324/18723 | 3.91e-11 | 8.54e-09 | 83 |
| GO:00435884 | Cervix | CC | skin development | 71/2311 | 263/18723 | 8.04e-11 | 1.46e-08 | 71 |
| GO:00302164 | Cervix | CC | keratinocyte differentiation | 42/2311 | 139/18723 | 1.74e-08 | 1.28e-06 | 42 |
| GO:00099137 | Cervix | CC | epidermal cell differentiation | 53/2311 | 202/18723 | 5.48e-08 | 3.25e-06 | 53 |
| GO:00435888 | Esophagus | ESCC | skin development | 163/8552 | 263/18723 | 6.48e-08 | 1.14e-06 | 163 |
| GO:00066433 | Esophagus | ESCC | membrane lipid metabolic process | 130/8552 | 203/18723 | 9.29e-08 | 1.54e-06 | 130 |
| GO:000854410 | Esophagus | ESCC | epidermis development | 193/8552 | 324/18723 | 2.87e-07 | 4.19e-06 | 193 |
| GO:00464673 | Esophagus | ESCC | membrane lipid biosynthetic process | 91/8552 | 142/18723 | 7.19e-06 | 7.19e-05 | 91 |
| GO:000991310 | Esophagus | ESCC | epidermal cell differentiation | 122/8552 | 202/18723 | 1.69e-05 | 1.51e-04 | 122 |
| GO:00066652 | Esophagus | ESCC | sphingolipid metabolic process | 96/8552 | 155/18723 | 3.21e-05 | 2.66e-04 | 96 |
| GO:00302167 | Esophagus | ESCC | keratinocyte differentiation | 86/8552 | 139/18723 | 8.53e-05 | 6.19e-04 | 86 |
| GO:00301481 | Esophagus | ESCC | sphingolipid biosynthetic process | 62/8552 | 103/18723 | 2.10e-03 | 9.38e-03 | 62 |
| GO:00066721 | Esophagus | ESCC | ceramide metabolic process | 61/8552 | 102/18723 | 2.82e-03 | 1.19e-02 | 61 |
| GO:0046513 | Esophagus | ESCC | ceramide biosynthetic process | 40/8552 | 65/18723 | 7.25e-03 | 2.63e-02 | 40 |
| GO:00435887 | Oral cavity | OSCC | skin development | 143/7305 | 263/18723 | 2.77e-07 | 4.27e-06 | 143 |
| GO:00085449 | Oral cavity | OSCC | epidermis development | 171/7305 | 324/18723 | 2.89e-07 | 4.43e-06 | 171 |
| GO:00302166 | Oral cavity | OSCC | keratinocyte differentiation | 81/7305 | 139/18723 | 3.16e-06 | 3.81e-05 | 81 |
| GO:00066432 | Oral cavity | OSCC | membrane lipid metabolic process | 111/7305 | 203/18723 | 4.02e-06 | 4.69e-05 | 111 |
| GO:00099139 | Oral cavity | OSCC | epidermal cell differentiation | 109/7305 | 202/18723 | 1.08e-05 | 1.14e-04 | 109 |
| GO:00066651 | Oral cavity | OSCC | sphingolipid metabolic process | 84/7305 | 155/18723 | 8.64e-05 | 6.61e-04 | 84 |
| Page: 1 2 |
| Pathway ID | Tissue | Disease Stage | Description | Gene Ratio | Bg Ratio | pvalue | p.adjust | qvalue | Count |
| hsa0407110 | Cervix | CC | Sphingolipid signaling pathway | 35/1267 | 121/8465 | 5.70e-05 | 3.93e-04 | 2.32e-04 | 35 |
| hsa0407113 | Cervix | CC | Sphingolipid signaling pathway | 35/1267 | 121/8465 | 5.70e-05 | 3.93e-04 | 2.32e-04 | 35 |
| hsa0407116 | Esophagus | ESCC | Sphingolipid signaling pathway | 85/4205 | 121/8465 | 3.04e-06 | 1.73e-05 | 8.84e-06 | 85 |
| hsa0407117 | Esophagus | ESCC | Sphingolipid signaling pathway | 85/4205 | 121/8465 | 3.04e-06 | 1.73e-05 | 8.84e-06 | 85 |
| hsa0407114 | Oral cavity | OSCC | Sphingolipid signaling pathway | 82/3704 | 121/8465 | 6.97e-08 | 5.08e-07 | 2.58e-07 | 82 |
| hsa006002 | Oral cavity | OSCC | Sphingolipid metabolism | 33/3704 | 53/8465 | 5.00e-03 | 1.20e-02 | 6.13e-03 | 33 |
| hsa0407115 | Oral cavity | OSCC | Sphingolipid signaling pathway | 82/3704 | 121/8465 | 6.97e-08 | 5.08e-07 | 2.58e-07 | 82 |
| hsa0060011 | Oral cavity | OSCC | Sphingolipid metabolism | 33/3704 | 53/8465 | 5.00e-03 | 1.20e-02 | 6.13e-03 | 33 |
| hsa0407122 | Oral cavity | LP | Sphingolipid signaling pathway | 48/2418 | 121/8465 | 5.30e-03 | 2.15e-02 | 1.39e-02 | 48 |
| hsa0407132 | Oral cavity | LP | Sphingolipid signaling pathway | 48/2418 | 121/8465 | 5.30e-03 | 2.15e-02 | 1.39e-02 | 48 |
| Page: 1 |
Top |
Cell-cell communication analysis |
| Identification of potential cell-cell interactions between two cell types and their ligand-receptor pairs for different disease states |
| Ligand | Receptor | LRpair | Pathway | Tissue | Disease Stage |
| Page: 1 |
Top |
Single-cell gene regulatory network inference analysis |
| Find out the significant the regulons (TFs) and the target genes of each regulon across cell types for different disease states |
| TF | Cell Type | Tissue | Disease Stage | Target Gene | RSS | Regulon Activity |
| ∗The dot plots of a searched regulon are shown for all cell subpopulations in each disease state of each tissue based on the regulon specific score inferred using pySCENIC and by calculating the average expression. |
| Page: 1 |
Top |
Somatic mutation of malignant transformation related genes |
| Annotation of somatic variants for genes involved in malignant transformation |
| Hugo Symbol | Variant Class | Variant Classification | dbSNP RS | HGVSc | HGVSp | HGVSp Short | SWISSPROT | BIOTYPE | SIFT | PolyPhen | Tumor Sample Barcode | Tissue | Histology | Sex | Age | Stage | Therapy Types | Drugs | Outcome |
| CERS3 | SNV | Missense_Mutation | rs138661052 | c.326N>T | p.Thr109Met | p.T109M | Q8IU89 | protein_coding | deleterious(0) | probably_damaging(0.978) | TCGA-A8-A09Q-01 | Breast | breast invasive carcinoma | Female | >=65 | III/IV | Hormone Therapy | anastrozole | SD |
| CERS3 | SNV | Missense_Mutation | novel | c.996N>A | p.Met332Ile | p.M332I | Q8IU89 | protein_coding | tolerated(0.21) | benign(0.003) | TCGA-E2-A1IN-01 | Breast | breast invasive carcinoma | Female | <65 | I/II | Hormone Therapy | arimidex | SD |
| CERS3 | SNV | Missense_Mutation | c.1088N>G | p.Asp363Gly | p.D363G | Q8IU89 | protein_coding | tolerated(0.37) | benign(0.102) | TCGA-FU-A770-01 | Cervix | cervical & endocervical cancer | Female | <65 | III/IV | Unknown | Unknown | SD | |
| CERS3 | SNV | Missense_Mutation | c.19N>C | p.Glu7Gln | p.E7Q | Q8IU89 | protein_coding | tolerated(0.13) | benign(0.058) | TCGA-JW-A5VL-01 | Cervix | cervical & endocervical cancer | Female | <65 | I/II | Unknown | Unknown | SD | |
| CERS3 | SNV | Missense_Mutation | c.988A>G | p.Ile330Val | p.I330V | Q8IU89 | protein_coding | tolerated(0.27) | benign(0.003) | TCGA-AA-3510-01 | Colorectum | colon adenocarcinoma | Male | >=65 | I/II | Unknown | Unknown | SD | |
| CERS3 | SNV | Missense_Mutation | rs138661052 | c.326N>T | p.Thr109Met | p.T109M | Q8IU89 | protein_coding | deleterious(0) | probably_damaging(0.978) | TCGA-AA-3664-01 | Colorectum | colon adenocarcinoma | Female | >=65 | I/II | Unknown | Unknown | SD |
| CERS3 | SNV | Missense_Mutation | c.323T>C | p.Leu108Ser | p.L108S | Q8IU89 | protein_coding | tolerated(0.08) | benign(0.265) | TCGA-AA-3672-01 | Colorectum | colon adenocarcinoma | Female | >=65 | III/IV | Unknown | Unknown | SD | |
| CERS3 | SNV | Missense_Mutation | c.877N>C | p.Tyr293His | p.Y293H | Q8IU89 | protein_coding | tolerated(0.63) | benign(0.003) | TCGA-AA-3710-01 | Colorectum | colon adenocarcinoma | Female | >=65 | I/II | Unknown | Unknown | SD | |
| CERS3 | SNV | Missense_Mutation | rs752230253 | c.686G>A | p.Arg229His | p.R229H | Q8IU89 | protein_coding | deleterious(0) | probably_damaging(0.999) | TCGA-AA-3977-01 | Colorectum | colon adenocarcinoma | Male | >=65 | I/II | Unknown | Unknown | SD |
| CERS3 | SNV | Missense_Mutation | c.736G>A | p.Glu246Lys | p.E246K | Q8IU89 | protein_coding | deleterious(0) | probably_damaging(0.998) | TCGA-AA-A010-01 | Colorectum | colon adenocarcinoma | Female | <65 | I/II | Chemotherapy | folinic | CR |
| Page: 1 2 3 4 5 6 7 |
Top |
Related drugs of malignant transformation related genes |
| Identification of chemicals and drugs interact with genes involved in malignant transfromation |
| (DGIdb 4.0) |
| Entrez ID | Symbol | Category | Interaction Types | Drug Claim Name | Drug Name | PMIDs |
| Page: 1 |

Copyright 2023-Present -The University of Texas Health Science Center at Houston |