
|
|||||
|
 | |
| |
| |
| |
| |
| |
|
Gene: CERK |
Gene summary for CERK |
| Gene information | Species | Human | Gene symbol | CERK | Gene ID | 64781 |
| Gene name | ceramide kinase | |
| Gene Alias | LK4 | |
| Cytomap | 22q13.31 | |
| Gene Type | protein-coding | GO ID | GO:0006629 | UniProtAcc | A0A024R4U8 |
Top |
Malignant transformation analysis |
| Identification of the aberrant gene expression in precancerous and cancerous lesions by comparing the gene expression of stem-like cells in diseased tissues with normal stem cells |
| Entrez ID | Symbol | Replicates | Species | Organ | Tissue | Adj P-value | Log2FC | Malignancy |
| 64781 | CERK | HTA11_347_2000001011 | Human | Colorectum | AD | 3.05e-11 | 5.15e-01 | -0.1954 |
| 64781 | CERK | HTA11_99999970781_79442 | Human | Colorectum | MSS | 7.87e-05 | -2.08e-01 | 0.294 |
| 64781 | CERK | HTA11_99999971662_82457 | Human | Colorectum | MSS | 4.32e-07 | 4.04e-01 | 0.3859 |
| 64781 | CERK | F007 | Human | Colorectum | FAP | 4.03e-03 | -2.25e-01 | 0.1176 |
| 64781 | CERK | A002-C-010 | Human | Colorectum | FAP | 2.28e-03 | -2.08e-01 | 0.242 |
| 64781 | CERK | A015-C-203 | Human | Colorectum | FAP | 1.43e-03 | -1.09e-01 | -0.1294 |
| 64781 | CERK | A002-C-203 | Human | Colorectum | FAP | 9.48e-03 | -1.63e-01 | 0.2786 |
| 64781 | CERK | A002-C-205 | Human | Colorectum | FAP | 1.42e-03 | -1.55e-01 | -0.1236 |
| 64781 | CERK | A015-C-005 | Human | Colorectum | FAP | 1.07e-03 | -2.13e-01 | -0.0336 |
| 64781 | CERK | A015-C-006 | Human | Colorectum | FAP | 1.38e-04 | -2.25e-01 | -0.0994 |
| 64781 | CERK | A015-C-106 | Human | Colorectum | FAP | 7.00e-03 | -1.57e-01 | -0.0511 |
| 64781 | CERK | A002-C-114 | Human | Colorectum | FAP | 3.39e-04 | -2.07e-01 | -0.1561 |
| 64781 | CERK | A015-C-104 | Human | Colorectum | FAP | 1.51e-04 | -1.45e-01 | -0.1899 |
| 64781 | CERK | A002-C-016 | Human | Colorectum | FAP | 8.35e-05 | -1.87e-01 | 0.0521 |
| 64781 | CERK | A002-C-116 | Human | Colorectum | FAP | 4.50e-06 | -1.82e-01 | -0.0452 |
| 64781 | CERK | A014-C-008 | Human | Colorectum | FAP | 4.67e-02 | -2.05e-01 | -0.191 |
| 64781 | CERK | A018-E-020 | Human | Colorectum | FAP | 1.11e-02 | -1.45e-01 | -0.2034 |
| 64781 | CERK | F034 | Human | Colorectum | FAP | 9.10e-06 | -1.93e-01 | -0.0665 |
| 64781 | CERK | LZE7T | Human | Esophagus | ESCC | 1.06e-06 | 2.68e-01 | 0.0667 |
| 64781 | CERK | LZE24T | Human | Esophagus | ESCC | 6.00e-06 | 6.44e-02 | 0.0596 |
| Page: 1 2 3 4 |
| Tissue | Expression Dynamics | Abbreviation |
| Colorectum (GSE201348) |  | FAP: Familial adenomatous polyposis |
| CRC: Colorectal cancer | ||
| Colorectum (HTA11) | 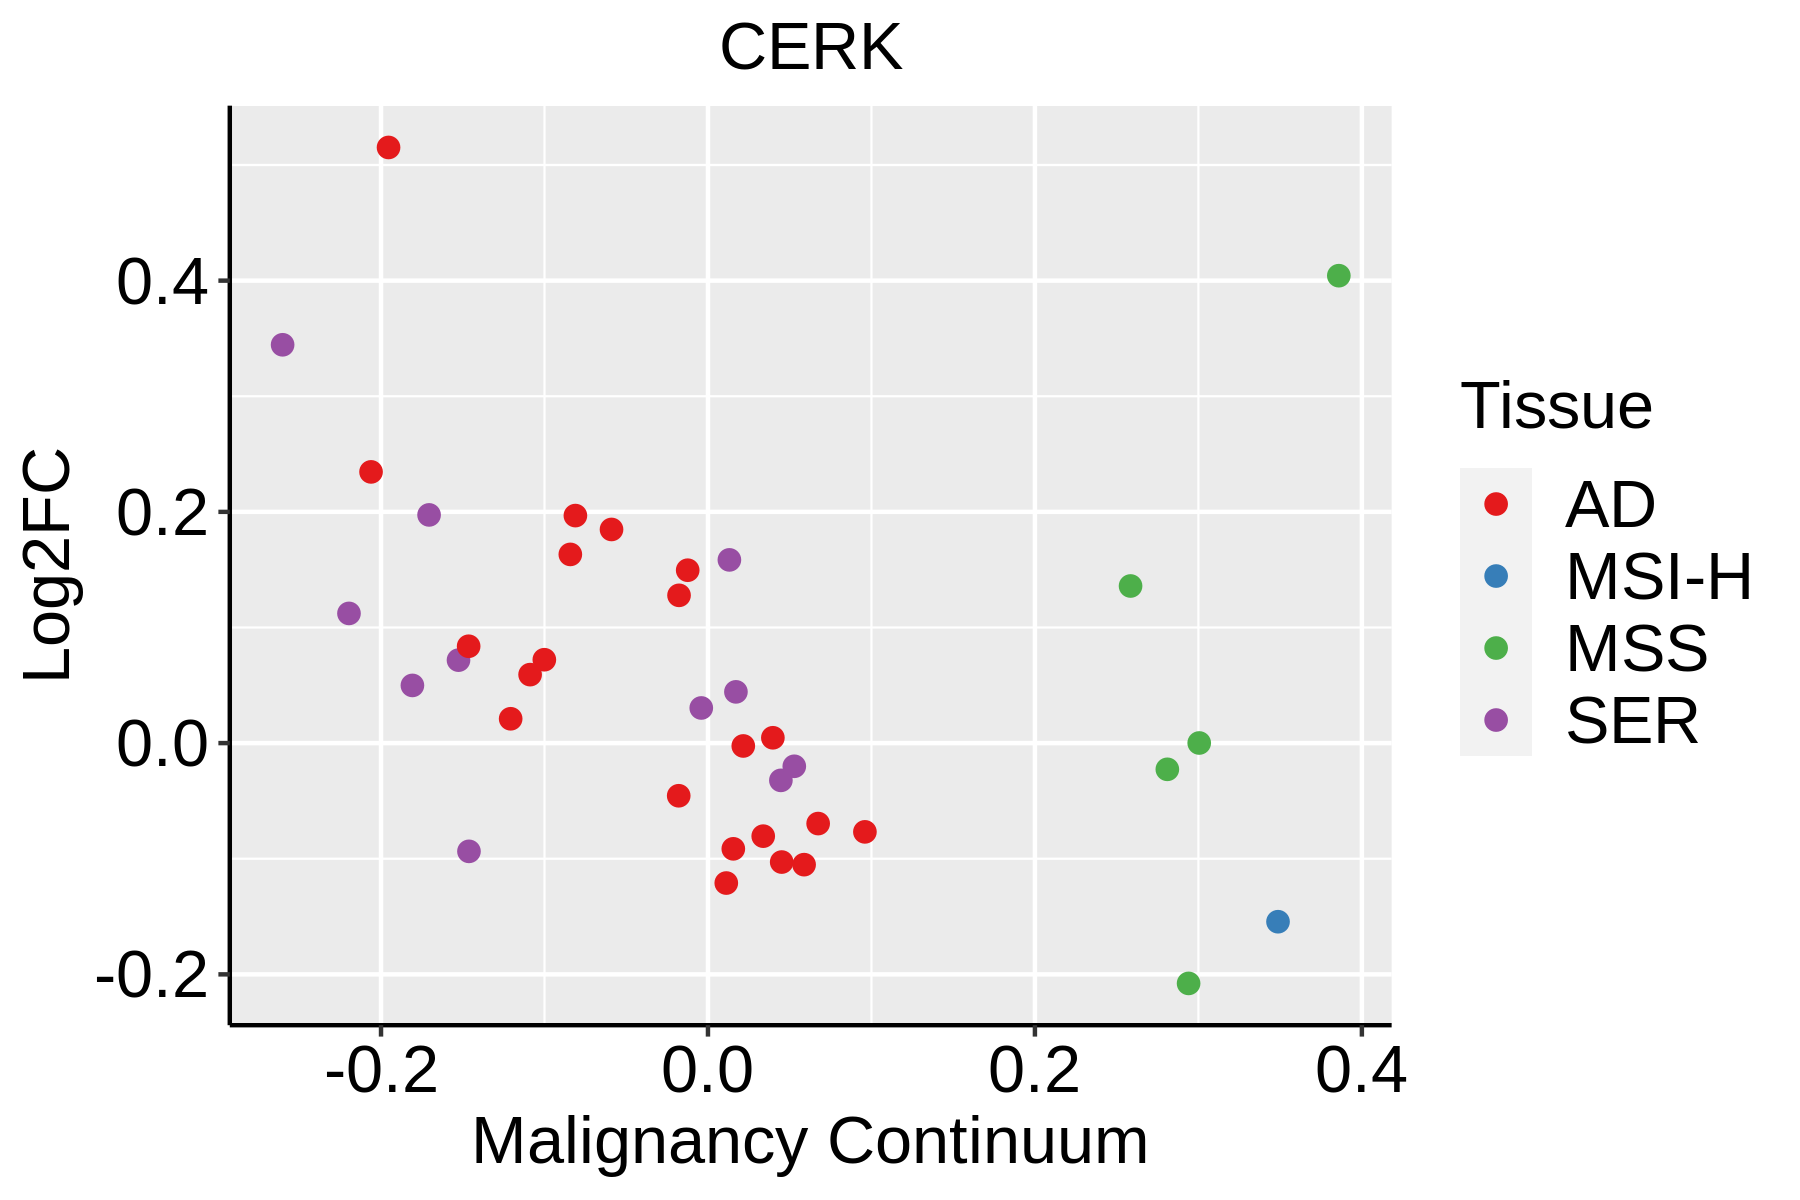 | AD: Adenomas |
| SER: Sessile serrated lesions | ||
| MSI-H: Microsatellite-high colorectal cancer | ||
| MSS: Microsatellite stable colorectal cancer | ||
| Esophagus |  | ESCC: Esophageal squamous cell carcinoma |
| HGIN: High-grade intraepithelial neoplasias | ||
| LGIN: Low-grade intraepithelial neoplasias | ||
| Liver |  | HCC: Hepatocellular carcinoma |
| NAFLD: Non-alcoholic fatty liver disease |
| ∗log2FC in expression of this searched gene in stem-like cells from each diseased tissue sample relative to stem-like cells in normal samples in each tissue plotted against the malignancy continuum. Samples are colored based on if they are from different disease stage. |
Top |
Malignant transformation related pathway analysis |
| Find out the enriched GO biological processes and KEGG pathways involved in transition from healthy to precancer to cancer |
| Tissue | Disease Stage | Enriched GO biological Processes |
| Colorectum | AD |  |
| Colorectum | SER |  |
| Colorectum | MSS |  |
| Colorectum | MSI-H |  |
| Colorectum | FAP |  |
| ∗Top 15 enriched GO BP terms are showed in the bar plot of each disease state in each tissue. Each row represents a significant GO biological process which is colored according to the -log10(p.adjust). |
| Page: 1 2 3 4 5 6 7 8 9 |
| GO ID | Tissue | Disease Stage | Description | Gene Ratio | Bg Ratio | pvalue | p.adjust | Count |
| GO:0030258 | Colorectum | AD | lipid modification | 67/3918 | 212/18723 | 1.66e-04 | 2.27e-03 | 67 |
| GO:00302582 | Colorectum | MSS | lipid modification | 57/3467 | 212/18723 | 1.64e-03 | 1.49e-02 | 57 |
| GO:00302583 | Colorectum | FAP | lipid modification | 52/2622 | 212/18723 | 2.84e-05 | 6.49e-04 | 52 |
| GO:00066433 | Esophagus | ESCC | membrane lipid metabolic process | 130/8552 | 203/18723 | 9.29e-08 | 1.54e-06 | 130 |
| GO:00066652 | Esophagus | ESCC | sphingolipid metabolic process | 96/8552 | 155/18723 | 3.21e-05 | 2.66e-04 | 96 |
| GO:00066642 | Esophagus | ESCC | glycolipid metabolic process | 63/8552 | 100/18723 | 3.55e-04 | 2.06e-03 | 63 |
| GO:19035092 | Esophagus | ESCC | liposaccharide metabolic process | 63/8552 | 101/18723 | 5.25e-04 | 2.90e-03 | 63 |
| GO:00066721 | Esophagus | ESCC | ceramide metabolic process | 61/8552 | 102/18723 | 2.82e-03 | 1.19e-02 | 61 |
| GO:00302586 | Esophagus | ESCC | lipid modification | 116/8552 | 212/18723 | 4.90e-03 | 1.89e-02 | 116 |
| GO:003025821 | Liver | HCC | lipid modification | 123/7958 | 212/18723 | 3.50e-06 | 4.58e-05 | 123 |
| GO:00066431 | Liver | HCC | membrane lipid metabolic process | 115/7958 | 203/18723 | 3.17e-05 | 3.22e-04 | 115 |
| GO:0006665 | Liver | HCC | sphingolipid metabolic process | 85/7958 | 155/18723 | 1.27e-03 | 6.92e-03 | 85 |
| GO:0006664 | Liver | HCC | glycolipid metabolic process | 57/7958 | 100/18723 | 2.40e-03 | 1.17e-02 | 57 |
| GO:1903509 | Liver | HCC | liposaccharide metabolic process | 57/7958 | 101/18723 | 3.25e-03 | 1.49e-02 | 57 |
| Page: 1 |
| Pathway ID | Tissue | Disease Stage | Description | Gene Ratio | Bg Ratio | pvalue | p.adjust | qvalue | Count |
| hsa006003 | Esophagus | ESCC | Sphingolipid metabolism | 36/4205 | 53/8465 | 5.41e-03 | 1.36e-02 | 6.99e-03 | 36 |
| hsa0060012 | Esophagus | ESCC | Sphingolipid metabolism | 36/4205 | 53/8465 | 5.41e-03 | 1.36e-02 | 6.99e-03 | 36 |
| hsa00600 | Liver | HCC | Sphingolipid metabolism | 34/4020 | 53/8465 | 1.06e-02 | 2.71e-02 | 1.51e-02 | 34 |
| hsa006001 | Liver | HCC | Sphingolipid metabolism | 34/4020 | 53/8465 | 1.06e-02 | 2.71e-02 | 1.51e-02 | 34 |
| Page: 1 |
Top |
Cell-cell communication analysis |
| Identification of potential cell-cell interactions between two cell types and their ligand-receptor pairs for different disease states |
| Ligand | Receptor | LRpair | Pathway | Tissue | Disease Stage |
| Page: 1 |
Top |
Single-cell gene regulatory network inference analysis |
| Find out the significant the regulons (TFs) and the target genes of each regulon across cell types for different disease states |
| TF | Cell Type | Tissue | Disease Stage | Target Gene | RSS | Regulon Activity |
| ∗The dot plots of a searched regulon are shown for all cell subpopulations in each disease state of each tissue based on the regulon specific score inferred using pySCENIC and by calculating the average expression. |
| Page: 1 |
Top |
Somatic mutation of malignant transformation related genes |
| Annotation of somatic variants for genes involved in malignant transformation |
| Hugo Symbol | Variant Class | Variant Classification | dbSNP RS | HGVSc | HGVSp | HGVSp Short | SWISSPROT | BIOTYPE | SIFT | PolyPhen | Tumor Sample Barcode | Tissue | Histology | Sex | Age | Stage | Therapy Types | Drugs | Outcome |
| CERK | SNV | Missense_Mutation | novel | c.166N>C | p.Glu56Gln | p.E56Q | Q8TCT0 | protein_coding | deleterious(0) | probably_damaging(0.959) | TCGA-BH-A2L8-01 | Breast | breast invasive carcinoma | Female | <65 | I/II | Chemotherapy | cytoxan | CR |
| CERK | insertion | In_Frame_Ins | novel | c.1107_1108insGGGGCAGCAGATGTCCCATTGAGGGCTTGCTTGGTGACC | p.Leu369_Tyr370insGlyAlaAlaAspValProLeuArgAlaCysLeuValThr | p.L369_Y370insGAADVPLRACLVT | Q8TCT0 | protein_coding | TCGA-E9-A1NC-01 | Breast | breast invasive carcinoma | Female | <65 | I/II | Chemotherapy | doxorubicin | CR | ||
| CERK | SNV | Missense_Mutation | rs781190421 | c.971N>A | p.Cys324Tyr | p.C324Y | Q8TCT0 | protein_coding | tolerated(1) | benign(0) | TCGA-2W-A8YY-01 | Cervix | cervical & endocervical cancer | Female | <65 | I/II | Chemotherapy | cisplatin | CR |
| CERK | SNV | Missense_Mutation | c.544N>A | p.Glu182Lys | p.E182K | Q8TCT0 | protein_coding | tolerated(0.21) | benign(0.013) | TCGA-DS-A0VM-01 | Cervix | cervical & endocervical cancer | Female | <65 | I/II | Chemotherapy | cisplatin | PD | |
| CERK | SNV | Missense_Mutation | c.1090N>A | p.Glu364Lys | p.E364K | Q8TCT0 | protein_coding | tolerated(0.15) | benign(0.003) | TCGA-EK-A2PG-01 | Cervix | cervical & endocervical cancer | Female | >=65 | I/II | Unknown | Unknown | SD | |
| CERK | SNV | Missense_Mutation | c.1604N>T | p.Ser535Leu | p.S535L | Q8TCT0 | protein_coding | tolerated_low_confidence(0.06) | benign(0) | TCGA-UC-A7PF-01 | Cervix | cervical & endocervical cancer | Female | <65 | I/II | Unknown | Unknown | SD | |
| CERK | SNV | Missense_Mutation | novel | c.377N>C | p.Leu126Pro | p.L126P | Q8TCT0 | protein_coding | tolerated(0.21) | benign(0.109) | TCGA-XS-A8TJ-01 | Cervix | cervical & endocervical cancer | Female | <65 | I/II | Chemotherapy | cisplatin | SD |
| CERK | SNV | Missense_Mutation | novel | c.163N>C | p.Ser55Pro | p.S55P | Q8TCT0 | protein_coding | deleterious(0.01) | possibly_damaging(0.68) | TCGA-ZJ-AAXJ-01 | Cervix | cervical & endocervical cancer | Female | <65 | I/II | Unknown | Unknown | SD |
| CERK | SNV | Missense_Mutation | rs144086274 | c.845N>A | p.Arg282His | p.R282H | Q8TCT0 | protein_coding | deleterious(0) | benign(0.422) | TCGA-AA-3713-01 | Colorectum | colon adenocarcinoma | Male | >=65 | III/IV | Chemotherapy | 5-fluorouracil | PR |
| CERK | SNV | Missense_Mutation | rs771578079 | c.1361N>A | p.Arg454His | p.R454H | Q8TCT0 | protein_coding | deleterious(0) | probably_damaging(0.985) | TCGA-AA-A010-01 | Colorectum | colon adenocarcinoma | Female | <65 | I/II | Chemotherapy | folinic | CR |
| Page: 1 2 3 4 5 6 |
Top |
Related drugs of malignant transformation related genes |
| Identification of chemicals and drugs interact with genes involved in malignant transfromation |
| (DGIdb 4.0) |
| Entrez ID | Symbol | Category | Interaction Types | Drug Claim Name | Drug Name | PMIDs |
| 64781 | CERK | KINASE, LIPID KINASE, ENZYME | inhibitor | 178103280 |
| Page: 1 |

Copyright 2023-Present -The University of Texas Health Science Center at Houston |