
|
|||||
|
 | |
| |
| |
| |
| |
| |
|
Gene: CERCAM |
Gene summary for CERCAM |
| Gene information | Species | Human | Gene symbol | CERCAM | Gene ID | 51148 |
| Gene name | cerebral endothelial cell adhesion molecule | |
| Gene Alias | CEECAM1 | |
| Cytomap | 9q34.11 | |
| Gene Type | protein-coding | GO ID | GO:0007155 | UniProtAcc | Q5T4B2 |
Top |
Malignant transformation analysis |
| Identification of the aberrant gene expression in precancerous and cancerous lesions by comparing the gene expression of stem-like cells in diseased tissues with normal stem cells |
| Entrez ID | Symbol | Replicates | Species | Organ | Tissue | Adj P-value | Log2FC | Malignancy |
| 51148 | CERCAM | LZE4T | Human | Esophagus | ESCC | 2.56e-08 | 2.26e-01 | 0.0811 |
| 51148 | CERCAM | LZE20T | Human | Esophagus | ESCC | 8.43e-11 | 3.46e-01 | 0.0662 |
| 51148 | CERCAM | LZE22T | Human | Esophagus | ESCC | 1.40e-05 | 3.09e-01 | 0.068 |
| 51148 | CERCAM | P2T-E | Human | Esophagus | ESCC | 1.09e-25 | 4.90e-01 | 0.1177 |
| 51148 | CERCAM | P4T-E | Human | Esophagus | ESCC | 1.48e-25 | 8.00e-01 | 0.1323 |
| 51148 | CERCAM | P5T-E | Human | Esophagus | ESCC | 3.09e-05 | 4.13e-01 | 0.1327 |
| 51148 | CERCAM | P8T-E | Human | Esophagus | ESCC | 4.49e-18 | 3.32e-01 | 0.0889 |
| 51148 | CERCAM | P9T-E | Human | Esophagus | ESCC | 2.35e-18 | 7.25e-01 | 0.1131 |
| 51148 | CERCAM | P10T-E | Human | Esophagus | ESCC | 1.80e-11 | 4.32e-01 | 0.116 |
| 51148 | CERCAM | P11T-E | Human | Esophagus | ESCC | 2.86e-30 | 1.28e+00 | 0.1426 |
| 51148 | CERCAM | P12T-E | Human | Esophagus | ESCC | 1.31e-21 | 3.66e-01 | 0.1122 |
| 51148 | CERCAM | P15T-E | Human | Esophagus | ESCC | 9.17e-12 | 4.94e-01 | 0.1149 |
| 51148 | CERCAM | P16T-E | Human | Esophagus | ESCC | 1.66e-29 | 5.04e-01 | 0.1153 |
| 51148 | CERCAM | P17T-E | Human | Esophagus | ESCC | 1.01e-08 | 4.55e-01 | 0.1278 |
| 51148 | CERCAM | P19T-E | Human | Esophagus | ESCC | 3.86e-09 | 8.87e-01 | 0.1662 |
| 51148 | CERCAM | P21T-E | Human | Esophagus | ESCC | 8.86e-43 | 8.29e-01 | 0.1617 |
| 51148 | CERCAM | P22T-E | Human | Esophagus | ESCC | 1.34e-36 | 6.65e-01 | 0.1236 |
| 51148 | CERCAM | P23T-E | Human | Esophagus | ESCC | 5.54e-07 | 2.50e-01 | 0.108 |
| 51148 | CERCAM | P24T-E | Human | Esophagus | ESCC | 1.17e-18 | 5.24e-01 | 0.1287 |
| 51148 | CERCAM | P26T-E | Human | Esophagus | ESCC | 1.22e-17 | 4.17e-01 | 0.1276 |
| Page: 1 2 3 4 5 |
| Tissue | Expression Dynamics | Abbreviation |
| Esophagus |  | ESCC: Esophageal squamous cell carcinoma |
| HGIN: High-grade intraepithelial neoplasias | ||
| LGIN: Low-grade intraepithelial neoplasias | ||
| Liver | 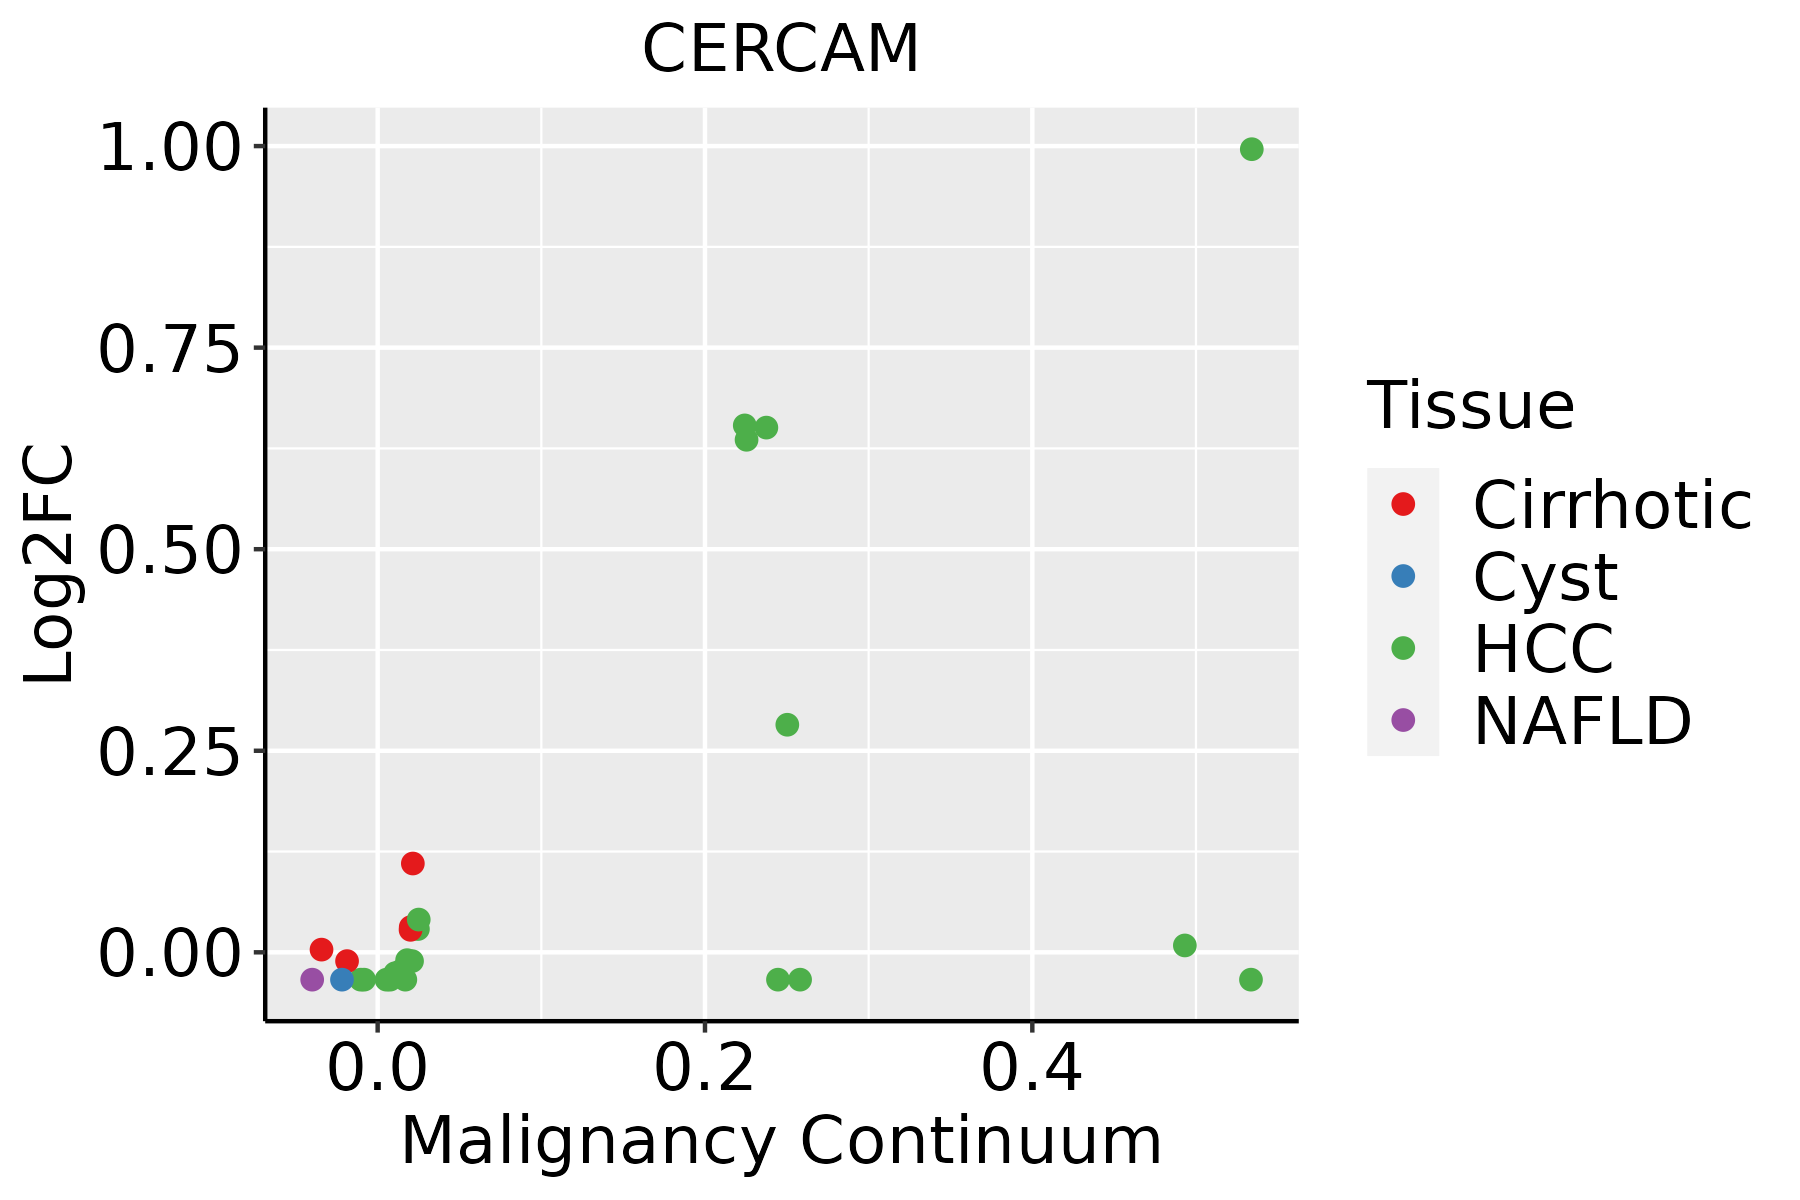 | HCC: Hepatocellular carcinoma |
| NAFLD: Non-alcoholic fatty liver disease | ||
| Oral Cavity |  | EOLP: Erosive Oral lichen planus |
| LP: leukoplakia | ||
| NEOLP: Non-erosive oral lichen planus | ||
| OSCC: Oral squamous cell carcinoma | ||
| Thyroid |  | ATC: Anaplastic thyroid cancer |
| HT: Hashimoto's thyroiditis | ||
| PTC: Papillary thyroid cancer |
| ∗log2FC in expression of this searched gene in stem-like cells from each diseased tissue sample relative to stem-like cells in normal samples in each tissue plotted against the malignancy continuum. Samples are colored based on if they are from different disease stage. |
Top |
Malignant transformation related pathway analysis |
| Find out the enriched GO biological processes and KEGG pathways involved in transition from healthy to precancer to cancer |
| Tissue | Disease Stage | Enriched GO biological Processes |
| Colorectum | AD |  |
| Colorectum | SER |  |
| Colorectum | MSS |  |
| Colorectum | MSI-H |  |
| Colorectum | FAP |  |
| ∗Top 15 enriched GO BP terms are showed in the bar plot of each disease state in each tissue. Each row represents a significant GO biological process which is colored according to the -log10(p.adjust). |
| Page: 1 2 3 4 5 6 7 8 9 |
| GO ID | Tissue | Disease Stage | Description | Gene Ratio | Bg Ratio | pvalue | p.adjust | Count |
| GO:000715918 | Esophagus | ESCC | leukocyte cell-cell adhesion | 192/8552 | 371/18723 | 1.03e-02 | 3.51e-02 | 192 |
| GO:000715916 | Oral cavity | OSCC | leukocyte cell-cell adhesion | 178/7305 | 371/18723 | 2.44e-04 | 1.57e-03 | 178 |
| Page: 1 |
| Pathway ID | Tissue | Disease Stage | Description | Gene Ratio | Bg Ratio | pvalue | p.adjust | qvalue | Count |
| Page: 1 |
Top |
Cell-cell communication analysis |
| Identification of potential cell-cell interactions between two cell types and their ligand-receptor pairs for different disease states |
| Ligand | Receptor | LRpair | Pathway | Tissue | Disease Stage |
| Page: 1 |
Top |
Single-cell gene regulatory network inference analysis |
| Find out the significant the regulons (TFs) and the target genes of each regulon across cell types for different disease states |
| TF | Cell Type | Tissue | Disease Stage | Target Gene | RSS | Regulon Activity |
| ∗The dot plots of a searched regulon are shown for all cell subpopulations in each disease state of each tissue based on the regulon specific score inferred using pySCENIC and by calculating the average expression. |
| Page: 1 |
Top |
Somatic mutation of malignant transformation related genes |
| Annotation of somatic variants for genes involved in malignant transformation |
| Hugo Symbol | Variant Class | Variant Classification | dbSNP RS | HGVSc | HGVSp | HGVSp Short | SWISSPROT | BIOTYPE | SIFT | PolyPhen | Tumor Sample Barcode | Tissue | Histology | Sex | Age | Stage | Therapy Types | Drugs | Outcome |
| CERCAM | SNV | Missense_Mutation | c.628N>T | p.Val210Phe | p.V210F | Q5T4B2 | protein_coding | deleterious(0) | probably_damaging(0.992) | TCGA-A8-A090-01 | Breast | breast invasive carcinoma | Female | >=65 | I/II | Unknown | Unknown | SD | |
| CERCAM | deletion | Frame_Shift_Del | novel | c.968_990delTTGTCATCAGCCTGGCTCGCAGG | p.Phe323SerfsTer2 | p.F323Sfs*2 | Q5T4B2 | protein_coding | TCGA-LL-A8F5-01 | Breast | breast invasive carcinoma | Female | <65 | I/II | Chemotherapy | cyclophosphamide | SD | ||
| CERCAM | SNV | Missense_Mutation | rs201331661 | c.1717N>T | p.Arg573Cys | p.R573C | Q5T4B2 | protein_coding | deleterious(0) | possibly_damaging(0.513) | TCGA-2W-A8YY-01 | Cervix | cervical & endocervical cancer | Female | <65 | I/II | Chemotherapy | cisplatin | CR |
| CERCAM | SNV | Missense_Mutation | c.439G>C | p.Asp147His | p.D147H | Q5T4B2 | protein_coding | deleterious(0) | probably_damaging(1) | TCGA-C5-A2LX-01 | Cervix | cervical & endocervical cancer | Female | <65 | I/II | Chemotherapy | cisplatin | SD | |
| CERCAM | SNV | Missense_Mutation | c.1240N>A | p.Glu414Lys | p.E414K | Q5T4B2 | protein_coding | deleterious(0) | probably_damaging(1) | TCGA-IR-A3LA-01 | Cervix | cervical & endocervical cancer | Female | <65 | I/II | Chemotherapy | cisplatin | CR | |
| CERCAM | SNV | Missense_Mutation | rs781104554 | c.670G>A | p.Glu224Lys | p.E224K | Q5T4B2 | protein_coding | deleterious(0.04) | benign(0.001) | TCGA-JW-A5VL-01 | Cervix | cervical & endocervical cancer | Female | <65 | I/II | Unknown | Unknown | SD |
| CERCAM | SNV | Missense_Mutation | novel | c.359N>T | p.Gln120Leu | p.Q120L | Q5T4B2 | protein_coding | deleterious(0.05) | benign(0.03) | TCGA-AA-3696-01 | Colorectum | colon adenocarcinoma | Female | >=65 | III/IV | Unknown | Unknown | PD |
| CERCAM | SNV | Missense_Mutation | novel | c.1262G>A | p.Ser421Asn | p.S421N | Q5T4B2 | protein_coding | tolerated(0.34) | benign(0.222) | TCGA-AA-3984-01 | Colorectum | colon adenocarcinoma | Female | <65 | I/II | Unknown | Unknown | SD |
| CERCAM | SNV | Missense_Mutation | rs770509829 | c.1585G>A | p.Ala529Thr | p.A529T | Q5T4B2 | protein_coding | tolerated(0.22) | benign(0.031) | TCGA-CM-4746-01 | Colorectum | colon adenocarcinoma | Male | <65 | I/II | Unknown | Unknown | SD |
| CERCAM | SNV | Missense_Mutation | novel | c.1311N>T | p.Glu437Asp | p.E437D | Q5T4B2 | protein_coding | tolerated(0.38) | benign(0.158) | TCGA-EI-6917-01 | Colorectum | rectum adenocarcinoma | Male | <65 | III/IV | Chemotherapy | 5fluorouracil+oxaciplatina+l-folinian | SD |
| Page: 1 2 3 4 5 |
Top |
Related drugs of malignant transformation related genes |
| Identification of chemicals and drugs interact with genes involved in malignant transfromation |
| (DGIdb 4.0) |
| Entrez ID | Symbol | Category | Interaction Types | Drug Claim Name | Drug Name | PMIDs |
| Page: 1 |

Copyright 2023-Present -The University of Texas Health Science Center at Houston |