
|
|||||
|
 | |
| |
| |
| |
| |
| |
|
Gene: CEPT1 |
Gene summary for CEPT1 |
| Gene information | Species | Human | Gene symbol | CEPT1 | Gene ID | 10390 |
| Gene name | choline/ethanolamine phosphotransferase 1 | |
| Gene Alias | CEPT1 | |
| Cytomap | 1p13.3 | |
| Gene Type | protein-coding | GO ID | GO:0006629 | UniProtAcc | A0A024R0C0 |
Top |
Malignant transformation analysis |
| Identification of the aberrant gene expression in precancerous and cancerous lesions by comparing the gene expression of stem-like cells in diseased tissues with normal stem cells |
| Entrez ID | Symbol | Replicates | Species | Organ | Tissue | Adj P-value | Log2FC | Malignancy |
| 10390 | CEPT1 | LZE4T | Human | Esophagus | ESCC | 9.08e-09 | 2.09e-01 | 0.0811 |
| 10390 | CEPT1 | LZE7T | Human | Esophagus | ESCC | 1.04e-02 | 1.15e-01 | 0.0667 |
| 10390 | CEPT1 | LZE8T | Human | Esophagus | ESCC | 3.71e-02 | 9.00e-02 | 0.067 |
| 10390 | CEPT1 | LZE20T | Human | Esophagus | ESCC | 1.33e-03 | 1.65e-01 | 0.0662 |
| 10390 | CEPT1 | LZE24T | Human | Esophagus | ESCC | 1.71e-07 | 1.56e-01 | 0.0596 |
| 10390 | CEPT1 | P1T-E | Human | Esophagus | ESCC | 1.91e-04 | 2.17e-01 | 0.0875 |
| 10390 | CEPT1 | P2T-E | Human | Esophagus | ESCC | 1.20e-22 | 2.48e-01 | 0.1177 |
| 10390 | CEPT1 | P4T-E | Human | Esophagus | ESCC | 3.93e-09 | 1.67e-01 | 0.1323 |
| 10390 | CEPT1 | P5T-E | Human | Esophagus | ESCC | 9.34e-09 | 9.69e-02 | 0.1327 |
| 10390 | CEPT1 | P8T-E | Human | Esophagus | ESCC | 1.02e-14 | 2.04e-01 | 0.0889 |
| 10390 | CEPT1 | P9T-E | Human | Esophagus | ESCC | 2.95e-12 | 1.20e-01 | 0.1131 |
| 10390 | CEPT1 | P10T-E | Human | Esophagus | ESCC | 4.90e-32 | 3.39e-01 | 0.116 |
| 10390 | CEPT1 | P11T-E | Human | Esophagus | ESCC | 2.26e-03 | 2.51e-01 | 0.1426 |
| 10390 | CEPT1 | P12T-E | Human | Esophagus | ESCC | 4.07e-37 | 6.89e-01 | 0.1122 |
| 10390 | CEPT1 | P15T-E | Human | Esophagus | ESCC | 7.68e-09 | 9.75e-02 | 0.1149 |
| 10390 | CEPT1 | P16T-E | Human | Esophagus | ESCC | 2.03e-09 | 1.46e-01 | 0.1153 |
| 10390 | CEPT1 | P17T-E | Human | Esophagus | ESCC | 1.73e-06 | 2.26e-01 | 0.1278 |
| 10390 | CEPT1 | P20T-E | Human | Esophagus | ESCC | 5.22e-12 | 2.13e-01 | 0.1124 |
| 10390 | CEPT1 | P21T-E | Human | Esophagus | ESCC | 2.28e-08 | 1.23e-01 | 0.1617 |
| 10390 | CEPT1 | P22T-E | Human | Esophagus | ESCC | 3.58e-04 | 8.92e-02 | 0.1236 |
| Page: 1 2 3 4 |
| Tissue | Expression Dynamics | Abbreviation |
| Esophagus | 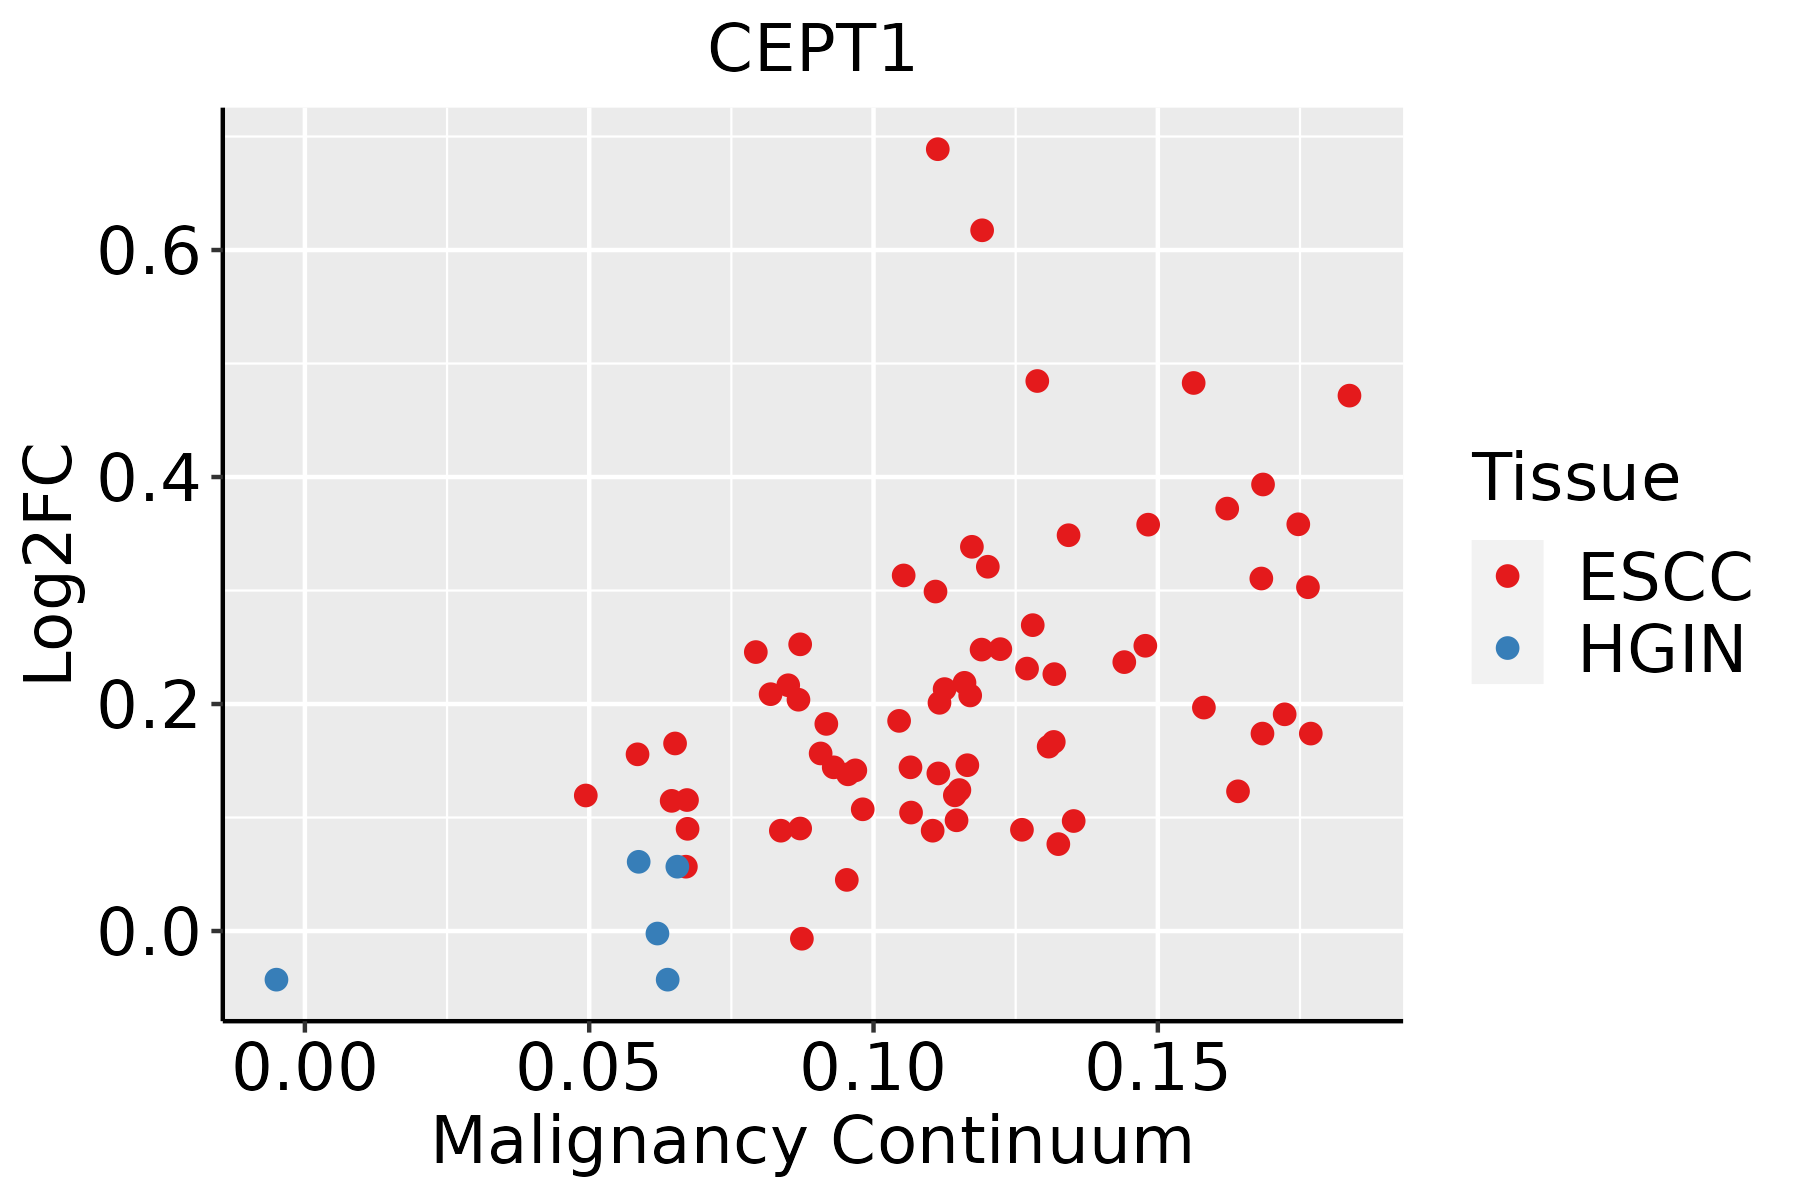 | ESCC: Esophageal squamous cell carcinoma |
| HGIN: High-grade intraepithelial neoplasias | ||
| LGIN: Low-grade intraepithelial neoplasias | ||
| Oral Cavity | 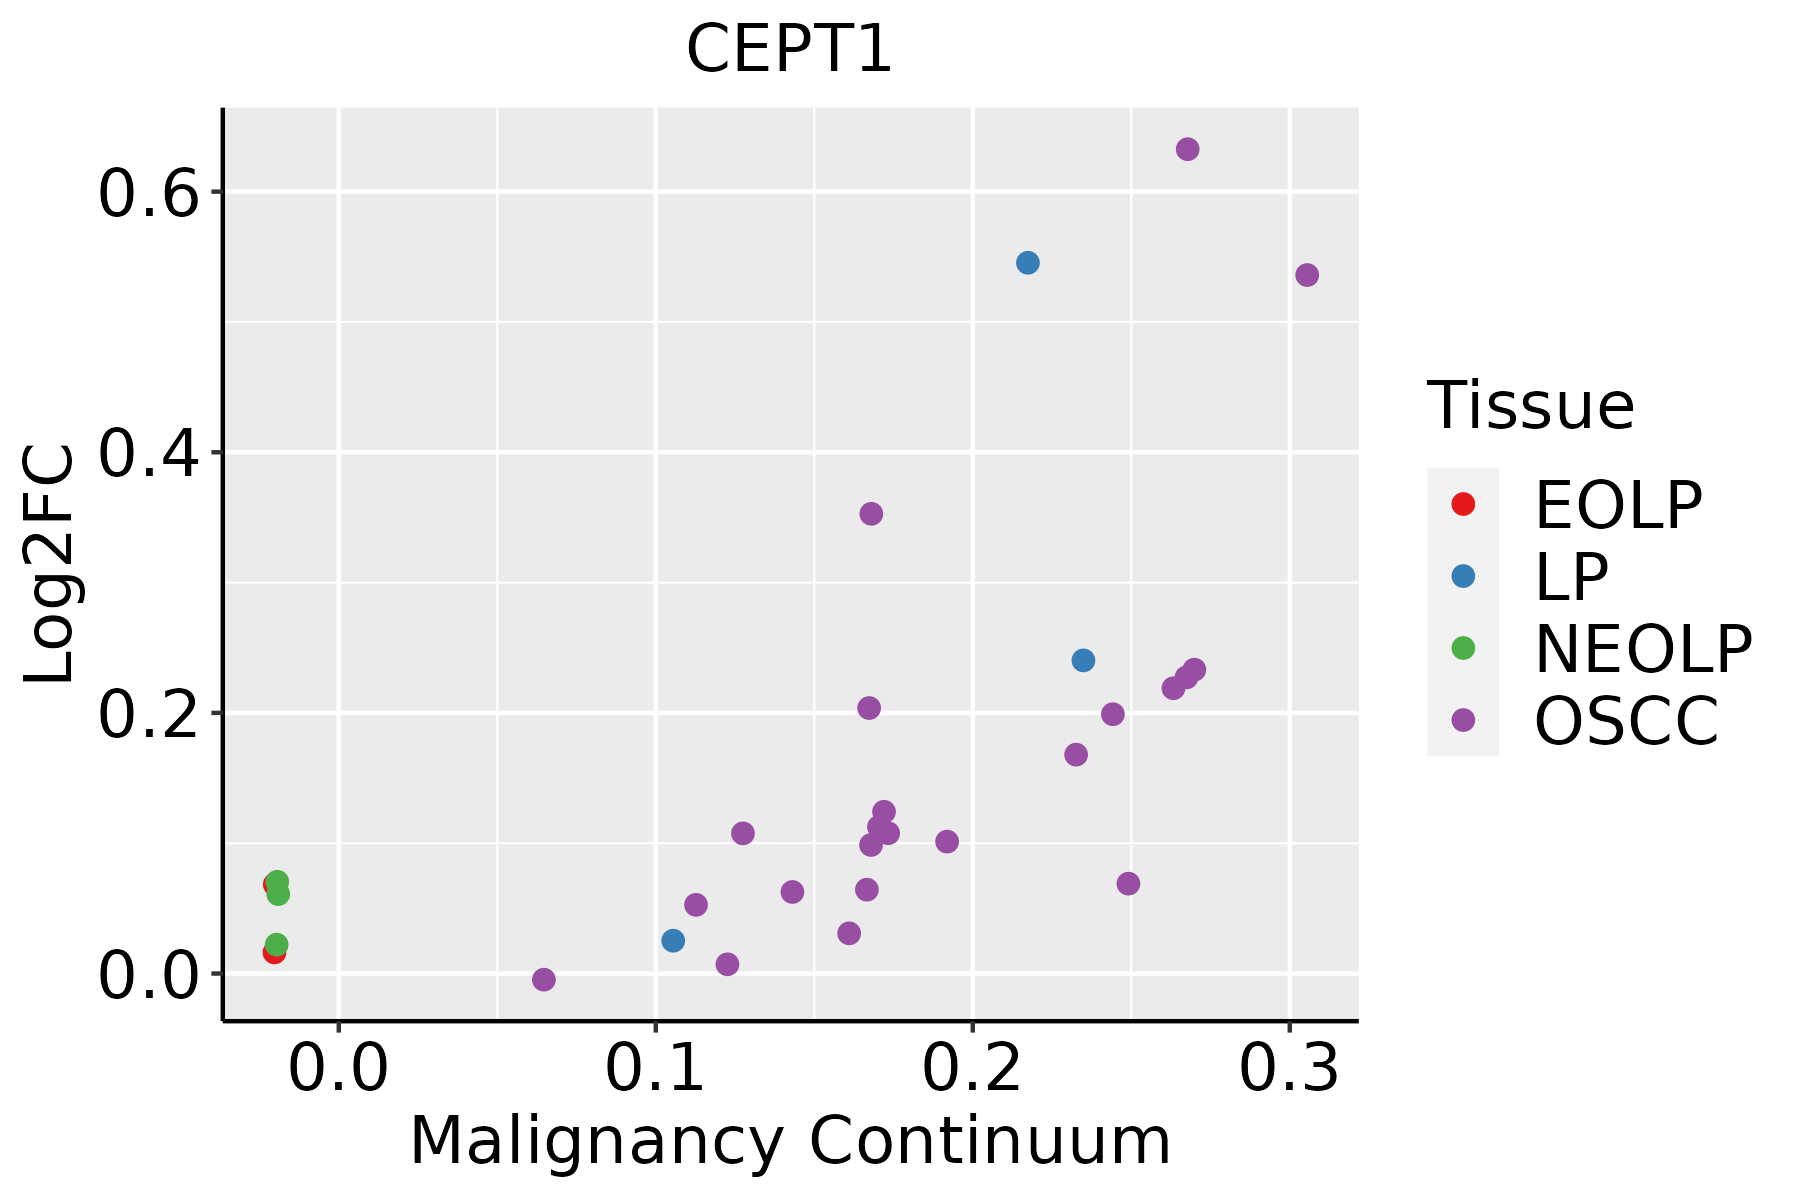 | EOLP: Erosive Oral lichen planus |
| LP: leukoplakia | ||
| NEOLP: Non-erosive oral lichen planus | ||
| OSCC: Oral squamous cell carcinoma |
| ∗log2FC in expression of this searched gene in stem-like cells from each diseased tissue sample relative to stem-like cells in normal samples in each tissue plotted against the malignancy continuum. Samples are colored based on if they are from different disease stage. |
Top |
Malignant transformation related pathway analysis |
| Find out the enriched GO biological processes and KEGG pathways involved in transition from healthy to precancer to cancer |
| Tissue | Disease Stage | Enriched GO biological Processes |
| Colorectum | AD |  |
| Colorectum | SER |  |
| Colorectum | MSS |  |
| Colorectum | MSI-H |  |
| Colorectum | FAP |  |
| ∗Top 15 enriched GO BP terms are showed in the bar plot of each disease state in each tissue. Each row represents a significant GO biological process which is colored according to the -log10(p.adjust). |
| Page: 1 2 3 4 5 6 7 8 9 |
| GO ID | Tissue | Disease Stage | Description | Gene Ratio | Bg Ratio | pvalue | p.adjust | Count |
| GO:00086544 | Esophagus | ESCC | phospholipid biosynthetic process | 162/8552 | 253/18723 | 2.59e-09 | 5.73e-08 | 162 |
| GO:00464744 | Esophagus | ESCC | glycerophospholipid biosynthetic process | 135/8552 | 211/18723 | 5.75e-08 | 1.02e-06 | 135 |
| GO:00450175 | Esophagus | ESCC | glycerolipid biosynthetic process | 154/8552 | 252/18723 | 5.20e-07 | 6.96e-06 | 154 |
| GO:00066446 | Esophagus | ESCC | phospholipid metabolic process | 218/8552 | 383/18723 | 5.37e-06 | 5.59e-05 | 218 |
| GO:00066561 | Esophagus | ESCC | phosphatidylcholine biosynthetic process | 24/8552 | 29/18723 | 4.50e-05 | 3.55e-04 | 24 |
| GO:00066505 | Esophagus | ESCC | glycerophospholipid metabolic process | 174/8552 | 306/18723 | 4.92e-05 | 3.85e-04 | 174 |
| GO:0006646 | Esophagus | ESCC | phosphatidylethanolamine biosynthetic process | 10/8552 | 10/18723 | 3.94e-04 | 2.26e-03 | 10 |
| GO:00464864 | Esophagus | ESCC | glycerolipid metabolic process | 211/8552 | 392/18723 | 6.51e-04 | 3.46e-03 | 211 |
| GO:00086543 | Oral cavity | OSCC | phospholipid biosynthetic process | 130/7305 | 253/18723 | 3.96e-05 | 3.46e-04 | 130 |
| GO:00464743 | Oral cavity | OSCC | glycerophospholipid biosynthetic process | 102/7305 | 211/18723 | 3.50e-03 | 1.48e-02 | 102 |
| GO:00066445 | Oral cavity | OSCC | phospholipid metabolic process | 175/7305 | 383/18723 | 4.21e-03 | 1.71e-02 | 175 |
| Page: 1 |
| Pathway ID | Tissue | Disease Stage | Description | Gene Ratio | Bg Ratio | pvalue | p.adjust | qvalue | Count |
| Page: 1 |
Top |
Cell-cell communication analysis |
| Identification of potential cell-cell interactions between two cell types and their ligand-receptor pairs for different disease states |
| Ligand | Receptor | LRpair | Pathway | Tissue | Disease Stage |
| Page: 1 |
Top |
Single-cell gene regulatory network inference analysis |
| Find out the significant the regulons (TFs) and the target genes of each regulon across cell types for different disease states |
| TF | Cell Type | Tissue | Disease Stage | Target Gene | RSS | Regulon Activity |
| ∗The dot plots of a searched regulon are shown for all cell subpopulations in each disease state of each tissue based on the regulon specific score inferred using pySCENIC and by calculating the average expression. |
| Page: 1 |
Top |
Somatic mutation of malignant transformation related genes |
| Annotation of somatic variants for genes involved in malignant transformation |
| Hugo Symbol | Variant Class | Variant Classification | dbSNP RS | HGVSc | HGVSp | HGVSp Short | SWISSPROT | BIOTYPE | SIFT | PolyPhen | Tumor Sample Barcode | Tissue | Histology | Sex | Age | Stage | Therapy Types | Drugs | Outcome |
| CEPT1 | SNV | Missense_Mutation | c.736N>T | p.Met246Leu | p.M246L | Q9Y6K0 | protein_coding | tolerated(1) | benign(0) | TCGA-BH-A0BC-01 | Breast | breast invasive carcinoma | Female | <65 | III/IV | Chemotherapy | doxorubicin | SD | |
| CEPT1 | insertion | In_Frame_Ins | novel | c.571_572insACA | p.Phe191delinsTyrIle | p.F191delinsYI | Q9Y6K0 | protein_coding | TCGA-AQ-A04J-01 | Breast | breast invasive carcinoma | Female | <65 | I/II | Chemotherapy | cytoxan | SD | ||
| CEPT1 | insertion | Frame_Shift_Ins | novel | c.572_573insAGAAAAAGACTTCC | p.Phe191LeufsTer25 | p.F191Lfs*25 | Q9Y6K0 | protein_coding | TCGA-AQ-A04J-01 | Breast | breast invasive carcinoma | Female | <65 | I/II | Chemotherapy | cytoxan | SD | ||
| CEPT1 | SNV | Missense_Mutation | novel | c.148C>T | p.Arg50Trp | p.R50W | Q9Y6K0 | protein_coding | deleterious(0) | probably_damaging(0.996) | TCGA-2W-A8YY-01 | Cervix | cervical & endocervical cancer | Female | <65 | I/II | Chemotherapy | cisplatin | CR |
| CEPT1 | SNV | Missense_Mutation | rs749655031 | c.149G>A | p.Arg50Gln | p.R50Q | Q9Y6K0 | protein_coding | deleterious(0) | possibly_damaging(0.884) | TCGA-2W-A8YY-01 | Cervix | cervical & endocervical cancer | Female | <65 | I/II | Chemotherapy | cisplatin | CR |
| CEPT1 | SNV | Missense_Mutation | novel | c.572T>G | p.Phe191Cys | p.F191C | Q9Y6K0 | protein_coding | deleterious(0.04) | probably_damaging(1) | TCGA-DS-A1OB-01 | Cervix | cervical & endocervical cancer | Female | <65 | I/II | Chemotherapy | carboplatin | PD |
| CEPT1 | insertion | Frame_Shift_Ins | novel | c.570_571insAAAAGATATGC | p.Phe191LysfsTer24 | p.F191Kfs*24 | Q9Y6K0 | protein_coding | TCGA-DS-A1OB-01 | Cervix | cervical & endocervical cancer | Female | <65 | I/II | Chemotherapy | carboplatin | PD | ||
| CEPT1 | SNV | Missense_Mutation | c.521N>C | p.Gln174Pro | p.Q174P | Q9Y6K0 | protein_coding | deleterious(0.03) | possibly_damaging(0.868) | TCGA-AA-3663-01 | Colorectum | colon adenocarcinoma | Male | <65 | I/II | Unknown | Unknown | SD | |
| CEPT1 | SNV | Missense_Mutation | c.745T>G | p.Phe249Val | p.F249V | Q9Y6K0 | protein_coding | tolerated(0.58) | benign(0.012) | TCGA-AA-3977-01 | Colorectum | colon adenocarcinoma | Male | >=65 | I/II | Unknown | Unknown | SD | |
| CEPT1 | SNV | Missense_Mutation | novel | c.286N>C | p.Asn96His | p.N96H | Q9Y6K0 | protein_coding | deleterious(0) | benign(0.432) | TCGA-CA-6717-01 | Colorectum | colon adenocarcinoma | Male | <65 | I/II | Chemotherapy | oxaliplatin | CR |
| Page: 1 2 3 4 5 |
Top |
Related drugs of malignant transformation related genes |
| Identification of chemicals and drugs interact with genes involved in malignant transfromation |
| (DGIdb 4.0) |
| Entrez ID | Symbol | Category | Interaction Types | Drug Claim Name | Drug Name | PMIDs |
| Page: 1 |

Copyright 2023-Present -The University of Texas Health Science Center at Houston |