
|
|||||
|
 | |
| |
| |
| |
| |
| |
|
Gene: CEP89 |
Gene summary for CEP89 |
| Gene information | Species | Human | Gene symbol | CEP89 | Gene ID | 84902 |
| Gene name | centrosomal protein 89 | |
| Gene Alias | CCDC123 | |
| Cytomap | 19q13.11 | |
| Gene Type | protein-coding | GO ID | GO:0006996 | UniProtAcc | Q96ST8 |
Top |
Malignant transformation analysis |
| Identification of the aberrant gene expression in precancerous and cancerous lesions by comparing the gene expression of stem-like cells in diseased tissues with normal stem cells |
| Entrez ID | Symbol | Replicates | Species | Organ | Tissue | Adj P-value | Log2FC | Malignancy |
| 84902 | CEP89 | LZE4T | Human | Esophagus | ESCC | 3.60e-04 | 1.48e-01 | 0.0811 |
| 84902 | CEP89 | LZE7T | Human | Esophagus | ESCC | 1.74e-02 | 1.77e-01 | 0.0667 |
| 84902 | CEP89 | LZE24T | Human | Esophagus | ESCC | 3.48e-07 | 2.31e-01 | 0.0596 |
| 84902 | CEP89 | P1T-E | Human | Esophagus | ESCC | 1.18e-07 | 3.44e-01 | 0.0875 |
| 84902 | CEP89 | P2T-E | Human | Esophagus | ESCC | 4.57e-16 | 2.82e-01 | 0.1177 |
| 84902 | CEP89 | P4T-E | Human | Esophagus | ESCC | 9.65e-11 | 2.13e-01 | 0.1323 |
| 84902 | CEP89 | P5T-E | Human | Esophagus | ESCC | 4.96e-10 | 1.40e-01 | 0.1327 |
| 84902 | CEP89 | P8T-E | Human | Esophagus | ESCC | 5.32e-20 | 3.54e-01 | 0.0889 |
| 84902 | CEP89 | P9T-E | Human | Esophagus | ESCC | 6.11e-16 | 2.54e-01 | 0.1131 |
| 84902 | CEP89 | P10T-E | Human | Esophagus | ESCC | 6.66e-19 | 3.49e-01 | 0.116 |
| 84902 | CEP89 | P11T-E | Human | Esophagus | ESCC | 5.18e-08 | 3.08e-01 | 0.1426 |
| 84902 | CEP89 | P12T-E | Human | Esophagus | ESCC | 7.52e-10 | 1.81e-01 | 0.1122 |
| 84902 | CEP89 | P15T-E | Human | Esophagus | ESCC | 1.71e-12 | 2.87e-01 | 0.1149 |
| 84902 | CEP89 | P16T-E | Human | Esophagus | ESCC | 3.98e-16 | 1.66e-01 | 0.1153 |
| 84902 | CEP89 | P17T-E | Human | Esophagus | ESCC | 9.85e-10 | 3.75e-01 | 0.1278 |
| 84902 | CEP89 | P19T-E | Human | Esophagus | ESCC | 1.45e-08 | 4.37e-01 | 0.1662 |
| 84902 | CEP89 | P20T-E | Human | Esophagus | ESCC | 2.72e-12 | 2.19e-01 | 0.1124 |
| 84902 | CEP89 | P21T-E | Human | Esophagus | ESCC | 1.82e-10 | 1.48e-01 | 0.1617 |
| 84902 | CEP89 | P22T-E | Human | Esophagus | ESCC | 1.25e-18 | 2.74e-01 | 0.1236 |
| 84902 | CEP89 | P23T-E | Human | Esophagus | ESCC | 3.87e-11 | 2.29e-01 | 0.108 |
| Page: 1 2 3 4 5 |
| Tissue | Expression Dynamics | Abbreviation |
| Esophagus | 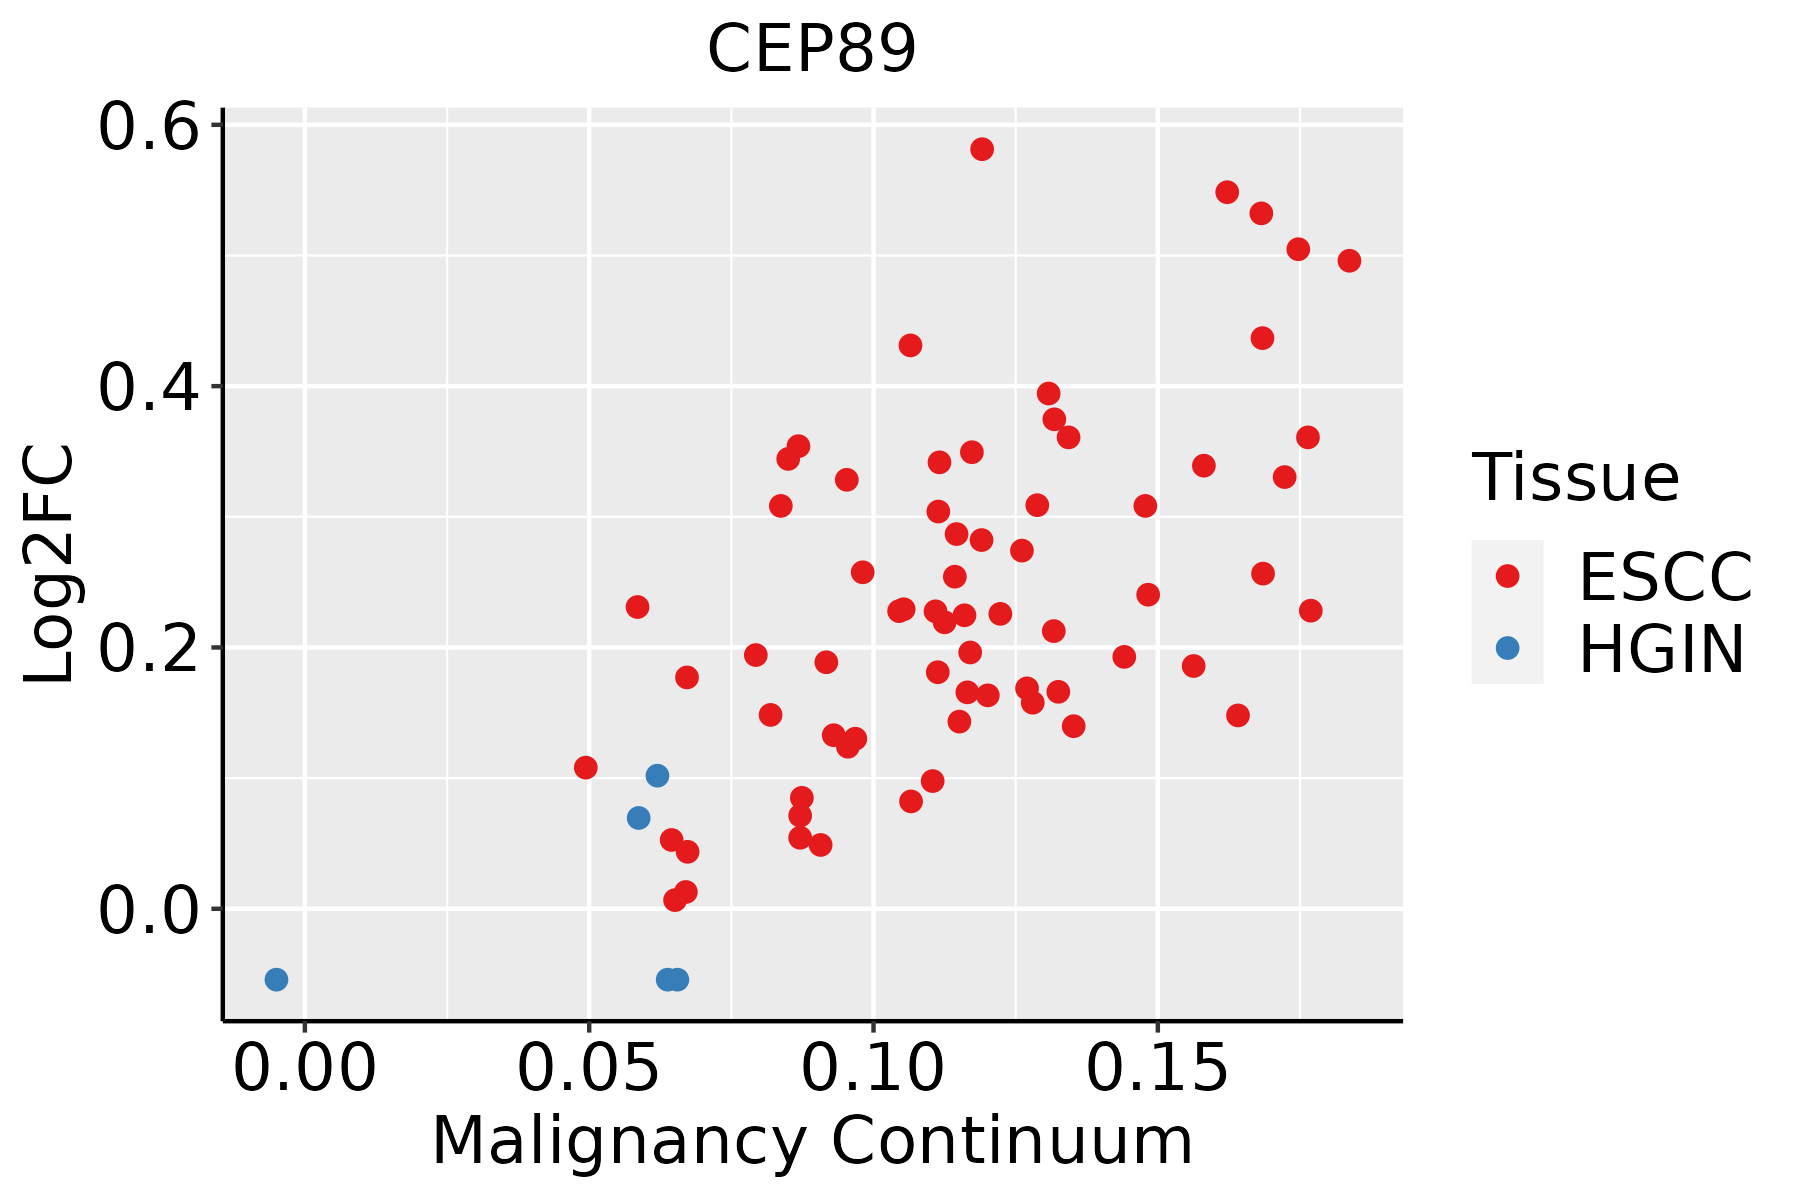 | ESCC: Esophageal squamous cell carcinoma |
| HGIN: High-grade intraepithelial neoplasias | ||
| LGIN: Low-grade intraepithelial neoplasias | ||
| Oral Cavity |  | EOLP: Erosive Oral lichen planus |
| LP: leukoplakia | ||
| NEOLP: Non-erosive oral lichen planus | ||
| OSCC: Oral squamous cell carcinoma | ||
| Thyroid |  | ATC: Anaplastic thyroid cancer |
| HT: Hashimoto's thyroiditis | ||
| PTC: Papillary thyroid cancer |
| ∗log2FC in expression of this searched gene in stem-like cells from each diseased tissue sample relative to stem-like cells in normal samples in each tissue plotted against the malignancy continuum. Samples are colored based on if they are from different disease stage. |
Top |
Malignant transformation related pathway analysis |
| Find out the enriched GO biological processes and KEGG pathways involved in transition from healthy to precancer to cancer |
| Tissue | Disease Stage | Enriched GO biological Processes |
| Colorectum | AD |  |
| Colorectum | SER |  |
| Colorectum | MSS |  |
| Colorectum | MSI-H |  |
| Colorectum | FAP |  |
| ∗Top 15 enriched GO BP terms are showed in the bar plot of each disease state in each tissue. Each row represents a significant GO biological process which is colored according to the -log10(p.adjust). |
| Page: 1 2 3 4 5 6 7 8 9 |
| GO ID | Tissue | Disease Stage | Description | Gene Ratio | Bg Ratio | pvalue | p.adjust | Count |
| GO:19055153 | Esophagus | ESCC | non-motile cilium assembly | 39/8552 | 61/18723 | 3.08e-03 | 1.28e-02 | 39 |
| Page: 1 |
| Pathway ID | Tissue | Disease Stage | Description | Gene Ratio | Bg Ratio | pvalue | p.adjust | qvalue | Count |
| Page: 1 |
Top |
Cell-cell communication analysis |
| Identification of potential cell-cell interactions between two cell types and their ligand-receptor pairs for different disease states |
| Ligand | Receptor | LRpair | Pathway | Tissue | Disease Stage |
| Page: 1 |
Top |
Single-cell gene regulatory network inference analysis |
| Find out the significant the regulons (TFs) and the target genes of each regulon across cell types for different disease states |
| TF | Cell Type | Tissue | Disease Stage | Target Gene | RSS | Regulon Activity |
| ∗The dot plots of a searched regulon are shown for all cell subpopulations in each disease state of each tissue based on the regulon specific score inferred using pySCENIC and by calculating the average expression. |
| Page: 1 |
Top |
Somatic mutation of malignant transformation related genes |
| Annotation of somatic variants for genes involved in malignant transformation |
| Hugo Symbol | Variant Class | Variant Classification | dbSNP RS | HGVSc | HGVSp | HGVSp Short | SWISSPROT | BIOTYPE | SIFT | PolyPhen | Tumor Sample Barcode | Tissue | Histology | Sex | Age | Stage | Therapy Types | Drugs | Outcome |
| CEP89 | SNV | Missense_Mutation | c.1252N>C | p.Val418Leu | p.V418L | Q96ST8 | protein_coding | deleterious(0.02) | benign(0.009) | TCGA-A2-A0EQ-01 | Breast | breast invasive carcinoma | Female | <65 | I/II | Chemotherapy | adriamycin | SD | |
| CEP89 | SNV | Missense_Mutation | c.169N>G | p.Leu57Val | p.L57V | Q96ST8 | protein_coding | deleterious(0) | probably_damaging(0.997) | TCGA-A2-A0YK-01 | Breast | breast invasive carcinoma | Female | <65 | I/II | Chemotherapy | cytoxan | SD | |
| CEP89 | SNV | Missense_Mutation | c.1837N>A | p.Glu613Lys | p.E613K | Q96ST8 | protein_coding | deleterious(0.02) | benign(0.034) | TCGA-A8-A081-01 | Breast | breast invasive carcinoma | Female | >=65 | I/II | Unknown | Unknown | SD | |
| CEP89 | SNV | Missense_Mutation | novel | c.960N>C | p.Met320Ile | p.M320I | Q96ST8 | protein_coding | deleterious(0.04) | possibly_damaging(0.592) | TCGA-AC-A3BB-01 | Breast | breast invasive carcinoma | Female | <65 | III/IV | Chemotherapy | cytoxan | CR |
| CEP89 | SNV | Missense_Mutation | c.379N>C | p.Glu127Gln | p.E127Q | Q96ST8 | protein_coding | deleterious(0.01) | possibly_damaging(0.585) | TCGA-DR-A0ZM-01 | Cervix | cervical & endocervical cancer | Female | <65 | III/IV | Unspecific | Cisplatin | SD | |
| CEP89 | SNV | Missense_Mutation | rs759032645 | c.2335C>T | p.His779Tyr | p.H779Y | Q96ST8 | protein_coding | tolerated(1) | benign(0) | TCGA-FU-A3HY-01 | Cervix | cervical & endocervical cancer | Female | <65 | I/II | Chemotherapy | cisplatin | CR |
| CEP89 | SNV | Missense_Mutation | c.1137N>C | p.Glu379Asp | p.E379D | Q96ST8 | protein_coding | deleterious(0.01) | probably_damaging(0.998) | TCGA-IR-A3LK-01 | Cervix | cervical & endocervical cancer | Female | >=65 | I/II | Chemotherapy | cisplatin | PD | |
| CEP89 | SNV | Missense_Mutation | c.799N>T | p.Ala267Ser | p.A267S | Q96ST8 | protein_coding | tolerated(0.45) | benign(0.073) | TCGA-A6-2686-01 | Colorectum | colon adenocarcinoma | Female | >=65 | I/II | Unknown | Unknown | SD | |
| CEP89 | SNV | Missense_Mutation | rs537113854 | c.2278N>A | p.Val760Ile | p.V760I | Q96ST8 | protein_coding | tolerated(1) | benign(0) | TCGA-A6-6781-01 | Colorectum | colon adenocarcinoma | Male | <65 | III/IV | Chemotherapy | oxaliplatin | SD |
| CEP89 | SNV | Missense_Mutation | c.307N>G | p.Pro103Ala | p.P103A | Q96ST8 | protein_coding | tolerated(0.1) | benign(0.05) | TCGA-AA-3666-01 | Colorectum | colon adenocarcinoma | Male | >=65 | III/IV | Unknown | Unknown | PD |
| Page: 1 2 3 4 5 6 7 8 |
Top |
Related drugs of malignant transformation related genes |
| Identification of chemicals and drugs interact with genes involved in malignant transfromation |
| (DGIdb 4.0) |
| Entrez ID | Symbol | Category | Interaction Types | Drug Claim Name | Drug Name | PMIDs |
| Page: 1 |

Copyright 2023-Present -The University of Texas Health Science Center at Houston |