
|
|||||
|
 | |
| |
| |
| |
| |
| |
|
Gene: CEP85L |
Gene summary for CEP85L |
| Gene information | Species | Human | Gene symbol | CEP85L | Gene ID | 387119 |
| Gene name | centrosomal protein 85 like | |
| Gene Alias | C6orf204 | |
| Cytomap | 6q22.31 | |
| Gene Type | protein-coding | GO ID | GO:0001764 | UniProtAcc | Q3ZCQ5 |
Top |
Malignant transformation analysis |
| Identification of the aberrant gene expression in precancerous and cancerous lesions by comparing the gene expression of stem-like cells in diseased tissues with normal stem cells |
| Entrez ID | Symbol | Replicates | Species | Organ | Tissue | Adj P-value | Log2FC | Malignancy |
| 387119 | CEP85L | HTA11_3410_2000001011 | Human | Colorectum | AD | 7.29e-10 | 1.22e-01 | 0.0155 |
| 387119 | CEP85L | HTA11_2487_2000001011 | Human | Colorectum | SER | 3.19e-03 | 2.08e-01 | -0.1808 |
| 387119 | CEP85L | HTA11_1938_2000001011 | Human | Colorectum | AD | 1.15e-09 | 2.67e-01 | -0.0811 |
| 387119 | CEP85L | HTA11_347_2000001011 | Human | Colorectum | AD | 3.87e-04 | 9.01e-02 | -0.1954 |
| 387119 | CEP85L | HTA11_411_2000001011 | Human | Colorectum | SER | 3.74e-03 | 3.26e-01 | -0.2602 |
| 387119 | CEP85L | HTA11_2112_2000001011 | Human | Colorectum | SER | 8.61e-04 | 3.83e-01 | -0.2196 |
| 387119 | CEP85L | HTA11_3361_2000001011 | Human | Colorectum | AD | 2.96e-06 | 2.57e-01 | -0.1207 |
| 387119 | CEP85L | HTA11_83_2000001011 | Human | Colorectum | SER | 4.56e-04 | 1.76e-01 | -0.1526 |
| 387119 | CEP85L | HTA11_696_2000001011 | Human | Colorectum | AD | 4.00e-21 | 4.38e-01 | -0.1464 |
| 387119 | CEP85L | HTA11_1391_2000001011 | Human | Colorectum | AD | 7.29e-17 | 4.31e-01 | -0.059 |
| 387119 | CEP85L | HTA11_2992_2000001011 | Human | Colorectum | SER | 2.84e-06 | 3.14e-01 | -0.1706 |
| 387119 | CEP85L | HTA11_5212_2000001011 | Human | Colorectum | AD | 1.49e-02 | 1.73e-01 | -0.2061 |
| 387119 | CEP85L | HTA11_5216_2000001011 | Human | Colorectum | SER | 3.17e-08 | 4.73e-01 | -0.1462 |
| 387119 | CEP85L | HTA11_546_2000001011 | Human | Colorectum | AD | 4.57e-08 | 2.91e-01 | -0.0842 |
| 387119 | CEP85L | HTA11_6818_2000001011 | Human | Colorectum | AD | 1.69e-02 | 2.14e-01 | 0.0112 |
| 387119 | CEP85L | HTA11_6818_2000001021 | Human | Colorectum | AD | 6.86e-05 | 2.00e-01 | 0.0588 |
| 387119 | CEP85L | HTA11_99999970781_79442 | Human | Colorectum | MSS | 1.30e-03 | 9.85e-02 | 0.294 |
| 387119 | CEP85L | PTC04 | Human | Thyroid | PTC | 1.97e-02 | 6.04e-02 | 0.1927 |
| 387119 | CEP85L | PTC06 | Human | Thyroid | PTC | 3.76e-03 | 1.53e-01 | 0.2057 |
| 387119 | CEP85L | PTC07 | Human | Thyroid | PTC | 1.25e-05 | 1.07e-01 | 0.2044 |
| Page: 1 2 |
| Tissue | Expression Dynamics | Abbreviation |
| Colorectum (GSE201348) |  | FAP: Familial adenomatous polyposis |
| CRC: Colorectal cancer | ||
| Colorectum (HTA11) |  | AD: Adenomas |
| SER: Sessile serrated lesions | ||
| MSI-H: Microsatellite-high colorectal cancer | ||
| MSS: Microsatellite stable colorectal cancer | ||
| Thyroid | 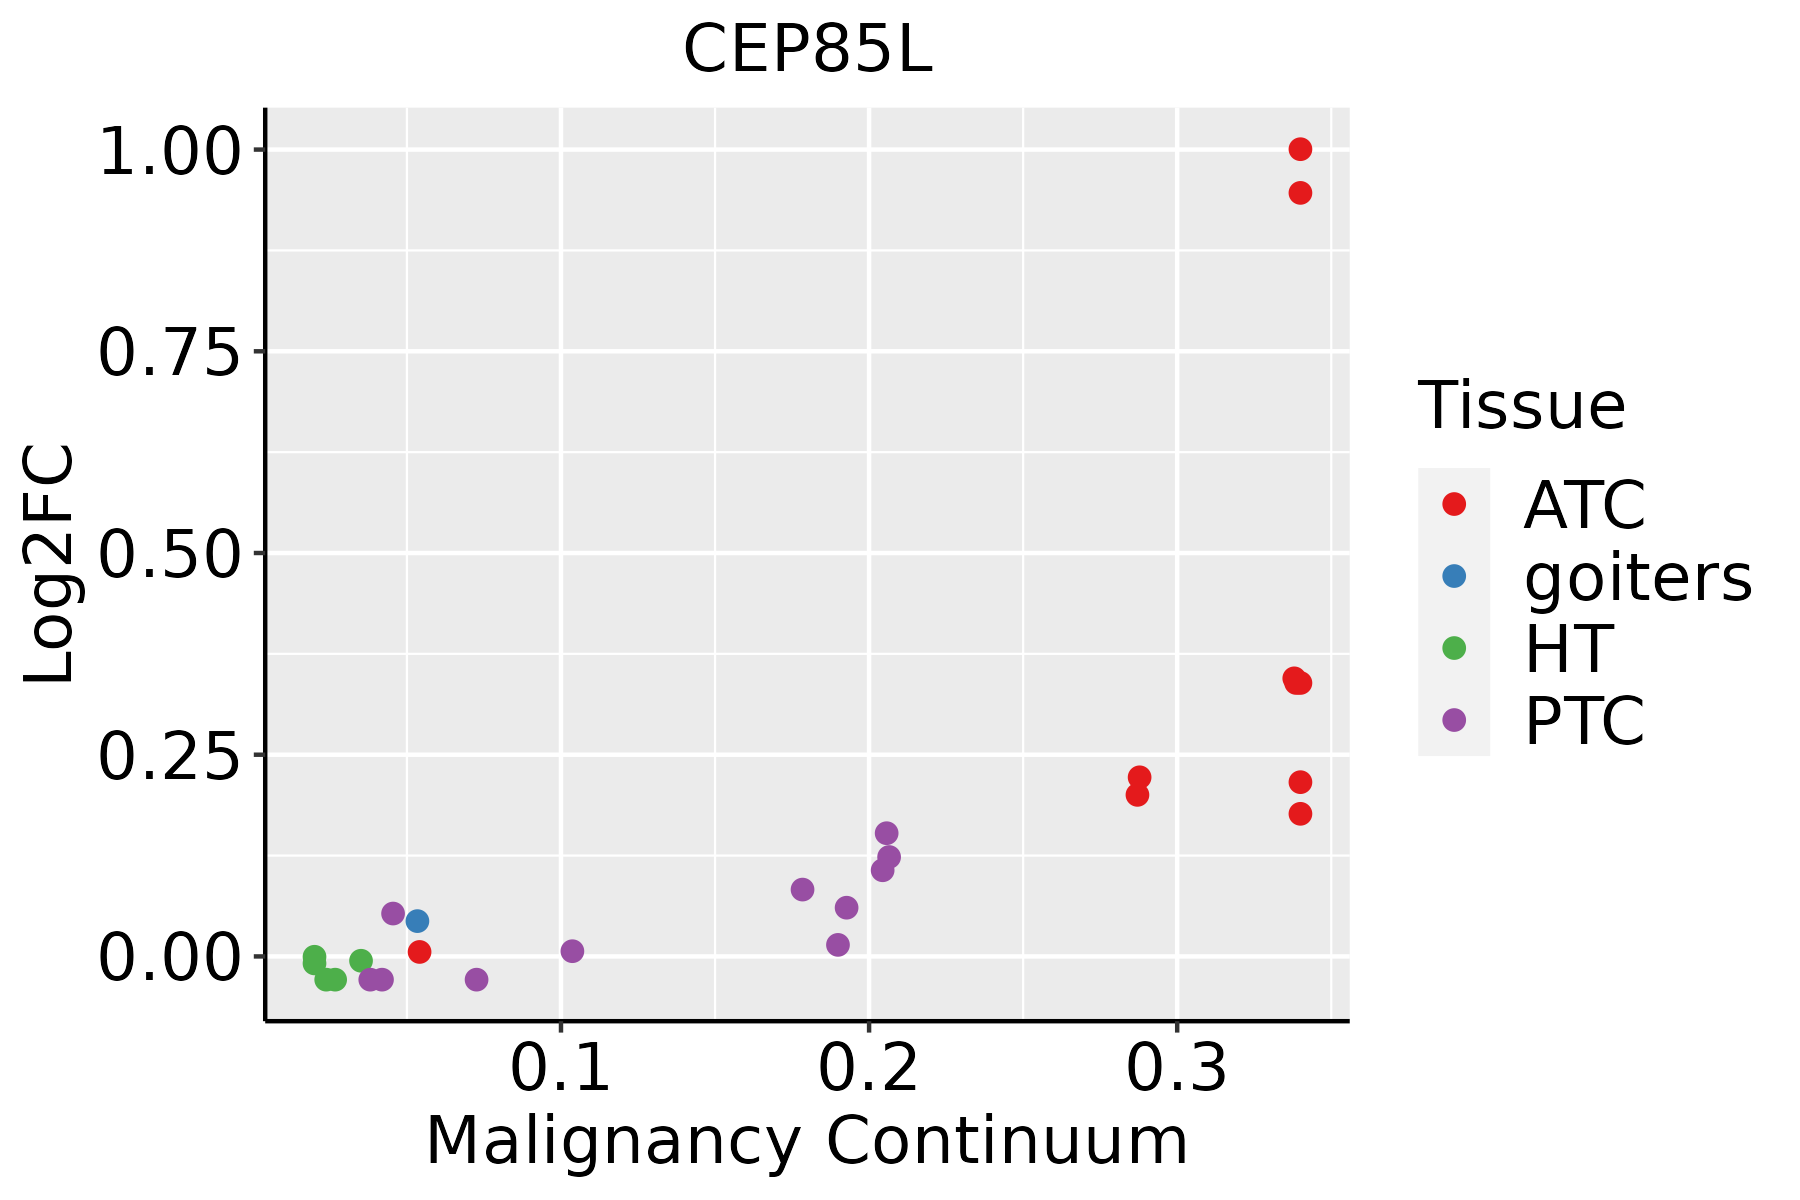 | ATC: Anaplastic thyroid cancer |
| HT: Hashimoto's thyroiditis | ||
| PTC: Papillary thyroid cancer |
| ∗log2FC in expression of this searched gene in stem-like cells from each diseased tissue sample relative to stem-like cells in normal samples in each tissue plotted against the malignancy continuum. Samples are colored based on if they are from different disease stage. |
Top |
Malignant transformation related pathway analysis |
| Find out the enriched GO biological processes and KEGG pathways involved in transition from healthy to precancer to cancer |
| Tissue | Disease Stage | Enriched GO biological Processes |
| Colorectum | AD |  |
| Colorectum | SER |  |
| Colorectum | MSS |  |
| Colorectum | MSI-H |  |
| Colorectum | FAP |  |
| ∗Top 15 enriched GO BP terms are showed in the bar plot of each disease state in each tissue. Each row represents a significant GO biological process which is colored according to the -log10(p.adjust). |
| Page: 1 2 3 4 5 6 7 8 9 |
| GO ID | Tissue | Disease Stage | Description | Gene Ratio | Bg Ratio | pvalue | p.adjust | Count |
| Page: 1 |
| Pathway ID | Tissue | Disease Stage | Description | Gene Ratio | Bg Ratio | pvalue | p.adjust | qvalue | Count |
| Page: 1 |
Top |
Cell-cell communication analysis |
| Identification of potential cell-cell interactions between two cell types and their ligand-receptor pairs for different disease states |
| Ligand | Receptor | LRpair | Pathway | Tissue | Disease Stage |
| Page: 1 |
Top |
Single-cell gene regulatory network inference analysis |
| Find out the significant the regulons (TFs) and the target genes of each regulon across cell types for different disease states |
| TF | Cell Type | Tissue | Disease Stage | Target Gene | RSS | Regulon Activity |
| ∗The dot plots of a searched regulon are shown for all cell subpopulations in each disease state of each tissue based on the regulon specific score inferred using pySCENIC and by calculating the average expression. |
| Page: 1 |
Top |
Somatic mutation of malignant transformation related genes |
| Annotation of somatic variants for genes involved in malignant transformation |
| Hugo Symbol | Variant Class | Variant Classification | dbSNP RS | HGVSc | HGVSp | HGVSp Short | SWISSPROT | BIOTYPE | SIFT | PolyPhen | Tumor Sample Barcode | Tissue | Histology | Sex | Age | Stage | Therapy Types | Drugs | Outcome |
| CEP85L | SNV | Missense_Mutation | c.209N>C | p.Gly70Ala | p.G70A | Q5SZL2 | protein_coding | tolerated(0.1) | probably_damaging(0.999) | TCGA-A7-A13G-01 | Breast | breast invasive carcinoma | Female | >=65 | I/II | Hormone Therapy | arimidex | PD | |
| CEP85L | SNV | Missense_Mutation | c.227C>G | p.Ser76Cys | p.S76C | Q5SZL2 | protein_coding | deleterious(0) | probably_damaging(0.999) | TCGA-AC-A23H-01 | Breast | breast invasive carcinoma | Female | >=65 | I/II | Unknown | Unknown | PD | |
| CEP85L | SNV | Missense_Mutation | rs140573157 | c.889N>A | p.Val297Ile | p.V297I | Q5SZL2 | protein_coding | tolerated(0.1) | benign(0.071) | TCGA-D8-A1Y1-01 | Breast | breast invasive carcinoma | Female | >=65 | III/IV | Hormone Therapy | tamoxiphen | PD |
| CEP85L | insertion | In_Frame_Ins | novel | c.242-1_242insCATCTCCATACT | p.Asp81delinsAlaSerProTyrTyr | p.D81delinsASPYY | Q5SZL2 | protein_coding | TCGA-B6-A0IE-01 | Breast | breast invasive carcinoma | Female | <65 | III/IV | Unknown | Unknown | PD | ||
| CEP85L | deletion | Frame_Shift_Del | novel | c.2177delN | p.Leu726CysfsTer4 | p.L726Cfs*4 | Q5SZL2 | protein_coding | TCGA-D8-A27V-01 | Breast | breast invasive carcinoma | Female | <65 | I/II | Hormone Therapy | tamoxiphen | SD | ||
| CEP85L | deletion | Frame_Shift_Del | c.1515delN | p.Glu506LysfsTer19 | p.E506Kfs*19 | Q5SZL2 | protein_coding | TCGA-D8-A27V-01 | Breast | breast invasive carcinoma | Female | <65 | I/II | Hormone Therapy | tamoxiphen | SD | |||
| CEP85L | SNV | Missense_Mutation | c.2422C>G | p.Gln808Glu | p.Q808E | Q5SZL2 | protein_coding | deleterious(0) | probably_damaging(0.987) | TCGA-UC-A7PF-01 | Cervix | cervical & endocervical cancer | Female | <65 | I/II | Unknown | Unknown | SD | |
| CEP85L | SNV | Missense_Mutation | novel | c.1943N>T | p.Ser648Phe | p.S648F | Q5SZL2 | protein_coding | tolerated(0.68) | benign(0.219) | TCGA-VS-A94Z-01 | Cervix | cervical & endocervical cancer | Female | <65 | I/II | Chemotherapy | cisplatin | CR |
| CEP85L | SNV | Missense_Mutation | c.350N>G | p.Leu117Arg | p.L117R | Q5SZL2 | protein_coding | tolerated(0.26) | benign(0.033) | TCGA-VS-A9V4-01 | Cervix | cervical & endocervical cancer | Female | <65 | I/II | Chemotherapy | cisplatin | PD | |
| CEP85L | SNV | Missense_Mutation | c.1655N>G | p.Glu552Gly | p.E552G | Q5SZL2 | protein_coding | deleterious(0) | possibly_damaging(0.9) | TCGA-AA-3492-01 | Colorectum | colon adenocarcinoma | Female | >=65 | I/II | Unknown | Unknown | SD |
| Page: 1 2 3 4 5 6 7 8 9 10 11 12 |
Top |
Related drugs of malignant transformation related genes |
| Identification of chemicals and drugs interact with genes involved in malignant transfromation |
| (DGIdb 4.0) |
| Entrez ID | Symbol | Category | Interaction Types | Drug Claim Name | Drug Name | PMIDs |
| Page: 1 |

Copyright 2023-Present -The University of Texas Health Science Center at Houston |