
|
|||||
|
 | |
| |
| |
| |
| |
| |
|
Gene: CEP63 |
Gene summary for CEP63 |
| Gene information | Species | Human | Gene symbol | CEP63 | Gene ID | 80254 |
| Gene name | centrosomal protein 63 | |
| Gene Alias | SCKL6 | |
| Cytomap | 3q22.2 | |
| Gene Type | protein-coding | GO ID | GO:0000075 | UniProtAcc | Q96MT8 |
Top |
Malignant transformation analysis |
| Identification of the aberrant gene expression in precancerous and cancerous lesions by comparing the gene expression of stem-like cells in diseased tissues with normal stem cells |
| Entrez ID | Symbol | Replicates | Species | Organ | Tissue | Adj P-value | Log2FC | Malignancy |
| 80254 | CEP63 | LZE2T | Human | Esophagus | ESCC | 1.44e-03 | 7.95e-01 | 0.082 |
| 80254 | CEP63 | LZE4T | Human | Esophagus | ESCC | 1.43e-16 | 4.54e-01 | 0.0811 |
| 80254 | CEP63 | LZE7T | Human | Esophagus | ESCC | 4.30e-04 | 4.16e-01 | 0.0667 |
| 80254 | CEP63 | LZE8T | Human | Esophagus | ESCC | 9.81e-05 | 1.06e-01 | 0.067 |
| 80254 | CEP63 | LZE20T | Human | Esophagus | ESCC | 1.84e-02 | 1.69e-01 | 0.0662 |
| 80254 | CEP63 | LZE22T | Human | Esophagus | ESCC | 1.13e-03 | 3.80e-01 | 0.068 |
| 80254 | CEP63 | LZE24T | Human | Esophagus | ESCC | 6.10e-20 | 3.60e-01 | 0.0596 |
| 80254 | CEP63 | LZE6T | Human | Esophagus | ESCC | 6.47e-03 | 1.43e-01 | 0.0845 |
| 80254 | CEP63 | P1T-E | Human | Esophagus | ESCC | 3.28e-10 | 5.24e-01 | 0.0875 |
| 80254 | CEP63 | P2T-E | Human | Esophagus | ESCC | 3.40e-73 | 1.11e+00 | 0.1177 |
| 80254 | CEP63 | P4T-E | Human | Esophagus | ESCC | 1.45e-33 | 8.58e-01 | 0.1323 |
| 80254 | CEP63 | P5T-E | Human | Esophagus | ESCC | 1.97e-24 | 4.89e-01 | 0.1327 |
| 80254 | CEP63 | P8T-E | Human | Esophagus | ESCC | 3.57e-26 | 4.51e-01 | 0.0889 |
| 80254 | CEP63 | P9T-E | Human | Esophagus | ESCC | 1.44e-09 | 3.30e-01 | 0.1131 |
| 80254 | CEP63 | P10T-E | Human | Esophagus | ESCC | 9.79e-34 | 7.09e-01 | 0.116 |
| 80254 | CEP63 | P11T-E | Human | Esophagus | ESCC | 3.22e-03 | 2.88e-01 | 0.1426 |
| 80254 | CEP63 | P12T-E | Human | Esophagus | ESCC | 3.50e-30 | 5.60e-01 | 0.1122 |
| 80254 | CEP63 | P15T-E | Human | Esophagus | ESCC | 1.43e-22 | 4.96e-01 | 0.1149 |
| 80254 | CEP63 | P16T-E | Human | Esophagus | ESCC | 8.96e-42 | 6.55e-01 | 0.1153 |
| 80254 | CEP63 | P17T-E | Human | Esophagus | ESCC | 1.10e-07 | 3.26e-01 | 0.1278 |
| Page: 1 2 3 4 5 6 |
| Tissue | Expression Dynamics | Abbreviation |
| Esophagus |  | ESCC: Esophageal squamous cell carcinoma |
| HGIN: High-grade intraepithelial neoplasias | ||
| LGIN: Low-grade intraepithelial neoplasias | ||
| Liver | 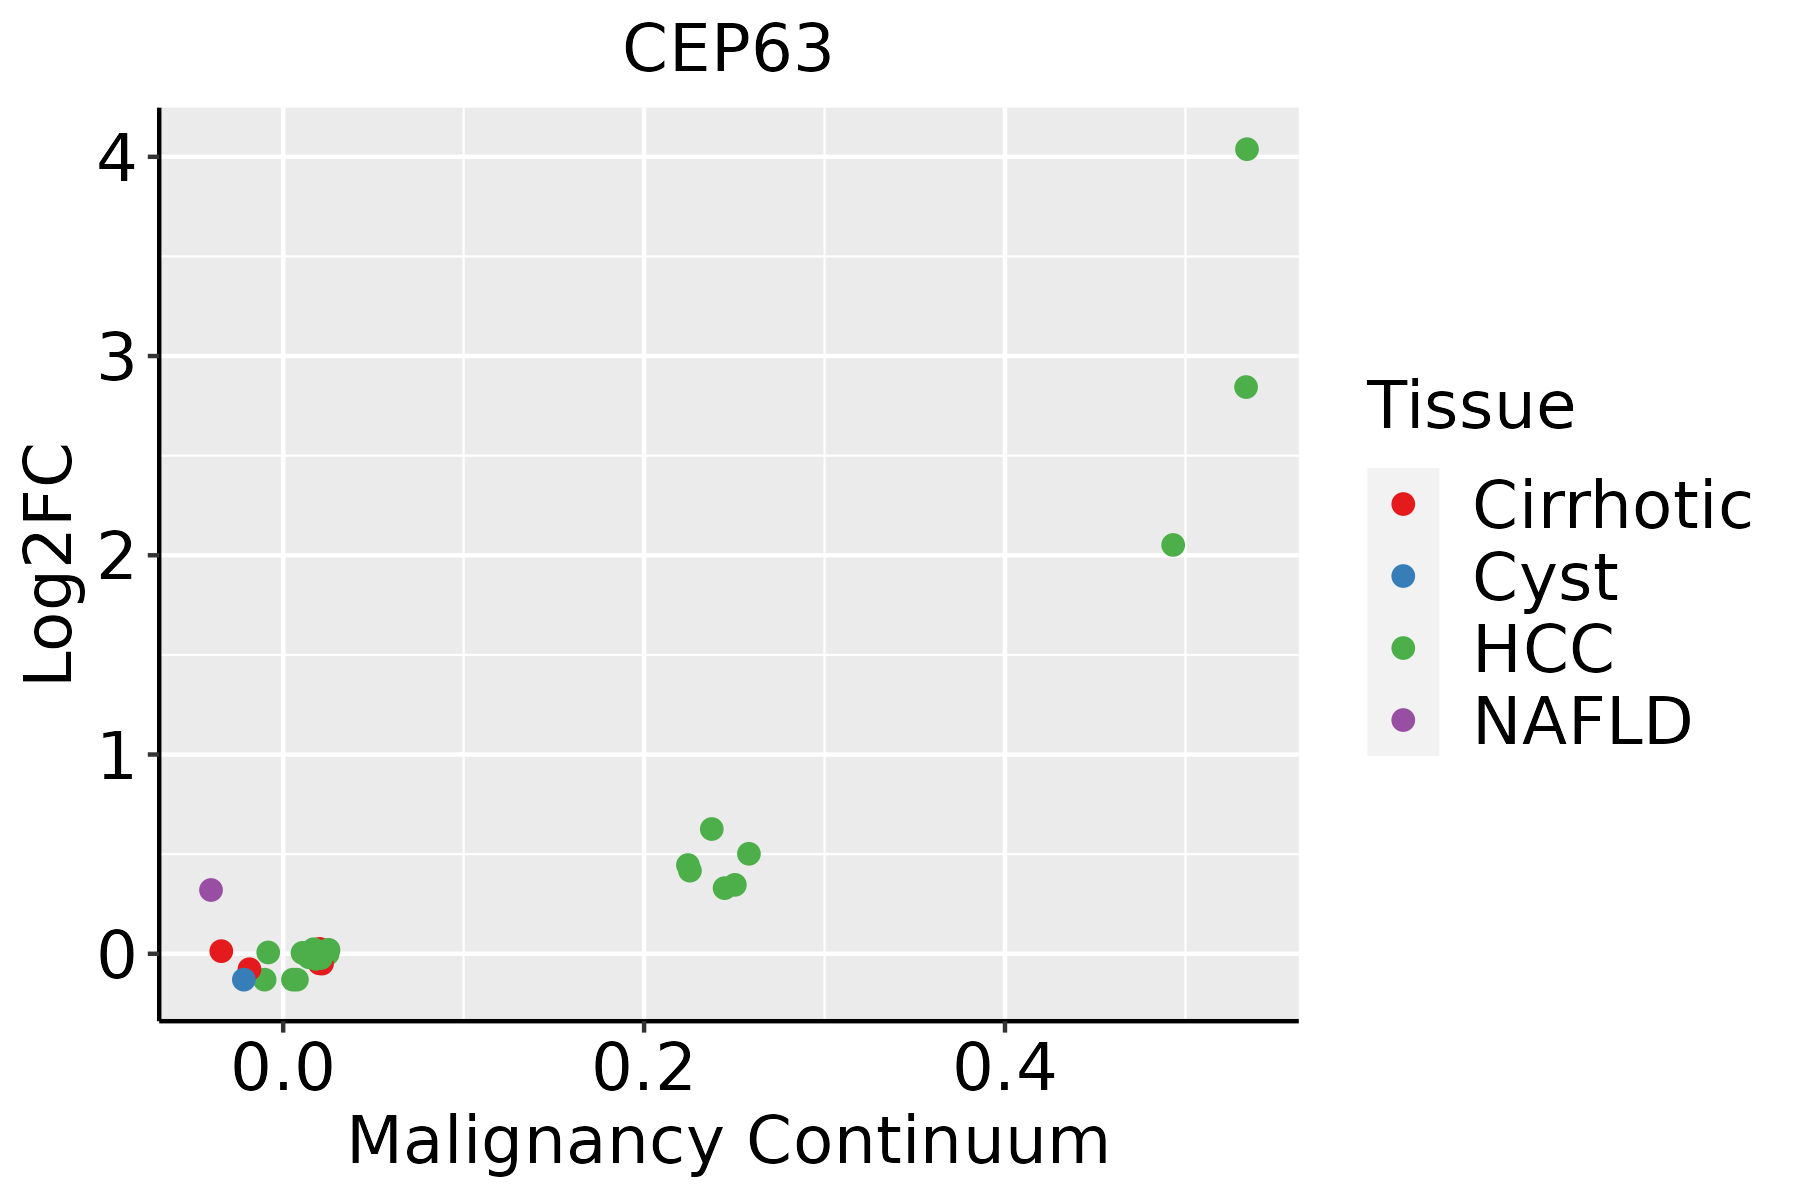 | HCC: Hepatocellular carcinoma |
| NAFLD: Non-alcoholic fatty liver disease | ||
| Oral Cavity | 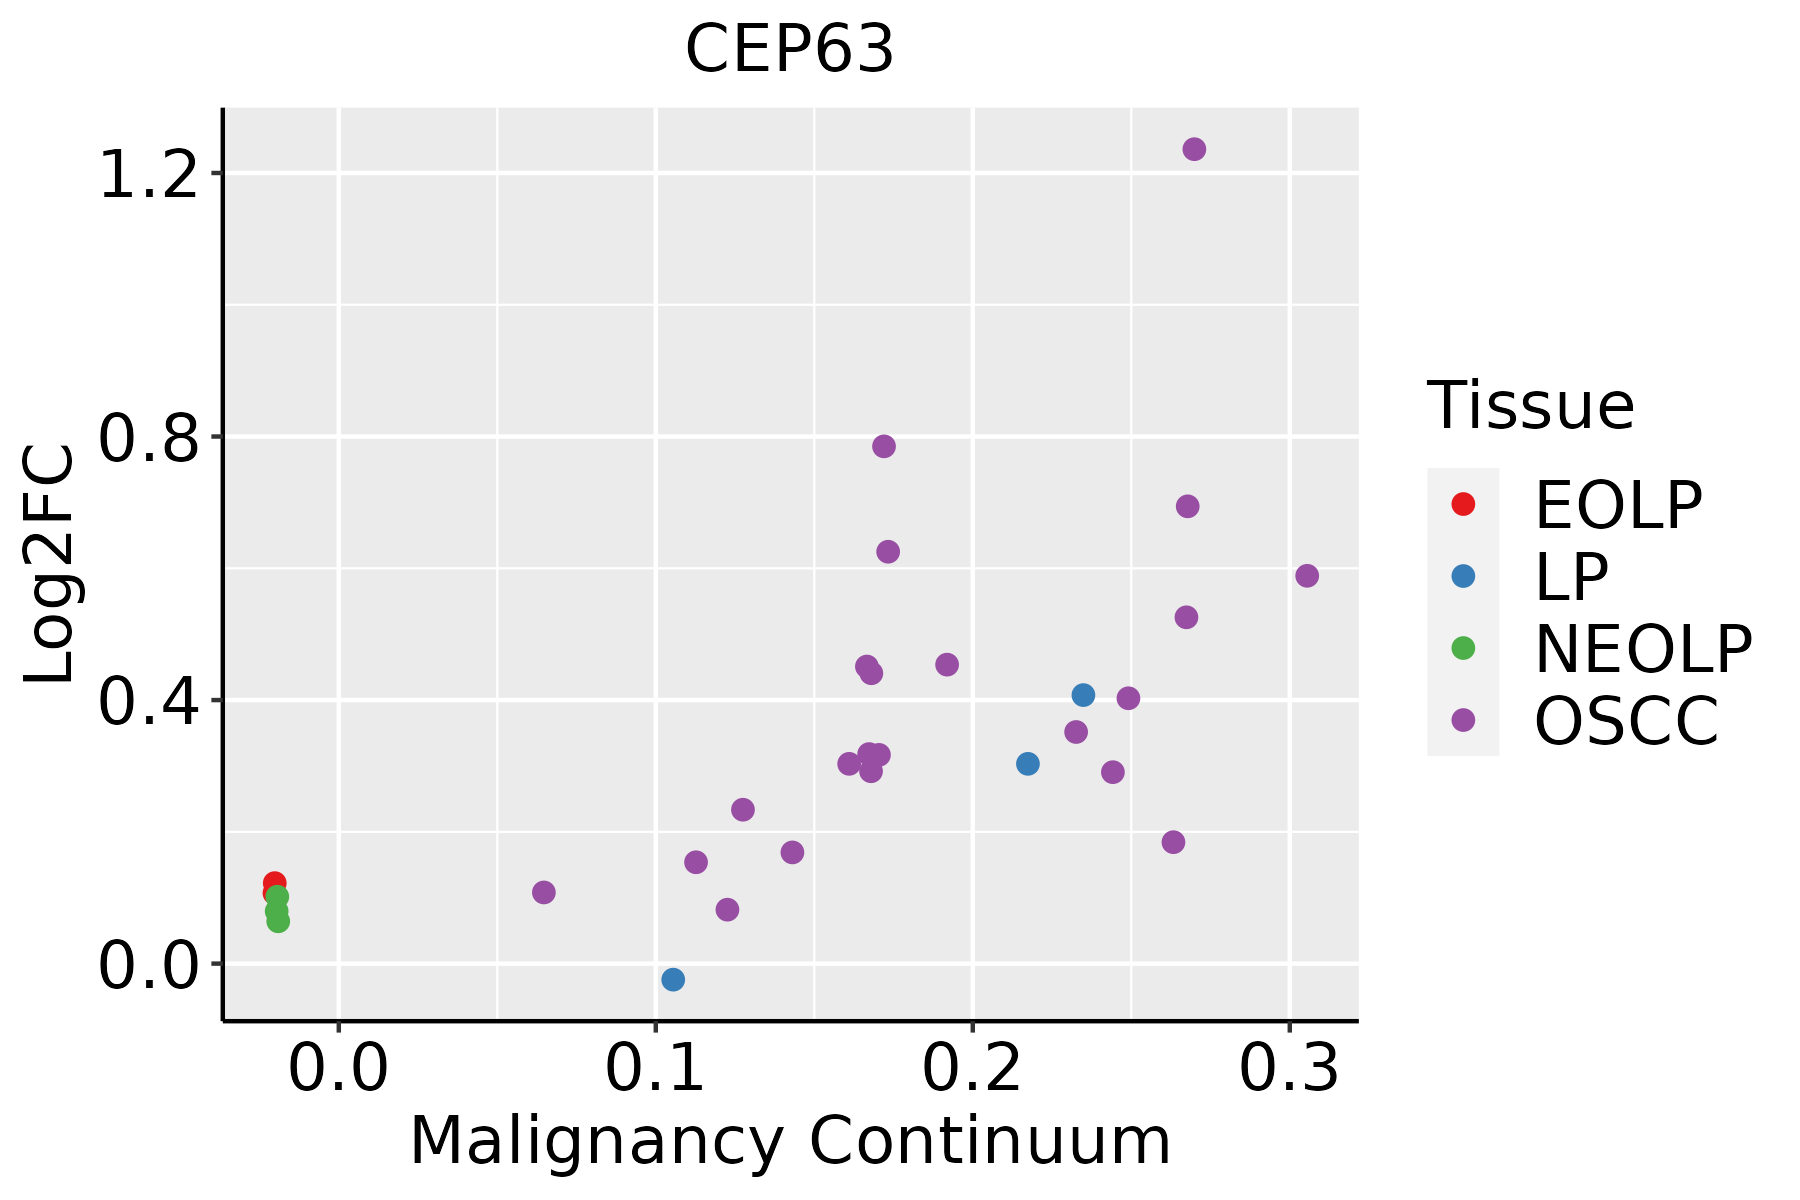 | EOLP: Erosive Oral lichen planus |
| LP: leukoplakia | ||
| NEOLP: Non-erosive oral lichen planus | ||
| OSCC: Oral squamous cell carcinoma | ||
| Thyroid | 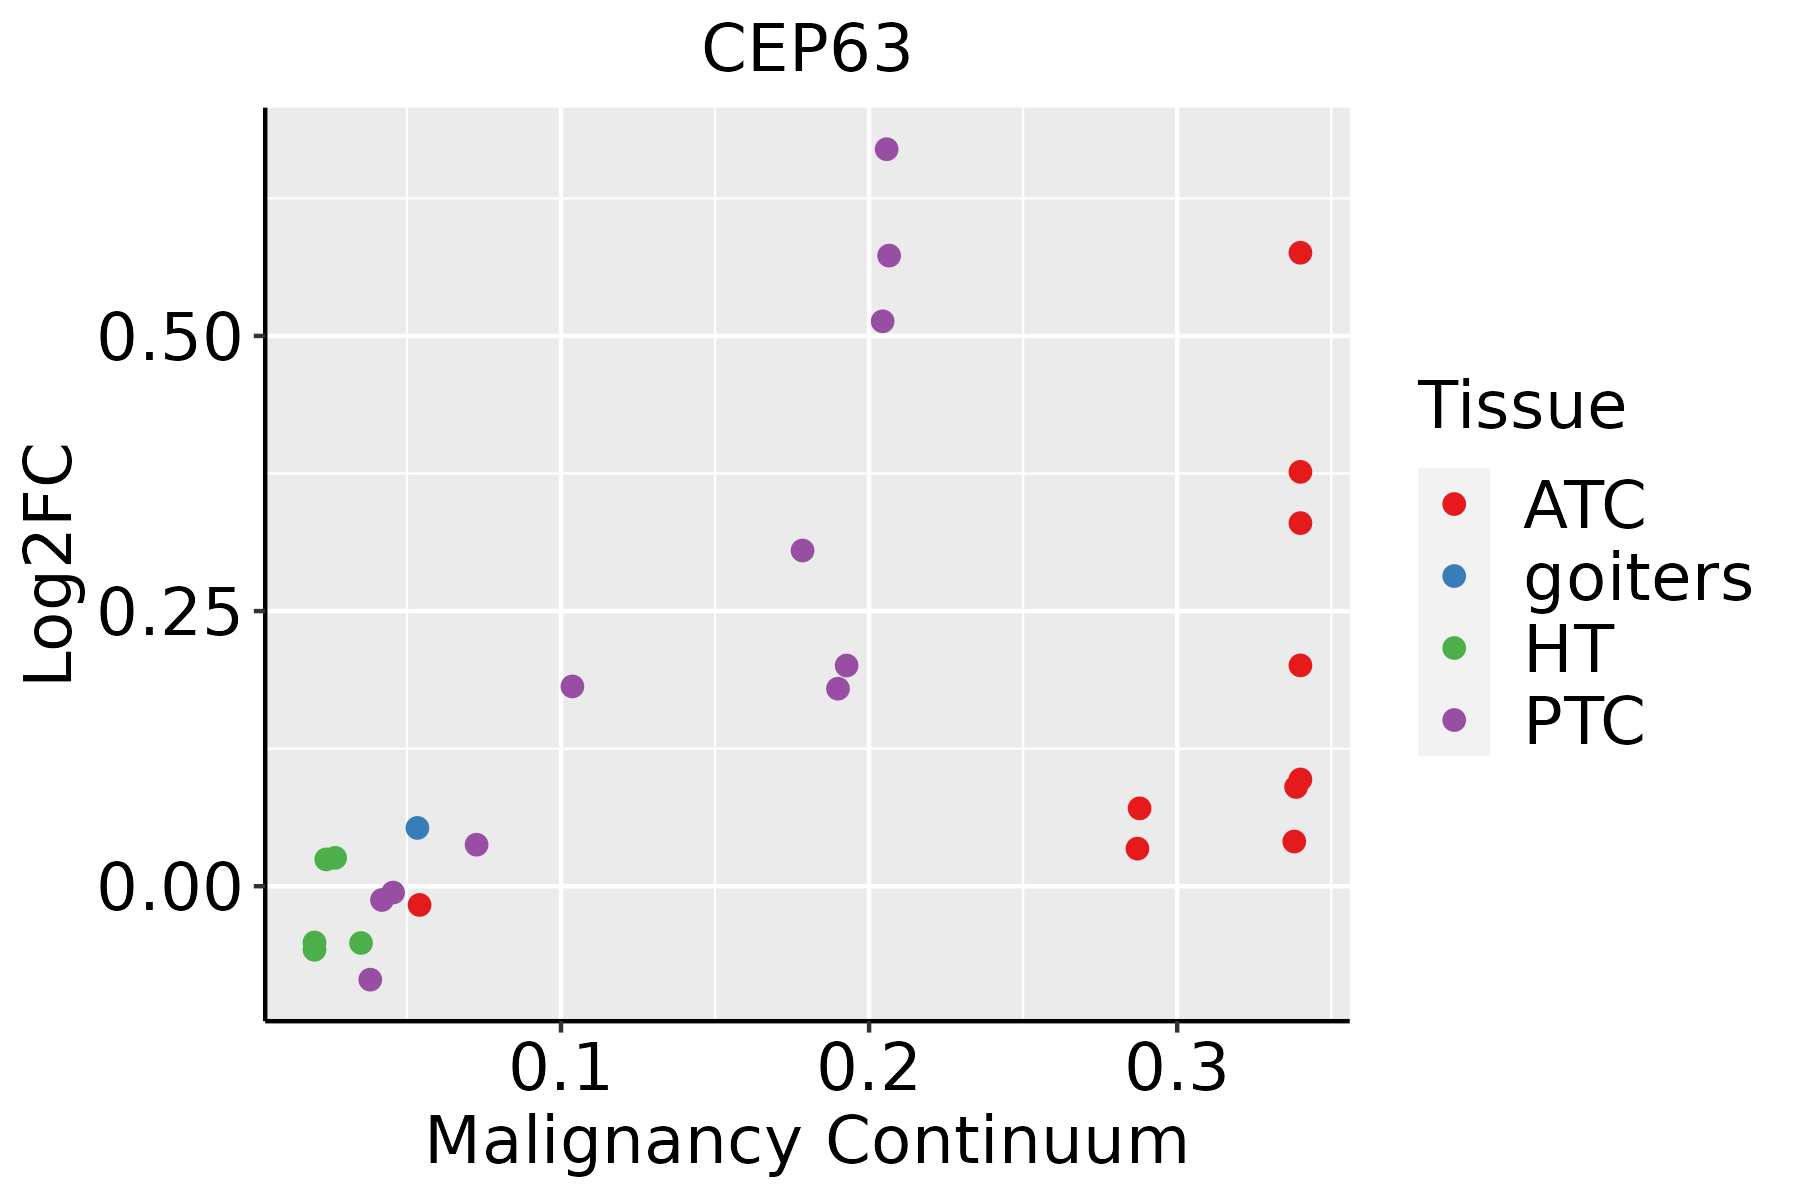 | ATC: Anaplastic thyroid cancer |
| HT: Hashimoto's thyroiditis | ||
| PTC: Papillary thyroid cancer |
| ∗log2FC in expression of this searched gene in stem-like cells from each diseased tissue sample relative to stem-like cells in normal samples in each tissue plotted against the malignancy continuum. Samples are colored based on if they are from different disease stage. |
Top |
Malignant transformation related pathway analysis |
| Find out the enriched GO biological processes and KEGG pathways involved in transition from healthy to precancer to cancer |
| Tissue | Disease Stage | Enriched GO biological Processes |
| Colorectum | AD |  |
| Colorectum | SER |  |
| Colorectum | MSS |  |
| Colorectum | MSI-H |  |
| Colorectum | FAP |  |
| ∗Top 15 enriched GO BP terms are showed in the bar plot of each disease state in each tissue. Each row represents a significant GO biological process which is colored according to the -log10(p.adjust). |
| Page: 1 2 3 4 5 6 7 8 9 |
| GO ID | Tissue | Disease Stage | Description | Gene Ratio | Bg Ratio | pvalue | p.adjust | Count |
| GO:000705114 | Esophagus | ESCC | spindle organization | 134/8552 | 184/18723 | 5.70e-14 | 2.87e-12 | 134 |
| GO:190198713 | Esophagus | ESCC | regulation of cell cycle phase transition | 242/8552 | 390/18723 | 3.86e-11 | 1.26e-09 | 242 |
| GO:00457865 | Esophagus | ESCC | negative regulation of cell cycle | 236/8552 | 385/18723 | 3.62e-10 | 9.93e-09 | 236 |
| GO:00000754 | Esophagus | ESCC | cell cycle checkpoint | 117/8552 | 169/18723 | 4.47e-10 | 1.17e-08 | 117 |
| GO:004277014 | Esophagus | ESCC | signal transduction in response to DNA damage | 117/8552 | 172/18723 | 2.38e-09 | 5.32e-08 | 117 |
| GO:00512256 | Esophagus | ESCC | spindle assembly | 85/8552 | 117/18723 | 2.72e-09 | 5.98e-08 | 85 |
| GO:00109484 | Esophagus | ESCC | negative regulation of cell cycle process | 177/8552 | 294/18723 | 3.26e-07 | 4.59e-06 | 177 |
| GO:00315705 | Esophagus | ESCC | DNA integrity checkpoint | 83/8552 | 123/18723 | 8.17e-07 | 1.06e-05 | 83 |
| GO:00000775 | Esophagus | ESCC | DNA damage checkpoint | 78/8552 | 115/18723 | 1.27e-06 | 1.56e-05 | 78 |
| GO:19019883 | Esophagus | ESCC | negative regulation of cell cycle phase transition | 151/8552 | 249/18723 | 1.28e-06 | 1.57e-05 | 151 |
| GO:00070982 | Esophagus | ESCC | centrosome cycle | 85/8552 | 130/18723 | 4.41e-06 | 4.69e-05 | 85 |
| GO:00310233 | Esophagus | ESCC | microtubule organizing center organization | 92/8552 | 143/18723 | 5.04e-06 | 5.31e-05 | 92 |
| GO:000705111 | Liver | HCC | spindle organization | 116/7958 | 184/18723 | 1.40e-08 | 3.40e-07 | 116 |
| GO:005122511 | Liver | HCC | spindle assembly | 75/7958 | 117/18723 | 1.92e-06 | 2.67e-05 | 75 |
| GO:19019871 | Liver | HCC | regulation of cell cycle phase transition | 211/7958 | 390/18723 | 2.11e-06 | 2.89e-05 | 211 |
| GO:00427702 | Liver | HCC | signal transduction in response to DNA damage | 103/7958 | 172/18723 | 3.05e-06 | 4.04e-05 | 103 |
| GO:00000751 | Liver | HCC | cell cycle checkpoint | 100/7958 | 169/18723 | 8.75e-06 | 1.02e-04 | 100 |
| GO:0045786 | Liver | HCC | negative regulation of cell cycle | 204/7958 | 385/18723 | 1.84e-05 | 1.99e-04 | 204 |
| GO:00000771 | Liver | HCC | DNA damage checkpoint | 68/7958 | 115/18723 | 2.33e-04 | 1.77e-03 | 68 |
| GO:0031023 | Liver | HCC | microtubule organizing center organization | 82/7958 | 143/18723 | 2.38e-04 | 1.79e-03 | 82 |
| Page: 1 2 3 4 |
| Pathway ID | Tissue | Disease Stage | Description | Gene Ratio | Bg Ratio | pvalue | p.adjust | qvalue | Count |
| Page: 1 |
Top |
Cell-cell communication analysis |
| Identification of potential cell-cell interactions between two cell types and their ligand-receptor pairs for different disease states |
| Ligand | Receptor | LRpair | Pathway | Tissue | Disease Stage |
| Page: 1 |
Top |
Single-cell gene regulatory network inference analysis |
| Find out the significant the regulons (TFs) and the target genes of each regulon across cell types for different disease states |
| TF | Cell Type | Tissue | Disease Stage | Target Gene | RSS | Regulon Activity |
| ∗The dot plots of a searched regulon are shown for all cell subpopulations in each disease state of each tissue based on the regulon specific score inferred using pySCENIC and by calculating the average expression. |
| Page: 1 |
Top |
Somatic mutation of malignant transformation related genes |
| Annotation of somatic variants for genes involved in malignant transformation |
| Hugo Symbol | Variant Class | Variant Classification | dbSNP RS | HGVSc | HGVSp | HGVSp Short | SWISSPROT | BIOTYPE | SIFT | PolyPhen | Tumor Sample Barcode | Tissue | Histology | Sex | Age | Stage | Therapy Types | Drugs | Outcome |
| CEP63 | SNV | Missense_Mutation | c.1735N>A | p.His579Asn | p.H579N | Q96MT8 | protein_coding | tolerated(0.32) | benign(0.035) | TCGA-AC-A23H-01 | Breast | breast invasive carcinoma | Female | >=65 | I/II | Unknown | Unknown | PD | |
| CEP63 | SNV | Missense_Mutation | rs369310177 | c.2039N>A | p.Arg680His | p.R680H | Q96MT8 | protein_coding | tolerated(0.06) | probably_damaging(0.992) | TCGA-AN-A046-01 | Breast | breast invasive carcinoma | Female | >=65 | I/II | Unknown | Unknown | SD |
| CEP63 | SNV | Missense_Mutation | novel | c.1034N>G | p.Leu345Arg | p.L345R | Q96MT8 | protein_coding | tolerated(0.4) | probably_damaging(0.919) | TCGA-AR-A2LO-01 | Breast | breast invasive carcinoma | Female | <65 | I/II | Chemotherapy | adriamycin | SD |
| CEP63 | SNV | Missense_Mutation | c.660N>G | p.Ile220Met | p.I220M | Q96MT8 | protein_coding | deleterious(0) | probably_damaging(0.998) | TCGA-BH-A1FN-01 | Breast | breast invasive carcinoma | Female | <65 | I/II | Unknown | Unknown | PD | |
| CEP63 | SNV | Missense_Mutation | novel | c.1438G>A | p.Val480Met | p.V480M | Q96MT8 | protein_coding | deleterious(0.01) | probably_damaging(0.963) | TCGA-2W-A8YY-01 | Cervix | cervical & endocervical cancer | Female | <65 | I/II | Chemotherapy | cisplatin | CR |
| CEP63 | SNV | Missense_Mutation | novel | c.89A>T | p.Lys30Ile | p.K30I | Q96MT8 | protein_coding | deleterious(0) | probably_damaging(0.999) | TCGA-EK-A2RM-01 | Cervix | cervical & endocervical cancer | Female | <65 | I/II | Unknown | Unknown | SD |
| CEP63 | SNV | Missense_Mutation | novel | c.940N>C | p.Glu314Gln | p.E314Q | Q96MT8 | protein_coding | deleterious(0.02) | benign(0.134) | TCGA-EK-A3GK-01 | Cervix | cervical & endocervical cancer | Female | <65 | I/II | Unknown | Unknown | SD |
| CEP63 | SNV | Missense_Mutation | c.303N>T | p.Lys101Asn | p.K101N | Q96MT8 | protein_coding | deleterious(0.05) | benign(0.156) | TCGA-AA-3510-01 | Colorectum | colon adenocarcinoma | Male | >=65 | I/II | Unknown | Unknown | SD | |
| CEP63 | SNV | Missense_Mutation | rs765915059 | c.169C>T | p.Arg57Cys | p.R57C | Q96MT8 | protein_coding | deleterious(0) | probably_damaging(0.999) | TCGA-AA-3672-01 | Colorectum | colon adenocarcinoma | Female | >=65 | III/IV | Unknown | Unknown | SD |
| CEP63 | SNV | Missense_Mutation | novel | c.961N>C | p.Tyr321His | p.Y321H | Q96MT8 | protein_coding | tolerated(0.38) | benign(0.001) | TCGA-AA-3877-01 | Colorectum | colon adenocarcinoma | Female | >=65 | I/II | Unknown | Unknown | SD |
| Page: 1 2 3 4 5 6 7 8 9 |
Top |
Related drugs of malignant transformation related genes |
| Identification of chemicals and drugs interact with genes involved in malignant transfromation |
| (DGIdb 4.0) |
| Entrez ID | Symbol | Category | Interaction Types | Drug Claim Name | Drug Name | PMIDs |
| Page: 1 |

Copyright 2023-Present -The University of Texas Health Science Center at Houston |