
|
|||||
|
 | |
| |
| |
| |
| |
| |
|
Gene: CEP57L1 |
Gene summary for CEP57L1 |
| Gene information | Species | Human | Gene symbol | CEP57L1 | Gene ID | 285753 |
| Gene name | centrosomal protein 57 like 1 | |
| Gene Alias | C6orf182 | |
| Cytomap | 6q21 | |
| Gene Type | protein-coding | GO ID | GO:0008150 | UniProtAcc | Q8IYX8 |
Top |
Malignant transformation analysis |
| Identification of the aberrant gene expression in precancerous and cancerous lesions by comparing the gene expression of stem-like cells in diseased tissues with normal stem cells |
| Entrez ID | Symbol | Replicates | Species | Organ | Tissue | Adj P-value | Log2FC | Malignancy |
| 285753 | CEP57L1 | LZE24T | Human | Esophagus | ESCC | 1.80e-03 | 1.05e-01 | 0.0596 |
| 285753 | CEP57L1 | P2T-E | Human | Esophagus | ESCC | 2.70e-10 | 2.62e-01 | 0.1177 |
| 285753 | CEP57L1 | P4T-E | Human | Esophagus | ESCC | 1.75e-05 | 1.68e-01 | 0.1323 |
| 285753 | CEP57L1 | P5T-E | Human | Esophagus | ESCC | 3.52e-04 | 1.11e-01 | 0.1327 |
| 285753 | CEP57L1 | P8T-E | Human | Esophagus | ESCC | 2.88e-06 | 8.82e-02 | 0.0889 |
| 285753 | CEP57L1 | P10T-E | Human | Esophagus | ESCC | 5.71e-06 | 1.36e-01 | 0.116 |
| 285753 | CEP57L1 | P12T-E | Human | Esophagus | ESCC | 1.08e-09 | 1.55e-01 | 0.1122 |
| 285753 | CEP57L1 | P15T-E | Human | Esophagus | ESCC | 3.26e-02 | 7.75e-02 | 0.1149 |
| 285753 | CEP57L1 | P16T-E | Human | Esophagus | ESCC | 1.65e-07 | 1.72e-01 | 0.1153 |
| 285753 | CEP57L1 | P17T-E | Human | Esophagus | ESCC | 1.49e-02 | 1.58e-01 | 0.1278 |
| 285753 | CEP57L1 | P19T-E | Human | Esophagus | ESCC | 5.57e-05 | 2.99e-01 | 0.1662 |
| 285753 | CEP57L1 | P20T-E | Human | Esophagus | ESCC | 2.18e-03 | 1.12e-01 | 0.1124 |
| 285753 | CEP57L1 | P21T-E | Human | Esophagus | ESCC | 3.58e-10 | 1.65e-01 | 0.1617 |
| 285753 | CEP57L1 | P22T-E | Human | Esophagus | ESCC | 2.62e-05 | 7.38e-02 | 0.1236 |
| 285753 | CEP57L1 | P24T-E | Human | Esophagus | ESCC | 2.90e-08 | 1.73e-01 | 0.1287 |
| 285753 | CEP57L1 | P26T-E | Human | Esophagus | ESCC | 1.91e-08 | 1.32e-01 | 0.1276 |
| 285753 | CEP57L1 | P27T-E | Human | Esophagus | ESCC | 2.68e-09 | 1.70e-01 | 0.1055 |
| 285753 | CEP57L1 | P28T-E | Human | Esophagus | ESCC | 3.60e-08 | 1.55e-01 | 0.1149 |
| 285753 | CEP57L1 | P30T-E | Human | Esophagus | ESCC | 9.20e-05 | 1.73e-01 | 0.137 |
| 285753 | CEP57L1 | P31T-E | Human | Esophagus | ESCC | 6.30e-03 | 1.24e-01 | 0.1251 |
| Page: 1 2 3 |
| Tissue | Expression Dynamics | Abbreviation |
| Esophagus | 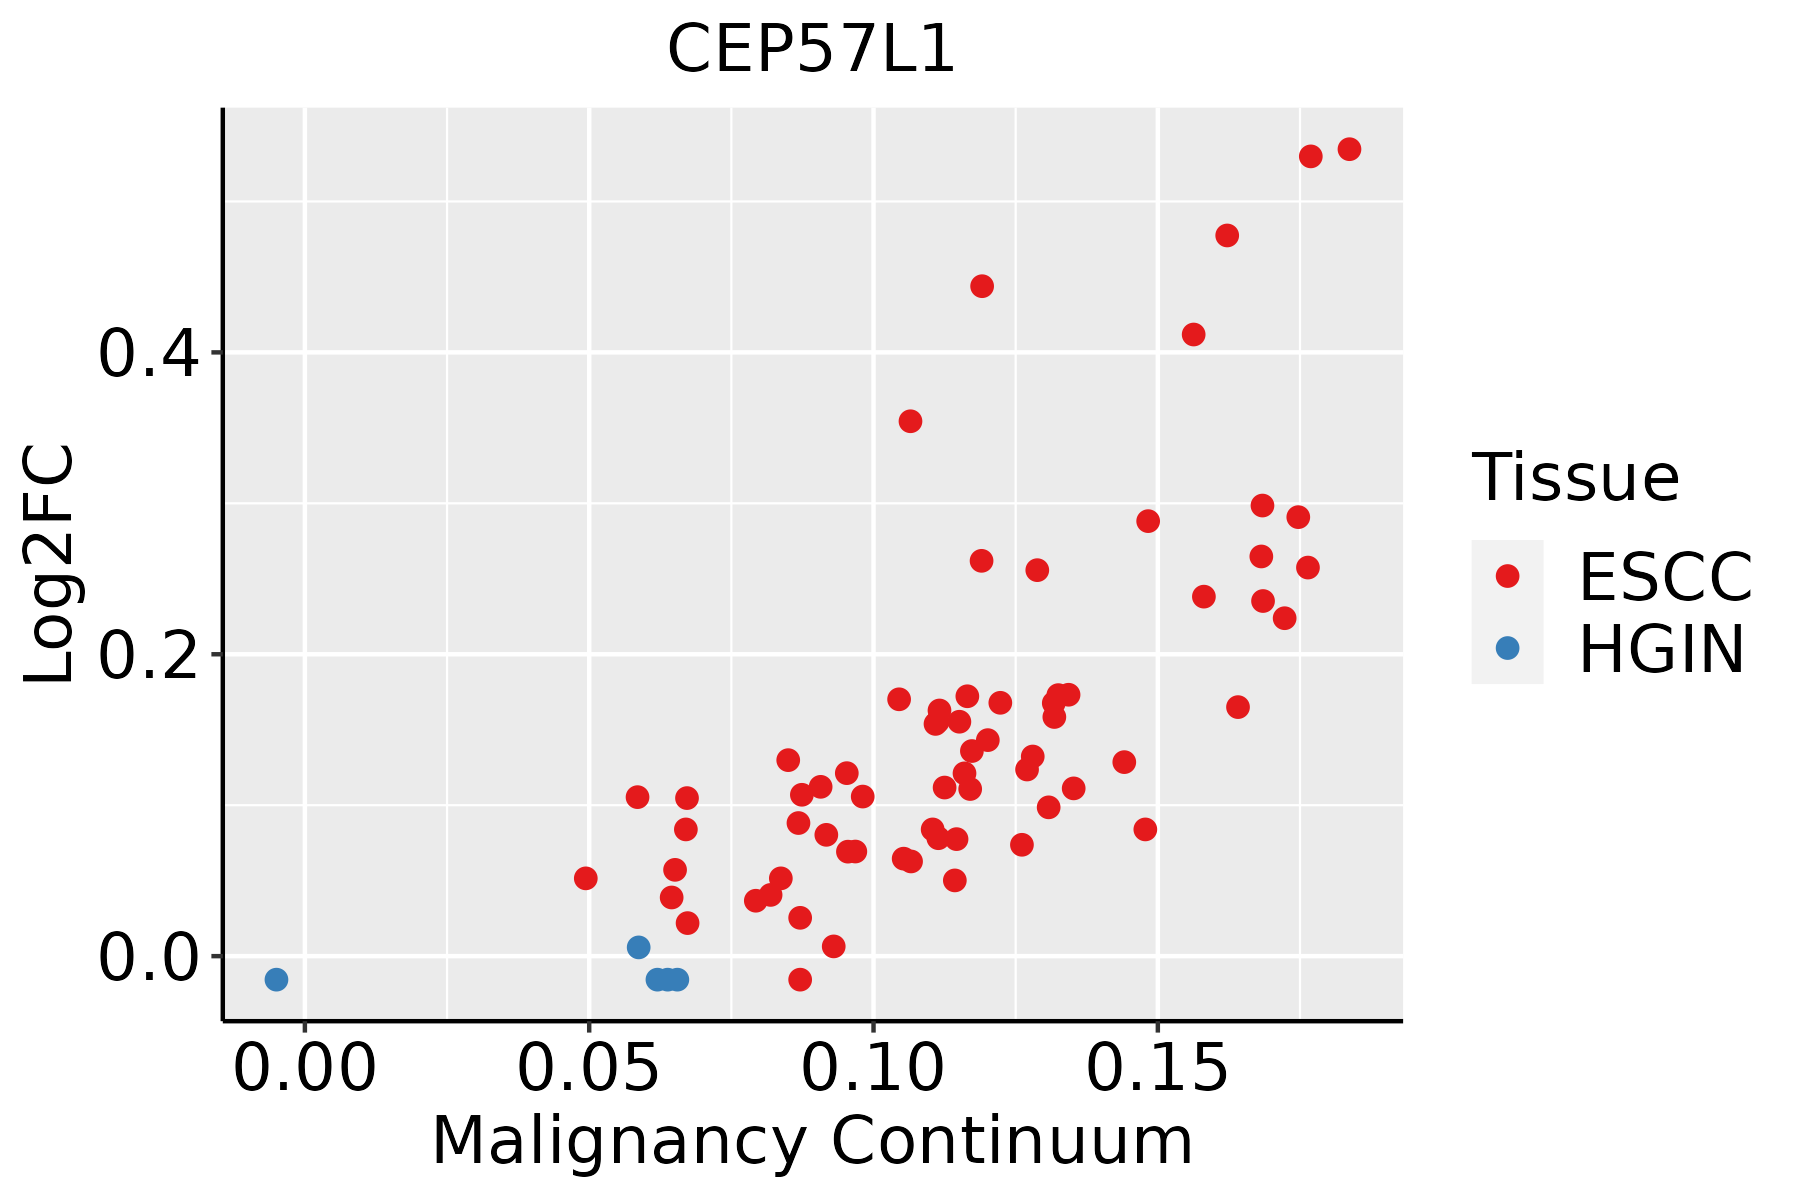 | ESCC: Esophageal squamous cell carcinoma |
| HGIN: High-grade intraepithelial neoplasias | ||
| LGIN: Low-grade intraepithelial neoplasias | ||
| Thyroid |  | ATC: Anaplastic thyroid cancer |
| HT: Hashimoto's thyroiditis | ||
| PTC: Papillary thyroid cancer |
| ∗log2FC in expression of this searched gene in stem-like cells from each diseased tissue sample relative to stem-like cells in normal samples in each tissue plotted against the malignancy continuum. Samples are colored based on if they are from different disease stage. |
Top |
Malignant transformation related pathway analysis |
| Find out the enriched GO biological processes and KEGG pathways involved in transition from healthy to precancer to cancer |
| Tissue | Disease Stage | Enriched GO biological Processes |
| Colorectum | AD |  |
| Colorectum | SER |  |
| Colorectum | MSS |  |
| Colorectum | MSI-H |  |
| Colorectum | FAP |  |
| ∗Top 15 enriched GO BP terms are showed in the bar plot of each disease state in each tissue. Each row represents a significant GO biological process which is colored according to the -log10(p.adjust). |
| Page: 1 2 3 4 5 6 7 8 9 |
| GO ID | Tissue | Disease Stage | Description | Gene Ratio | Bg Ratio | pvalue | p.adjust | Count |
| Page: 1 |
| Pathway ID | Tissue | Disease Stage | Description | Gene Ratio | Bg Ratio | pvalue | p.adjust | qvalue | Count |
| Page: 1 |
Top |
Cell-cell communication analysis |
| Identification of potential cell-cell interactions between two cell types and their ligand-receptor pairs for different disease states |
| Ligand | Receptor | LRpair | Pathway | Tissue | Disease Stage |
| Page: 1 |
Top |
Single-cell gene regulatory network inference analysis |
| Find out the significant the regulons (TFs) and the target genes of each regulon across cell types for different disease states |
| TF | Cell Type | Tissue | Disease Stage | Target Gene | RSS | Regulon Activity |
| ∗The dot plots of a searched regulon are shown for all cell subpopulations in each disease state of each tissue based on the regulon specific score inferred using pySCENIC and by calculating the average expression. |
| Page: 1 |
Top |
Somatic mutation of malignant transformation related genes |
| Annotation of somatic variants for genes involved in malignant transformation |
| Hugo Symbol | Variant Class | Variant Classification | dbSNP RS | HGVSc | HGVSp | HGVSp Short | SWISSPROT | BIOTYPE | SIFT | PolyPhen | Tumor Sample Barcode | Tissue | Histology | Sex | Age | Stage | Therapy Types | Drugs | Outcome |
| CEP57L1 | SNV | Missense_Mutation | novel | c.1321N>A | p.Pro441Thr | p.P441T | Q8IYX8 | protein_coding | tolerated(0.18) | possibly_damaging(0.632) | TCGA-AR-A0TU-01 | Breast | breast invasive carcinoma | Female | <65 | I/II | Unspecific | Doxorubicin | SD |
| CEP57L1 | SNV | Missense_Mutation | c.1200N>T | p.Met400Ile | p.M400I | Q8IYX8 | protein_coding | tolerated(0.27) | benign(0) | TCGA-EW-A1P0-01 | Breast | breast invasive carcinoma | Female | <65 | I/II | Hormone Therapy | arimidex | PD | |
| CEP57L1 | SNV | Missense_Mutation | rs763471521 | c.434G>A | p.Arg145Gln | p.R145Q | Q8IYX8 | protein_coding | tolerated(0.53) | benign(0.145) | TCGA-LL-A441-01 | Breast | breast invasive carcinoma | Female | <65 | I/II | Chemotherapy | taxotere | CR |
| CEP57L1 | insertion | Frame_Shift_Ins | novel | c.1319_1320insAGGAGCT | p.His440GlnfsTer9 | p.H440Qfs*9 | Q8IYX8 | protein_coding | TCGA-AR-A0TU-01 | Breast | breast invasive carcinoma | Female | <65 | I/II | Unspecific | Doxorubicin | SD | ||
| CEP57L1 | SNV | Missense_Mutation | novel | c.442N>C | p.Asn148His | p.N148H | Q8IYX8 | protein_coding | deleterious(0.02) | possibly_damaging(0.868) | TCGA-EA-A3Y4-01 | Cervix | cervical & endocervical cancer | Female | <65 | I/II | Unknown | Unknown | SD |
| CEP57L1 | SNV | Missense_Mutation | c.1059T>G | p.Ser353Arg | p.S353R | Q8IYX8 | protein_coding | tolerated(0.21) | benign(0.017) | TCGA-AA-A00N-01 | Colorectum | colon adenocarcinoma | Male | >=65 | I/II | Unknown | Unknown | PD | |
| CEP57L1 | deletion | Frame_Shift_Del | c.861delN | p.Phe288LeufsTer3 | p.F288Lfs*3 | Q8IYX8 | protein_coding | TCGA-AA-3492-01 | Colorectum | colon adenocarcinoma | Female | >=65 | I/II | Unknown | Unknown | SD | |||
| CEP57L1 | SNV | Missense_Mutation | novel | c.196A>T | p.Ile66Phe | p.I66F | Q8IYX8 | protein_coding | deleterious(0) | probably_damaging(1) | TCGA-AJ-A3EL-01 | Endometrium | uterine corpus endometrioid carcinoma | Female | <65 | I/II | Unknown | Unknown | SD |
| CEP57L1 | SNV | Missense_Mutation | c.835C>T | p.Arg279Cys | p.R279C | Q8IYX8 | protein_coding | tolerated(0.18) | benign(0) | TCGA-AJ-A3EL-01 | Endometrium | uterine corpus endometrioid carcinoma | Female | <65 | I/II | Unknown | Unknown | SD | |
| CEP57L1 | SNV | Missense_Mutation | c.344T>A | p.Ile115Lys | p.I115K | Q8IYX8 | protein_coding | deleterious(0) | probably_damaging(0.945) | TCGA-AP-A059-01 | Endometrium | uterine corpus endometrioid carcinoma | Female | >=65 | I/II | Unknown | Unknown | SD |
| Page: 1 2 3 4 5 |
Top |
Related drugs of malignant transformation related genes |
| Identification of chemicals and drugs interact with genes involved in malignant transfromation |
| (DGIdb 4.0) |
| Entrez ID | Symbol | Category | Interaction Types | Drug Claim Name | Drug Name | PMIDs |
| Page: 1 |

Copyright 2023-Present -The University of Texas Health Science Center at Houston |