
|
|||||
|
 | |
| |
| |
| |
| |
| |
|
Gene: CEP55 |
Gene summary for CEP55 |
| Gene information | Species | Human | Gene symbol | CEP55 | Gene ID | 55165 |
| Gene name | centrosomal protein 55 | |
| Gene Alias | C10orf3 | |
| Cytomap | 10q23.33 | |
| Gene Type | protein-coding | GO ID | GO:0000278 | UniProtAcc | Q53EZ4 |
Top |
Malignant transformation analysis |
| Identification of the aberrant gene expression in precancerous and cancerous lesions by comparing the gene expression of stem-like cells in diseased tissues with normal stem cells |
| Entrez ID | Symbol | Replicates | Species | Organ | Tissue | Adj P-value | Log2FC | Malignancy |
| 55165 | CEP55 | LZE2T | Human | Esophagus | ESCC | 5.44e-10 | 9.30e-01 | 0.082 |
| 55165 | CEP55 | LZE24T | Human | Esophagus | ESCC | 4.15e-02 | 1.71e-01 | 0.0596 |
| 55165 | CEP55 | P2T-E | Human | Esophagus | ESCC | 9.53e-09 | 3.32e-01 | 0.1177 |
| 55165 | CEP55 | P4T-E | Human | Esophagus | ESCC | 1.17e-15 | 7.10e-01 | 0.1323 |
| 55165 | CEP55 | P5T-E | Human | Esophagus | ESCC | 2.51e-33 | 8.09e-01 | 0.1327 |
| 55165 | CEP55 | P9T-E | Human | Esophagus | ESCC | 6.74e-06 | 2.02e-01 | 0.1131 |
| 55165 | CEP55 | P10T-E | Human | Esophagus | ESCC | 3.50e-02 | 9.78e-02 | 0.116 |
| 55165 | CEP55 | P15T-E | Human | Esophagus | ESCC | 8.45e-06 | 2.42e-01 | 0.1149 |
| 55165 | CEP55 | P20T-E | Human | Esophagus | ESCC | 3.11e-04 | 2.20e-01 | 0.1124 |
| 55165 | CEP55 | P21T-E | Human | Esophagus | ESCC | 2.06e-08 | 3.26e-01 | 0.1617 |
| 55165 | CEP55 | P24T-E | Human | Esophagus | ESCC | 9.56e-08 | 3.23e-01 | 0.1287 |
| 55165 | CEP55 | P26T-E | Human | Esophagus | ESCC | 1.66e-02 | 1.65e-01 | 0.1276 |
| 55165 | CEP55 | P28T-E | Human | Esophagus | ESCC | 2.93e-15 | 4.07e-01 | 0.1149 |
| 55165 | CEP55 | P30T-E | Human | Esophagus | ESCC | 1.02e-02 | 2.55e-01 | 0.137 |
| 55165 | CEP55 | P31T-E | Human | Esophagus | ESCC | 9.02e-11 | 3.74e-01 | 0.1251 |
| 55165 | CEP55 | P32T-E | Human | Esophagus | ESCC | 1.13e-16 | 3.75e-01 | 0.1666 |
| 55165 | CEP55 | P36T-E | Human | Esophagus | ESCC | 4.17e-05 | 2.83e-01 | 0.1187 |
| 55165 | CEP55 | P37T-E | Human | Esophagus | ESCC | 1.09e-08 | 2.61e-01 | 0.1371 |
| 55165 | CEP55 | P38T-E | Human | Esophagus | ESCC | 1.30e-06 | 3.72e-01 | 0.127 |
| 55165 | CEP55 | P40T-E | Human | Esophagus | ESCC | 3.18e-05 | 4.90e-01 | 0.109 |
| Page: 1 2 3 |
| Tissue | Expression Dynamics | Abbreviation |
| Esophagus |  | ESCC: Esophageal squamous cell carcinoma |
| HGIN: High-grade intraepithelial neoplasias | ||
| LGIN: Low-grade intraepithelial neoplasias | ||
| Oral Cavity |  | EOLP: Erosive Oral lichen planus |
| LP: leukoplakia | ||
| NEOLP: Non-erosive oral lichen planus | ||
| OSCC: Oral squamous cell carcinoma | ||
| Skin | 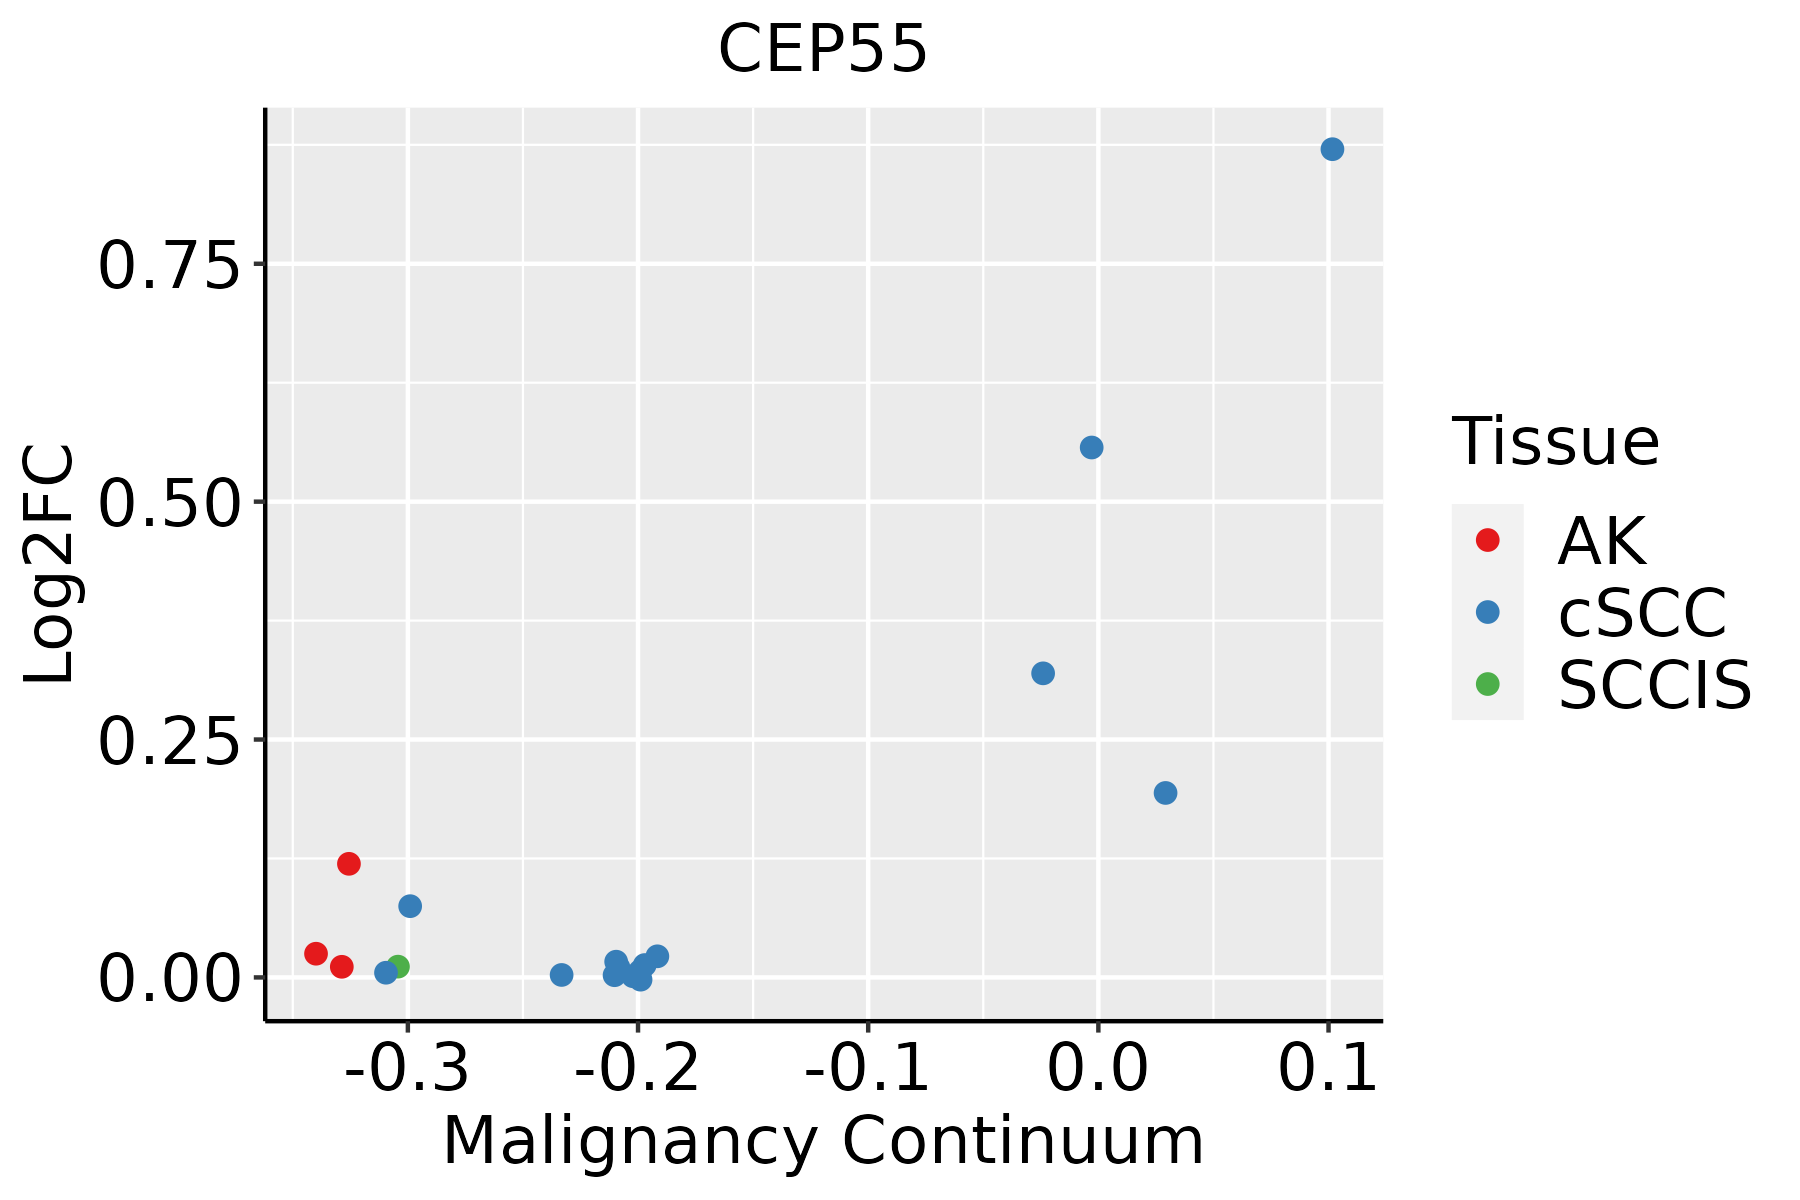 | AK: Actinic keratosis |
| cSCC: Cutaneous squamous cell carcinoma | ||
| SCCIS:squamous cell carcinoma in situ | ||
| Thyroid |  | ATC: Anaplastic thyroid cancer |
| HT: Hashimoto's thyroiditis | ||
| PTC: Papillary thyroid cancer |
| ∗log2FC in expression of this searched gene in stem-like cells from each diseased tissue sample relative to stem-like cells in normal samples in each tissue plotted against the malignancy continuum. Samples are colored based on if they are from different disease stage. |
Top |
Malignant transformation related pathway analysis |
| Find out the enriched GO biological processes and KEGG pathways involved in transition from healthy to precancer to cancer |
| Tissue | Disease Stage | Enriched GO biological Processes |
| Colorectum | AD |  |
| Colorectum | SER |  |
| Colorectum | MSS |  |
| Colorectum | MSI-H |  |
| Colorectum | FAP |  |
| ∗Top 15 enriched GO BP terms are showed in the bar plot of each disease state in each tissue. Each row represents a significant GO biological process which is colored according to the -log10(p.adjust). |
| Page: 1 2 3 4 5 6 7 8 9 |
| GO ID | Tissue | Disease Stage | Description | Gene Ratio | Bg Ratio | pvalue | p.adjust | Count |
| GO:000028115 | Esophagus | ESCC | mitotic cytokinesis | 58/8552 | 71/18723 | 4.34e-10 | 1.15e-08 | 58 |
| GO:003250614 | Esophagus | ESCC | cytokinetic process | 35/8552 | 39/18723 | 9.38e-09 | 1.90e-07 | 35 |
| GO:000091016 | Esophagus | ESCC | cytokinesis | 115/8552 | 173/18723 | 2.48e-08 | 4.68e-07 | 115 |
| GO:006164015 | Esophagus | ESCC | cytoskeleton-dependent cytokinesis | 72/8552 | 100/18723 | 8.10e-08 | 1.39e-06 | 72 |
| GO:190241014 | Esophagus | ESCC | mitotic cytokinetic process | 22/8552 | 23/18723 | 4.17e-07 | 5.71e-06 | 22 |
| GO:006195214 | Esophagus | ESCC | midbody abscission | 17/8552 | 17/18723 | 1.63e-06 | 1.95e-05 | 17 |
| GO:19048881 | Esophagus | ESCC | cranial skeletal system development | 41/8552 | 68/18723 | 1.07e-02 | 3.66e-02 | 41 |
| GO:00325065 | Oral cavity | OSCC | cytokinetic process | 33/7305 | 39/18723 | 5.91e-09 | 1.26e-07 | 33 |
| GO:00002815 | Oral cavity | OSCC | mitotic cytokinesis | 51/7305 | 71/18723 | 2.01e-08 | 3.95e-07 | 51 |
| GO:19024107 | Oral cavity | OSCC | mitotic cytokinetic process | 20/7305 | 23/18723 | 2.91e-06 | 3.56e-05 | 20 |
| GO:00619524 | Oral cavity | OSCC | midbody abscission | 16/7305 | 17/18723 | 3.07e-06 | 3.72e-05 | 16 |
| GO:000091010 | Oral cavity | OSCC | cytokinesis | 97/7305 | 173/18723 | 3.82e-06 | 4.51e-05 | 97 |
| GO:00616405 | Oral cavity | OSCC | cytoskeleton-dependent cytokinesis | 60/7305 | 100/18723 | 1.69e-05 | 1.67e-04 | 60 |
| GO:1904888 | Oral cavity | OSCC | cranial skeletal system development | 36/7305 | 68/18723 | 1.36e-02 | 4.50e-02 | 36 |
| GO:000028116 | Skin | cSCC | mitotic cytokinesis | 47/4864 | 71/18723 | 1.29e-12 | 7.21e-11 | 47 |
| GO:006164016 | Skin | cSCC | cytoskeleton-dependent cytokinesis | 57/4864 | 100/18723 | 4.65e-11 | 2.21e-09 | 57 |
| GO:000091021 | Skin | cSCC | cytokinesis | 84/4864 | 173/18723 | 1.36e-10 | 6.04e-09 | 84 |
| GO:00325067 | Skin | cSCC | cytokinetic process | 27/4864 | 39/18723 | 1.87e-08 | 5.53e-07 | 27 |
| GO:19024109 | Skin | cSCC | mitotic cytokinetic process | 19/4864 | 23/18723 | 2.11e-08 | 6.08e-07 | 19 |
| GO:00619526 | Skin | cSCC | midbody abscission | 15/4864 | 17/18723 | 1.27e-07 | 2.93e-06 | 15 |
| Page: 1 2 |
| Pathway ID | Tissue | Disease Stage | Description | Gene Ratio | Bg Ratio | pvalue | p.adjust | qvalue | Count |
| Page: 1 |
Top |
Cell-cell communication analysis |
| Identification of potential cell-cell interactions between two cell types and their ligand-receptor pairs for different disease states |
| Ligand | Receptor | LRpair | Pathway | Tissue | Disease Stage |
| Page: 1 |
Top |
Single-cell gene regulatory network inference analysis |
| Find out the significant the regulons (TFs) and the target genes of each regulon across cell types for different disease states |
| TF | Cell Type | Tissue | Disease Stage | Target Gene | RSS | Regulon Activity |
| ∗The dot plots of a searched regulon are shown for all cell subpopulations in each disease state of each tissue based on the regulon specific score inferred using pySCENIC and by calculating the average expression. |
| Page: 1 |
Top |
Somatic mutation of malignant transformation related genes |
| Annotation of somatic variants for genes involved in malignant transformation |
| Hugo Symbol | Variant Class | Variant Classification | dbSNP RS | HGVSc | HGVSp | HGVSp Short | SWISSPROT | BIOTYPE | SIFT | PolyPhen | Tumor Sample Barcode | Tissue | Histology | Sex | Age | Stage | Therapy Types | Drugs | Outcome |
| CEP55 | insertion | Frame_Shift_Ins | novel | c.1335_1336insC | p.Gln446ProfsTer6 | p.Q446Pfs*6 | Q53EZ4 | protein_coding | TCGA-BH-A0HW-01 | Breast | breast invasive carcinoma | Female | <65 | I/II | Chemotherapy | doxorubicin | SD | ||
| CEP55 | SNV | Missense_Mutation | c.226N>G | p.Gln76Glu | p.Q76E | Q53EZ4 | protein_coding | tolerated(0.27) | benign(0.003) | TCGA-Q1-A73O-01 | Cervix | cervical & endocervical cancer | Female | <65 | I/II | Chemotherapy | cisplatin | CR | |
| CEP55 | SNV | Missense_Mutation | rs749800886 | c.797N>A | p.Arg266Gln | p.R266Q | Q53EZ4 | protein_coding | tolerated(0.76) | benign(0.005) | TCGA-5M-AAT6-01 | Colorectum | colon adenocarcinoma | Female | <65 | III/IV | Unknown | Unknown | PD |
| CEP55 | SNV | Missense_Mutation | novel | c.624N>C | p.Lys208Asn | p.K208N | Q53EZ4 | protein_coding | deleterious(0.01) | benign(0.058) | TCGA-AA-3984-01 | Colorectum | colon adenocarcinoma | Female | <65 | I/II | Unknown | Unknown | SD |
| CEP55 | SNV | Missense_Mutation | c.916N>C | p.Lys306Gln | p.K306Q | Q53EZ4 | protein_coding | tolerated(0.05) | benign(0.006) | TCGA-AA-A010-01 | Colorectum | colon adenocarcinoma | Female | <65 | I/II | Chemotherapy | folinic | CR | |
| CEP55 | SNV | Missense_Mutation | c.302T>C | p.Leu101Pro | p.L101P | Q53EZ4 | protein_coding | tolerated(0.2) | possibly_damaging(0.691) | TCGA-AA-A01S-01 | Colorectum | colon adenocarcinoma | Female | <65 | III/IV | Unknown | Unknown | SD | |
| CEP55 | SNV | Missense_Mutation | novel | c.323N>G | p.Thr108Arg | p.T108R | Q53EZ4 | protein_coding | tolerated(0.54) | benign(0.005) | TCGA-AZ-6601-01 | Colorectum | colon adenocarcinoma | Male | >=65 | I/II | Unknown | Unknown | PD |
| CEP55 | SNV | Missense_Mutation | rs749800886 | c.797N>A | p.Arg266Gln | p.R266Q | Q53EZ4 | protein_coding | tolerated(0.76) | benign(0.005) | TCGA-CA-6717-01 | Colorectum | colon adenocarcinoma | Male | <65 | I/II | Chemotherapy | oxaliplatin | CR |
| CEP55 | SNV | Missense_Mutation | novel | c.617N>G | p.Glu206Gly | p.E206G | Q53EZ4 | protein_coding | deleterious(0) | probably_damaging(0.996) | TCGA-CK-4951-01 | Colorectum | colon adenocarcinoma | Female | >=65 | I/II | Unknown | Unknown | PD |
| CEP55 | SNV | Missense_Mutation | novel | c.216N>T | p.Lys72Asn | p.K72N | Q53EZ4 | protein_coding | deleterious(0.04) | probably_damaging(0.996) | TCGA-AG-A002-01 | Colorectum | rectum adenocarcinoma | Male | <65 | I/II | Unknown | Unknown | SD |
| Page: 1 2 3 4 5 |
Top |
Related drugs of malignant transformation related genes |
| Identification of chemicals and drugs interact with genes involved in malignant transfromation |
| (DGIdb 4.0) |
| Entrez ID | Symbol | Category | Interaction Types | Drug Claim Name | Drug Name | PMIDs |
| Page: 1 |

Copyright 2023-Present -The University of Texas Health Science Center at Houston |