| Tissue | Expression Dynamics | Abbreviation |
| Cervix | 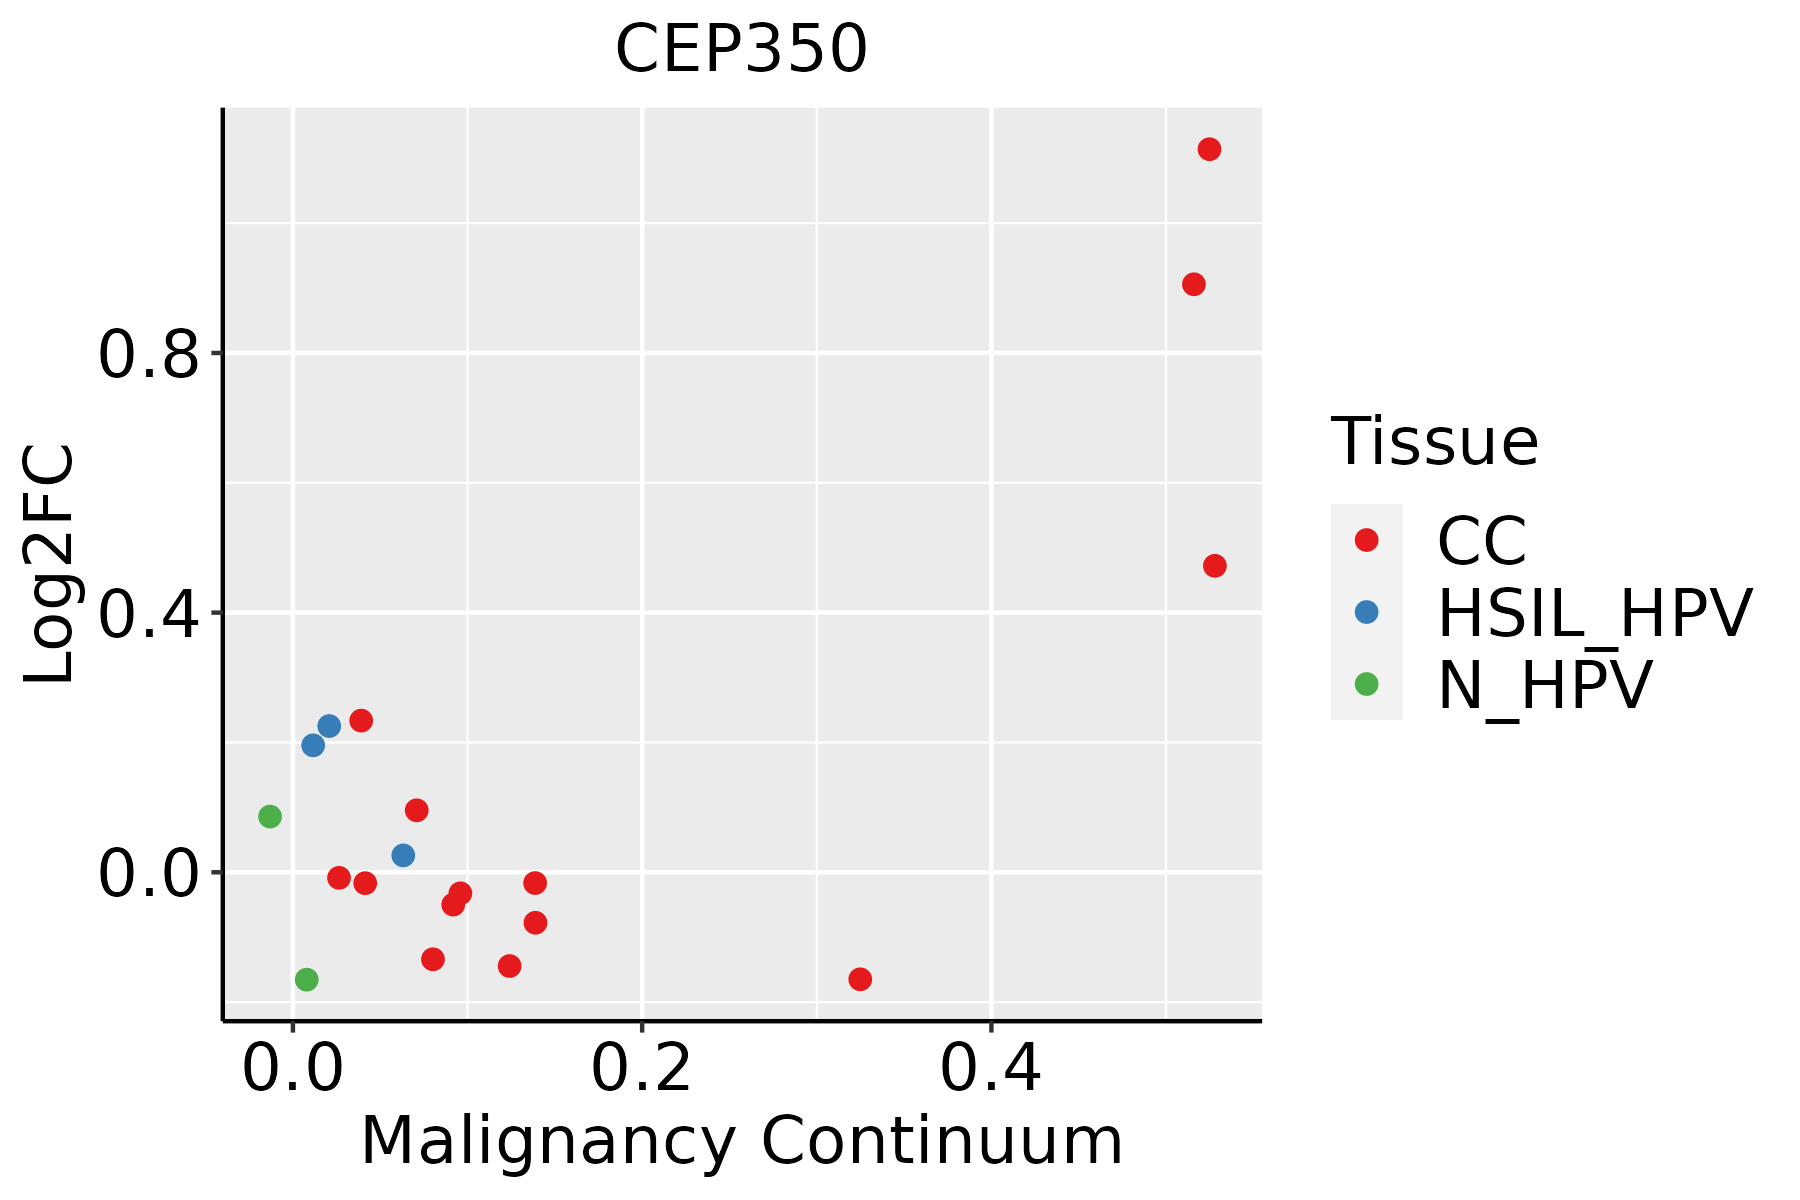 | CC: Cervix cancer |
| HSIL_HPV: HPV-infected high-grade squamous intraepithelial lesions |
| N_HPV: HPV-infected normal cervix |
| Colorectum (GSE201348) |  | FAP: Familial adenomatous polyposis |
| CRC: Colorectal cancer |
| Colorectum (HTA11) |  | AD: Adenomas |
| SER: Sessile serrated lesions |
| MSI-H: Microsatellite-high colorectal cancer |
| MSS: Microsatellite stable colorectal cancer |
| Esophagus |  | ESCC: Esophageal squamous cell carcinoma |
| HGIN: High-grade intraepithelial neoplasias |
| LGIN: Low-grade intraepithelial neoplasias |
| Liver |  | HCC: Hepatocellular carcinoma |
| NAFLD: Non-alcoholic fatty liver disease |
| Lung | 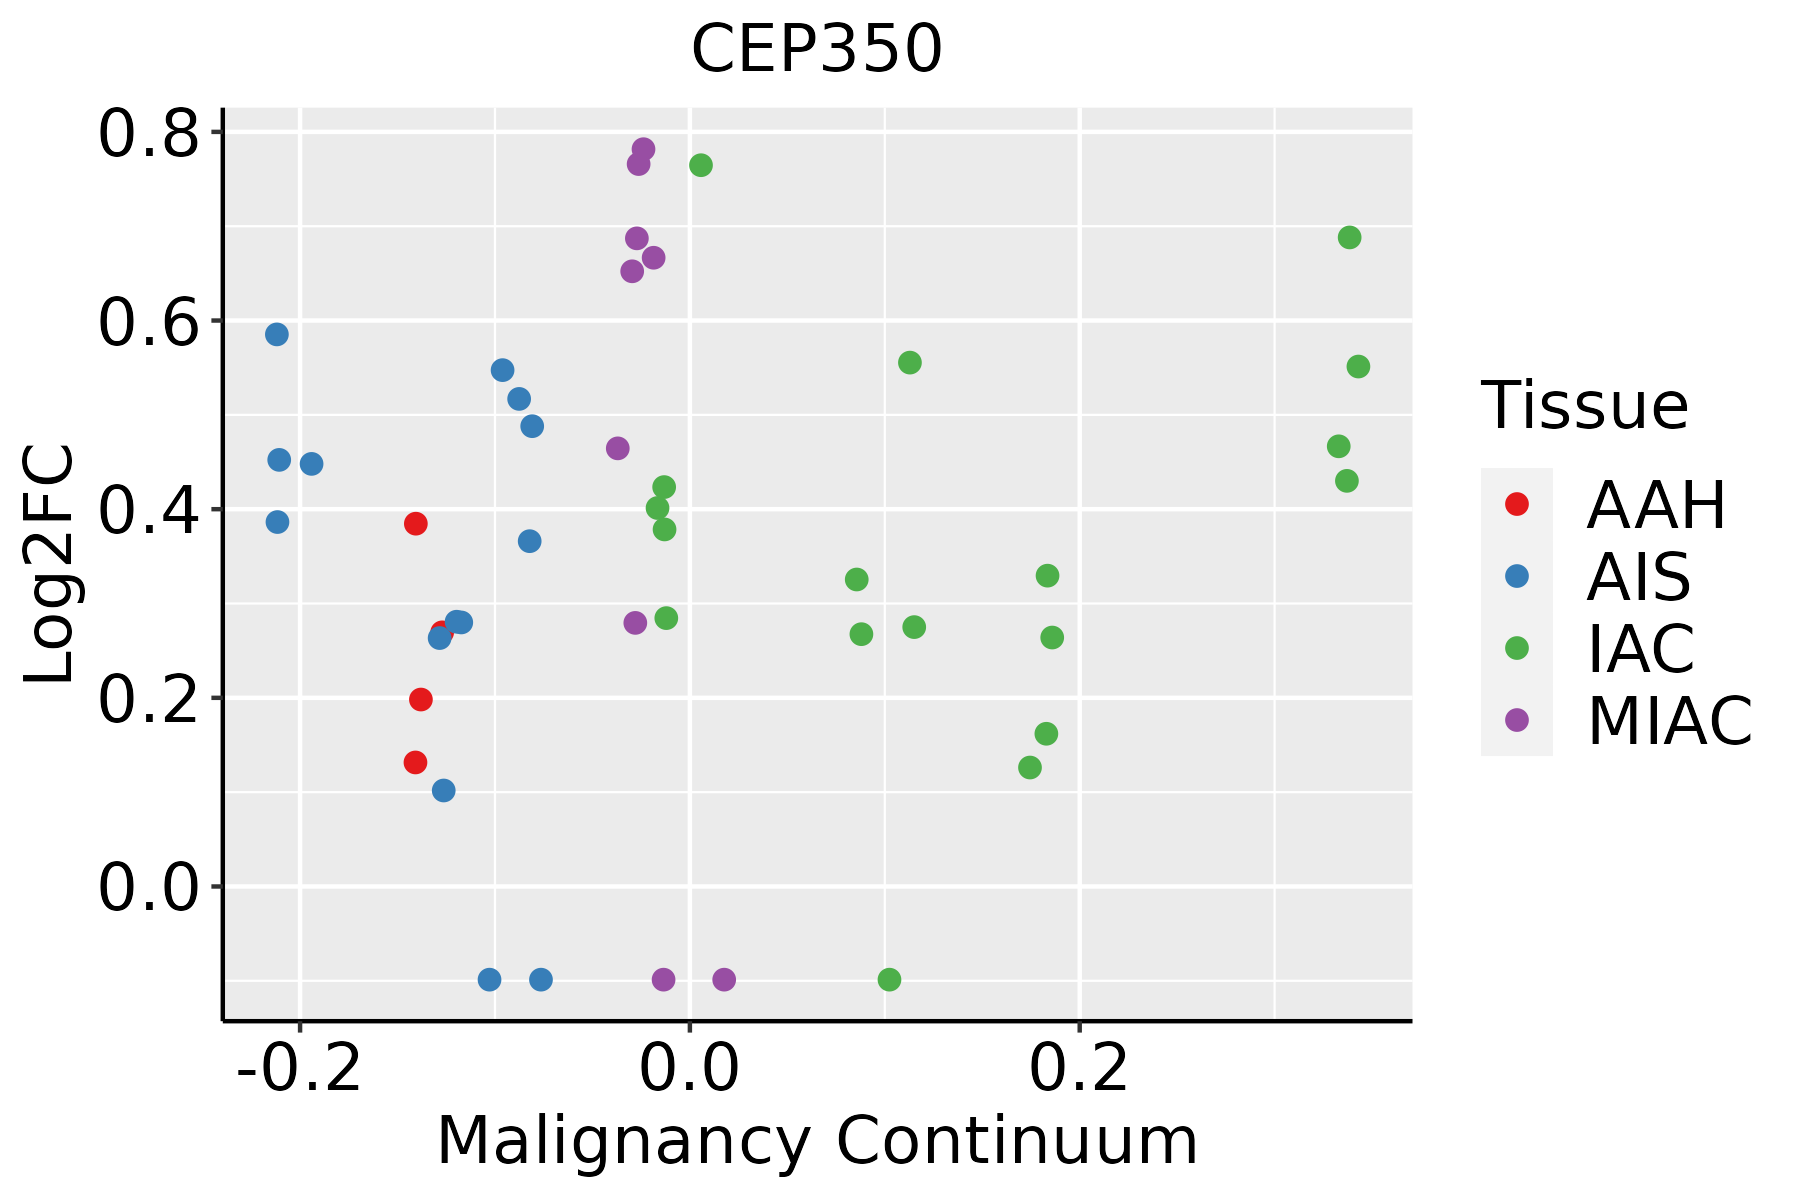 | AAH: Atypical adenomatous hyperplasia |
| AIS: Adenocarcinoma in situ |
| IAC: Invasive lung adenocarcinoma |
| MIA: Minimally invasive adenocarcinoma |
| Oral Cavity |  | EOLP: Erosive Oral lichen planus |
| LP: leukoplakia |
| NEOLP: Non-erosive oral lichen planus |
| OSCC: Oral squamous cell carcinoma |
| Prostate |  | BPH: Benign Prostatic Hyperplasia |
| Skin | 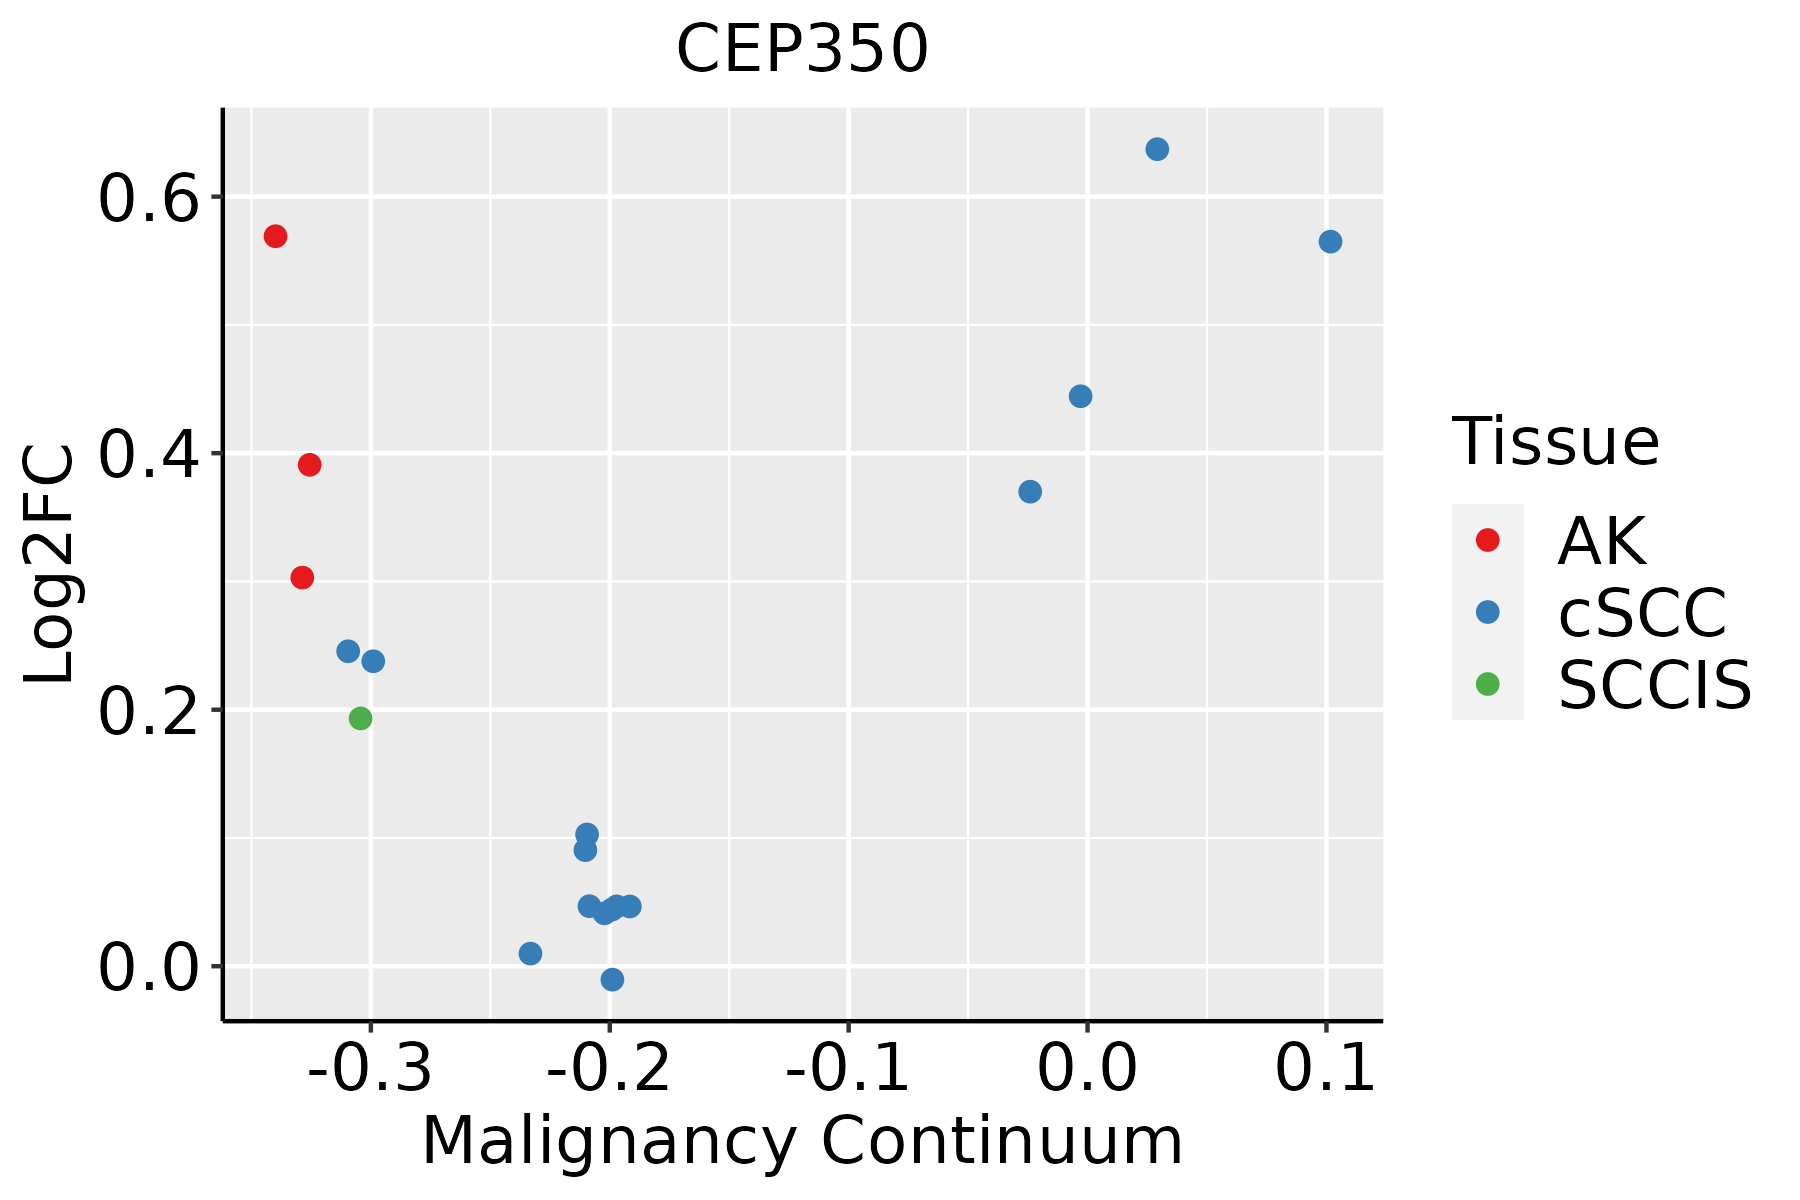 | AK: Actinic keratosis |
| cSCC: Cutaneous squamous cell carcinoma |
| SCCIS:squamous cell carcinoma in situ |
| Thyroid | 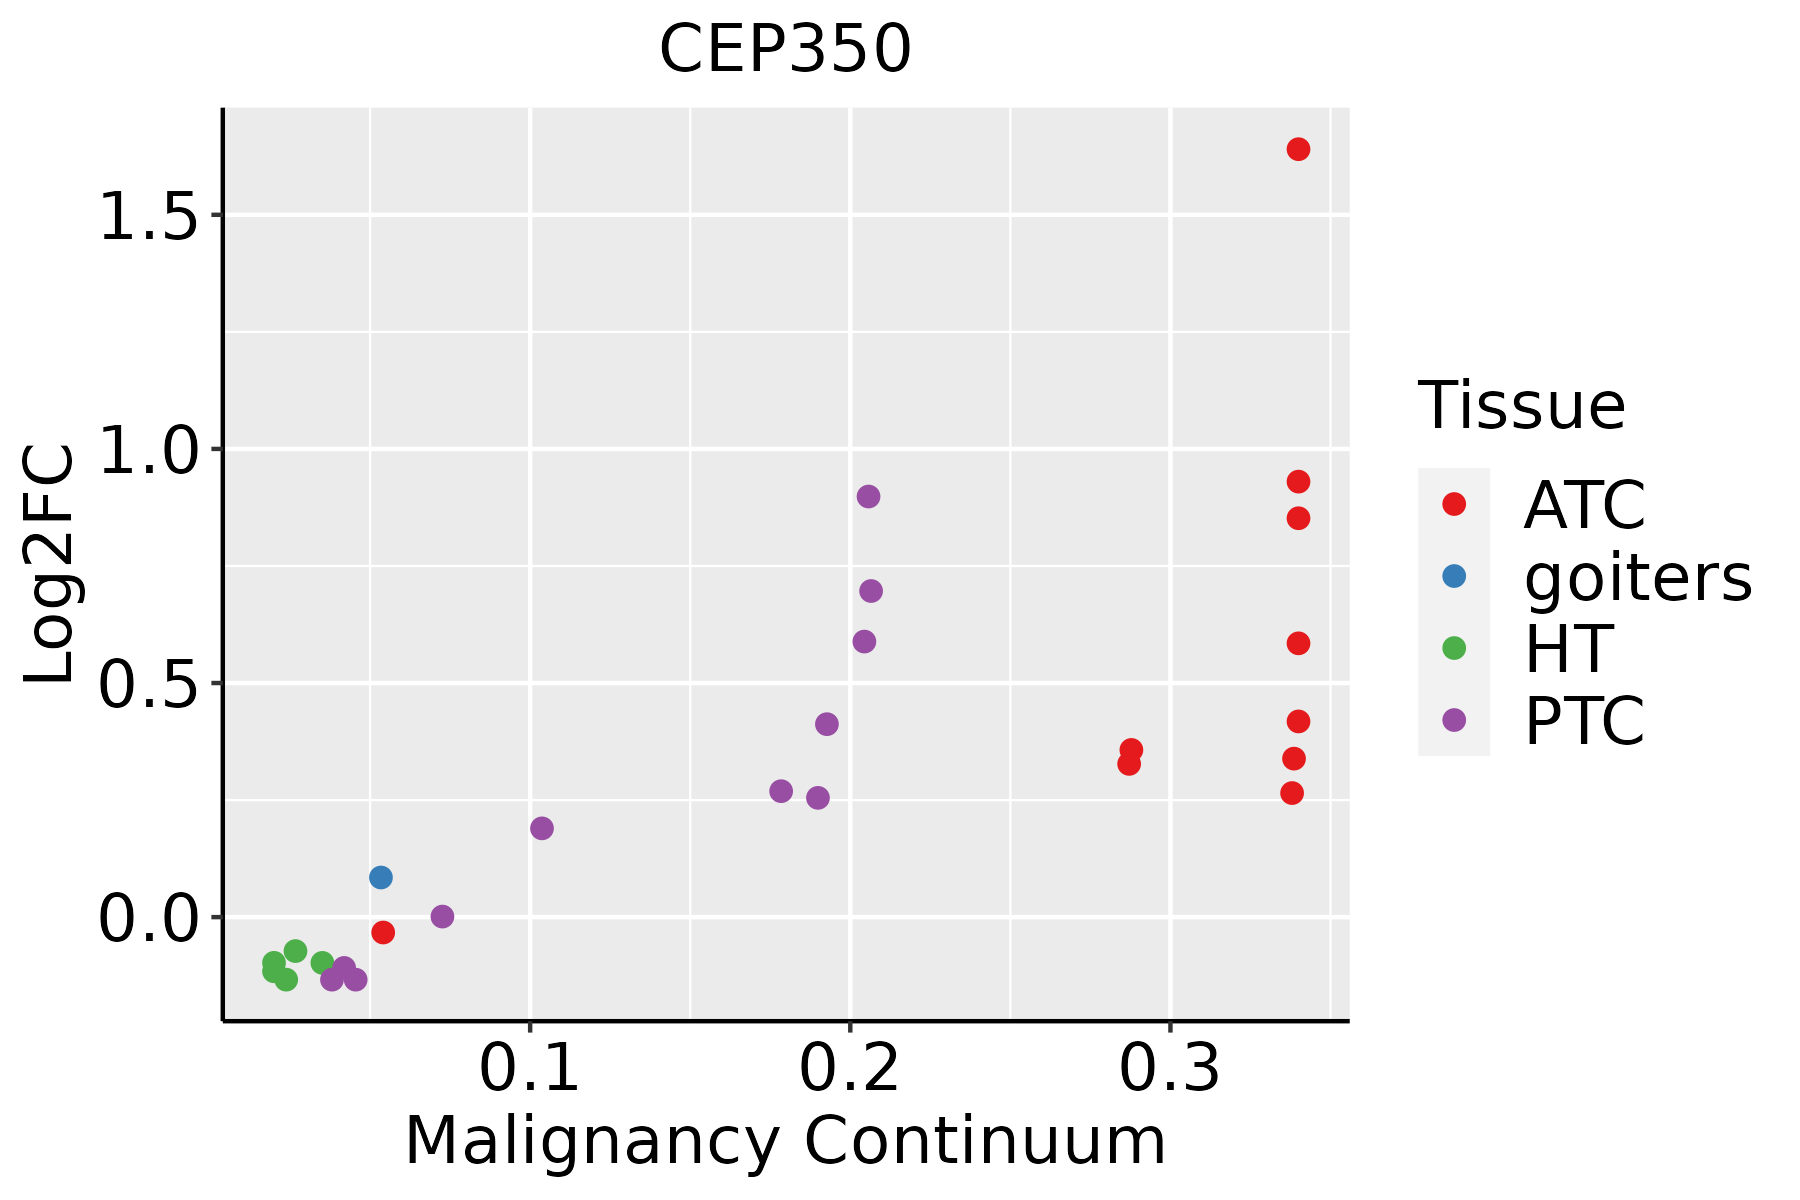 | ATC: Anaplastic thyroid cancer |
| HT: Hashimoto's thyroiditis |
| PTC: Papillary thyroid cancer |
| GO ID | Tissue | Disease Stage | Description | Gene Ratio | Bg Ratio | pvalue | p.adjust | Count |
| GO:0071539 | Colorectum | AD | protein localization to centrosome | 16/3918 | 33/18723 | 3.86e-04 | 4.41e-03 | 16 |
| GO:1905508 | Colorectum | AD | protein localization to microtubule organizing center | 16/3918 | 35/18723 | 8.76e-04 | 8.51e-03 | 16 |
| GO:00715391 | Colorectum | MSS | protein localization to centrosome | 16/3467 | 33/18723 | 8.66e-05 | 1.40e-03 | 16 |
| GO:19055081 | Colorectum | MSS | protein localization to microtubule organizing center | 16/3467 | 35/18723 | 2.07e-04 | 2.89e-03 | 16 |
| GO:0044380 | Colorectum | MSS | protein localization to cytoskeleton | 19/3467 | 58/18723 | 6.69e-03 | 4.38e-02 | 19 |
| GO:0072698 | Colorectum | MSS | protein localization to microtubule cytoskeleton | 18/3467 | 54/18723 | 6.70e-03 | 4.38e-02 | 18 |
| GO:00715392 | Colorectum | FAP | protein localization to centrosome | 14/2622 | 33/18723 | 6.39e-05 | 1.23e-03 | 14 |
| GO:19055082 | Colorectum | FAP | protein localization to microtubule organizing center | 14/2622 | 35/18723 | 1.38e-04 | 2.18e-03 | 14 |
| GO:00726981 | Colorectum | FAP | protein localization to microtubule cytoskeleton | 16/2622 | 54/18723 | 2.26e-03 | 1.84e-02 | 16 |
| GO:00443801 | Colorectum | FAP | protein localization to cytoskeleton | 16/2622 | 58/18723 | 4.97e-03 | 3.32e-02 | 16 |
| GO:00715393 | Colorectum | CRC | protein localization to centrosome | 11/2078 | 33/18723 | 5.80e-04 | 7.89e-03 | 11 |
| GO:19055083 | Colorectum | CRC | protein localization to microtubule organizing center | 11/2078 | 35/18723 | 1.02e-03 | 1.20e-02 | 11 |
| GO:00726982 | Colorectum | CRC | protein localization to microtubule cytoskeleton | 13/2078 | 54/18723 | 5.25e-03 | 3.98e-02 | 13 |
| GO:00726985 | Esophagus | ESCC | protein localization to microtubule cytoskeleton | 43/8552 | 54/18723 | 3.28e-07 | 4.61e-06 | 43 |
| GO:00443804 | Esophagus | ESCC | protein localization to cytoskeleton | 45/8552 | 58/18723 | 6.89e-07 | 8.99e-06 | 45 |
| GO:19055086 | Esophagus | ESCC | protein localization to microtubule organizing center | 28/8552 | 35/18723 | 3.40e-05 | 2.78e-04 | 28 |
| GO:00715396 | Esophagus | ESCC | protein localization to centrosome | 26/8552 | 33/18723 | 1.06e-04 | 7.43e-04 | 26 |
| GO:19055153 | Esophagus | ESCC | non-motile cilium assembly | 39/8552 | 61/18723 | 3.08e-03 | 1.28e-02 | 39 |
| GO:00443802 | Liver | HCC | protein localization to cytoskeleton | 38/7958 | 58/18723 | 3.37e-04 | 2.36e-03 | 38 |
| GO:007269811 | Liver | HCC | protein localization to microtubule cytoskeleton | 35/7958 | 54/18723 | 7.73e-04 | 4.65e-03 | 35 |
| Hugo Symbol | Variant Class | Variant Classification | dbSNP RS | HGVSc | HGVSp | HGVSp Short | SWISSPROT | BIOTYPE | SIFT | PolyPhen | Tumor Sample Barcode | Tissue | Histology | Sex | Age | Stage | Therapy Types | Drugs | Outcome |
| CEP350 | SNV | Missense_Mutation | | c.3789N>C | p.Gln1263His | p.Q1263H | Q5VT06 | protein_coding | deleterious(0.01) | possibly_damaging(0.541) | TCGA-A1-A0SI-01 | Breast | breast invasive carcinoma | Female | <65 | I/II | Unknown | Unknown | SD |
| CEP350 | SNV | Missense_Mutation | | c.5794N>T | p.Val1932Leu | p.V1932L | Q5VT06 | protein_coding | tolerated(0.25) | benign(0) | TCGA-A2-A0D3-01 | Breast | breast invasive carcinoma | Female | <65 | I/II | Chemotherapy | carboplatin | SD |
| CEP350 | SNV | Missense_Mutation | novel | c.6331N>C | p.Asp2111His | p.D2111H | Q5VT06 | protein_coding | deleterious(0) | probably_damaging(0.997) | TCGA-A2-A0EQ-01 | Breast | breast invasive carcinoma | Female | <65 | I/II | Chemotherapy | adriamycin | SD |
| CEP350 | SNV | Missense_Mutation | rs755417181 | c.8458G>A | p.Glu2820Lys | p.E2820K | Q5VT06 | protein_coding | tolerated(0.12) | possibly_damaging(0.476) | TCGA-A7-A56D-01 | Breast | breast invasive carcinoma | Female | >=65 | I/II | Hormone Therapy | arimidex | SD |
| CEP350 | SNV | Missense_Mutation | | c.7213N>T | p.Leu2405Phe | p.L2405F | Q5VT06 | protein_coding | tolerated(0.41) | possibly_damaging(0.768) | TCGA-A8-A09E-01 | Breast | breast invasive carcinoma | Female | >=65 | III/IV | Hormone Therapy | anastrozole | SD |
| CEP350 | SNV | Missense_Mutation | | c.9160N>G | p.Lys3054Glu | p.K3054E | Q5VT06 | protein_coding | deleterious(0) | probably_damaging(0.989) | TCGA-A8-A09Z-01 | Breast | breast invasive carcinoma | Female | >=65 | I/II | Unknown | Unknown | SD |
| CEP350 | SNV | Missense_Mutation | novel | c.6892C>A | p.Leu2298Ile | p.L2298I | Q5VT06 | protein_coding | tolerated(0.12) | benign(0.003) | TCGA-AN-A046-01 | Breast | breast invasive carcinoma | Female | >=65 | I/II | Unknown | Unknown | SD |
| CEP350 | SNV | Missense_Mutation | | c.2484N>C | p.Leu828Phe | p.L828F | Q5VT06 | protein_coding | deleterious(0) | probably_damaging(0.993) | TCGA-BH-A0AW-01 | Breast | breast invasive carcinoma | Female | <65 | I/II | Chemotherapy | carboplatin | SD |
| CEP350 | SNV | Missense_Mutation | novel | c.4185N>C | p.Gln1395His | p.Q1395H | Q5VT06 | protein_coding | deleterious(0) | possibly_damaging(0.818) | TCGA-BH-A0B6-01 | Breast | breast invasive carcinoma | Female | <65 | I/II | Unknown | Unknown | SD |
| CEP350 | SNV | Missense_Mutation | | c.3688G>C | p.Asp1230His | p.D1230H | Q5VT06 | protein_coding | deleterious(0) | possibly_damaging(0.65) | TCGA-BH-A0BZ-01 | Breast | breast invasive carcinoma | Female | <65 | III/IV | Chemotherapy | doxorubicin | CR |


