
|
|||||
|
 | |
| |
| |
| |
| |
| |
|
Gene: CEP295 |
Gene summary for CEP295 |
| Gene information | Species | Human | Gene symbol | CEP295 | Gene ID | 85459 |
| Gene name | centrosomal protein 295 | |
| Gene Alias | KIAA1731 | |
| Cytomap | 11q21 | |
| Gene Type | protein-coding | GO ID | GO:0000226 | UniProtAcc | Q9C0D2 |
Top |
Malignant transformation analysis |
| Identification of the aberrant gene expression in precancerous and cancerous lesions by comparing the gene expression of stem-like cells in diseased tissues with normal stem cells |
| Entrez ID | Symbol | Replicates | Species | Organ | Tissue | Adj P-value | Log2FC | Malignancy |
| 85459 | CEP295 | HCC1_Meng | Human | Liver | HCC | 1.00e-31 | 2.08e-02 | 0.0246 |
| 85459 | CEP295 | HCC2_Meng | Human | Liver | HCC | 1.72e-03 | 1.93e-02 | 0.0107 |
| 85459 | CEP295 | HCC1 | Human | Liver | HCC | 8.86e-03 | 3.98e+00 | 0.5336 |
| 85459 | CEP295 | HCC2 | Human | Liver | HCC | 3.77e-14 | 4.02e+00 | 0.5341 |
| 85459 | CEP295 | S016 | Human | Liver | HCC | 1.22e-02 | 2.70e-01 | 0.2243 |
| 85459 | CEP295 | S027 | Human | Liver | HCC | 4.13e-06 | 5.42e-01 | 0.2446 |
| 85459 | CEP295 | S028 | Human | Liver | HCC | 8.72e-06 | 4.36e-01 | 0.2503 |
| 85459 | CEP295 | S029 | Human | Liver | HCC | 1.54e-04 | 3.50e-01 | 0.2581 |
| 85459 | CEP295 | male-WTA | Human | Thyroid | PTC | 1.68e-02 | 8.84e-02 | 0.1037 |
| 85459 | CEP295 | PTC01 | Human | Thyroid | PTC | 1.66e-02 | 1.12e-01 | 0.1899 |
| 85459 | CEP295 | PTC03 | Human | Thyroid | PTC | 4.63e-02 | 1.61e-01 | 0.1784 |
| 85459 | CEP295 | PTC04 | Human | Thyroid | PTC | 6.76e-10 | 1.69e-01 | 0.1927 |
| 85459 | CEP295 | PTC05 | Human | Thyroid | PTC | 7.62e-15 | 5.16e-01 | 0.2065 |
| 85459 | CEP295 | PTC06 | Human | Thyroid | PTC | 3.50e-21 | 5.08e-01 | 0.2057 |
| 85459 | CEP295 | PTC07 | Human | Thyroid | PTC | 7.21e-18 | 3.38e-01 | 0.2044 |
| 85459 | CEP295 | ATC12 | Human | Thyroid | ATC | 2.65e-19 | 4.37e-01 | 0.34 |
| 85459 | CEP295 | ATC13 | Human | Thyroid | ATC | 2.49e-19 | 2.22e-01 | 0.34 |
| 85459 | CEP295 | ATC2 | Human | Thyroid | ATC | 5.89e-12 | 7.75e-01 | 0.34 |
| 85459 | CEP295 | ATC4 | Human | Thyroid | ATC | 4.51e-23 | 5.58e-01 | 0.34 |
| 85459 | CEP295 | ATC5 | Human | Thyroid | ATC | 1.51e-16 | 2.46e-01 | 0.34 |
| Page: 1 |
| Tissue | Expression Dynamics | Abbreviation |
| Liver |  | HCC: Hepatocellular carcinoma |
| NAFLD: Non-alcoholic fatty liver disease | ||
| Thyroid | 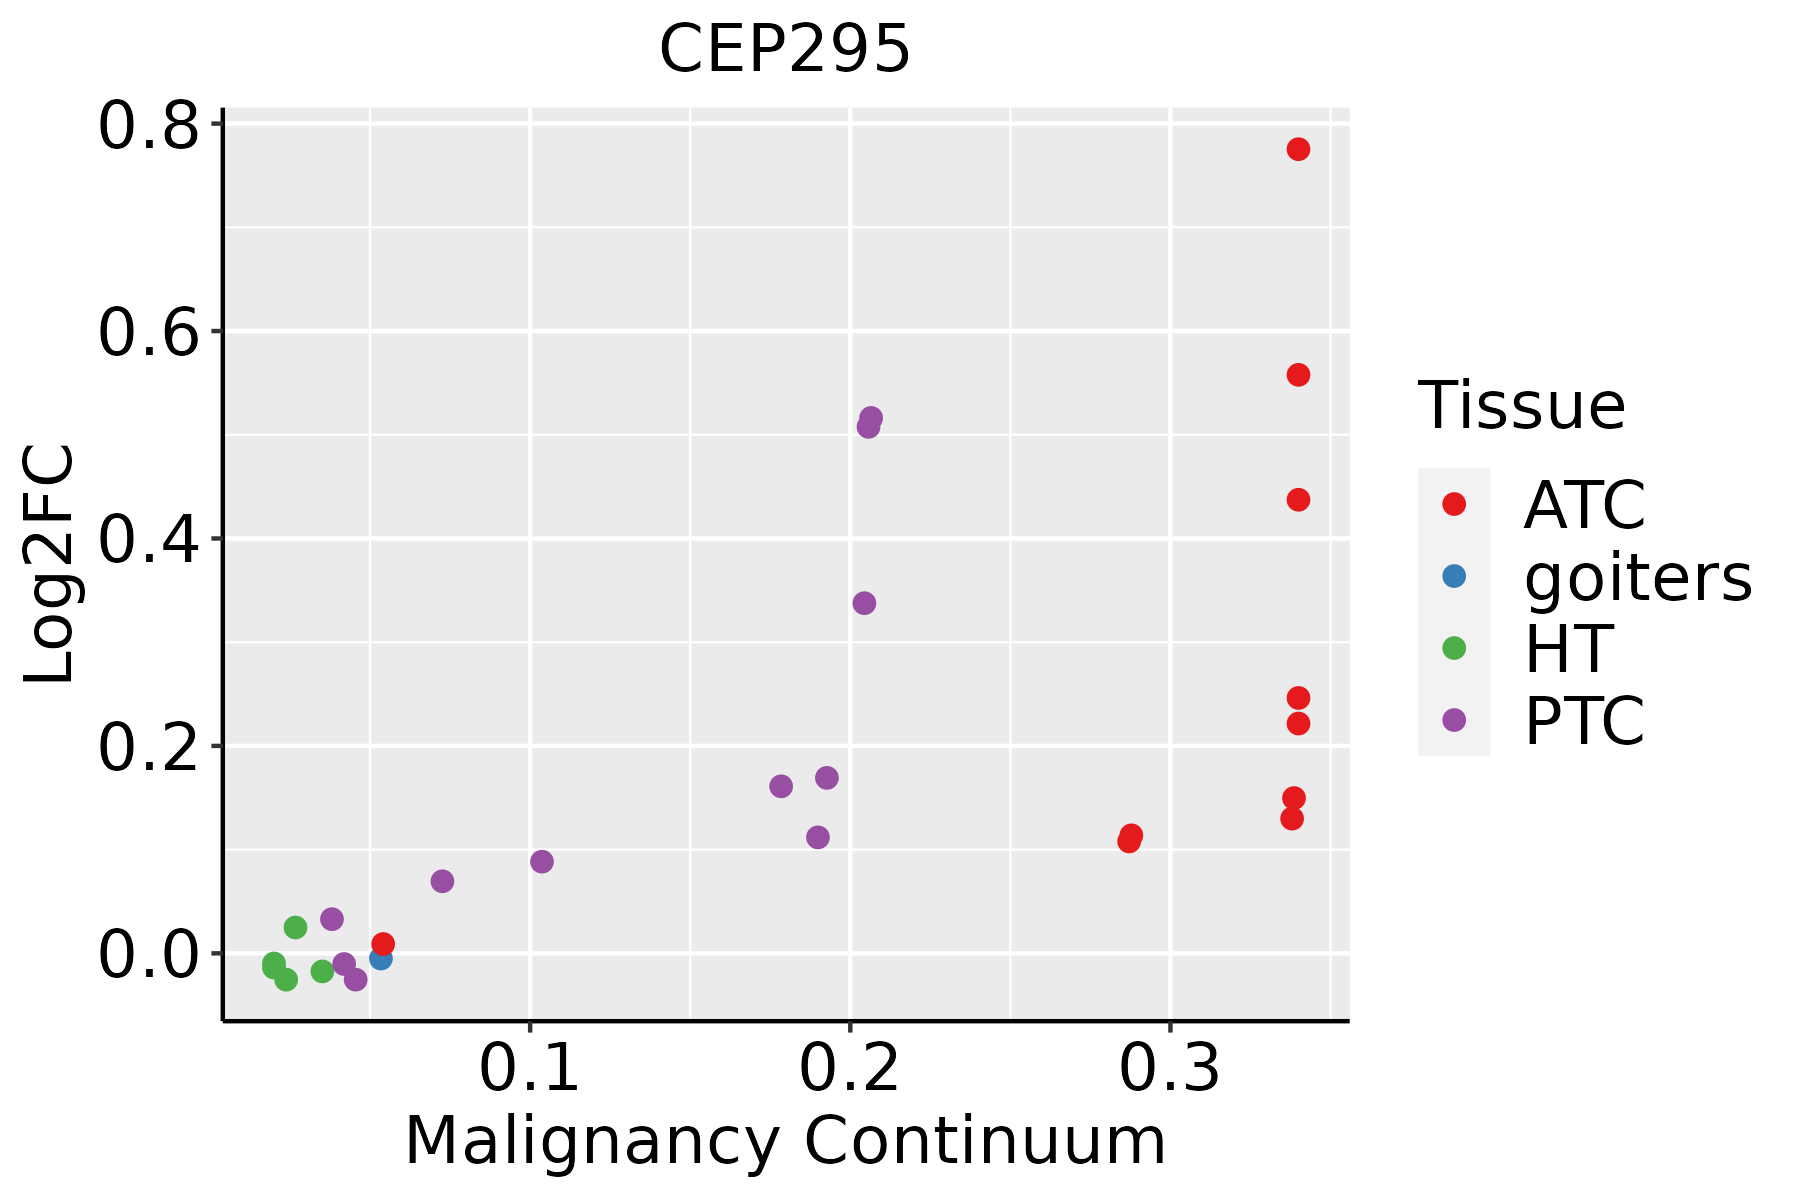 | ATC: Anaplastic thyroid cancer |
| HT: Hashimoto's thyroiditis | ||
| PTC: Papillary thyroid cancer |
| ∗log2FC in expression of this searched gene in stem-like cells from each diseased tissue sample relative to stem-like cells in normal samples in each tissue plotted against the malignancy continuum. Samples are colored based on if they are from different disease stage. |
Top |
Malignant transformation related pathway analysis |
| Find out the enriched GO biological processes and KEGG pathways involved in transition from healthy to precancer to cancer |
| Tissue | Disease Stage | Enriched GO biological Processes |
| Colorectum | AD |  |
| Colorectum | SER |  |
| Colorectum | MSS |  |
| Colorectum | MSI-H |  |
| Colorectum | FAP |  |
| ∗Top 15 enriched GO BP terms are showed in the bar plot of each disease state in each tissue. Each row represents a significant GO biological process which is colored according to the -log10(p.adjust). |
| Page: 1 2 3 4 5 6 7 8 9 |
| GO ID | Tissue | Disease Stage | Description | Gene Ratio | Bg Ratio | pvalue | p.adjust | Count |
| GO:190495122 | Liver | HCC | positive regulation of establishment of protein localization | 207/7958 | 319/18723 | 3.95e-16 | 3.29e-14 | 207 |
| GO:00064732 | Liver | HCC | protein acetylation | 135/7958 | 201/18723 | 1.20e-12 | 5.92e-11 | 135 |
| GO:00435432 | Liver | HCC | protein acylation | 157/7958 | 243/18723 | 2.40e-12 | 1.12e-10 | 157 |
| GO:005149522 | Liver | HCC | positive regulation of cytoskeleton organization | 138/7958 | 226/18723 | 1.26e-08 | 3.12e-07 | 138 |
| GO:19021151 | Liver | HCC | regulation of organelle assembly | 110/7958 | 186/18723 | 3.30e-06 | 4.34e-05 | 110 |
| GO:004578711 | Liver | HCC | positive regulation of cell cycle | 172/7958 | 313/18723 | 5.29e-06 | 6.58e-05 | 172 |
| GO:0031023 | Liver | HCC | microtubule organizing center organization | 82/7958 | 143/18723 | 2.38e-04 | 1.79e-03 | 82 |
| GO:0007098 | Liver | HCC | centrosome cycle | 75/7958 | 130/18723 | 3.33e-04 | 2.34e-03 | 75 |
| GO:19019831 | Liver | HCC | regulation of protein acetylation | 48/7958 | 77/18723 | 3.49e-04 | 2.43e-03 | 48 |
| GO:00900683 | Liver | HCC | positive regulation of cell cycle process | 125/7958 | 236/18723 | 7.21e-04 | 4.40e-03 | 125 |
| GO:1902117 | Liver | HCC | positive regulation of organelle assembly | 41/7958 | 67/18723 | 1.55e-03 | 8.20e-03 | 41 |
| GO:0032886 | Liver | HCC | regulation of microtubule-based process | 123/7958 | 240/18723 | 3.69e-03 | 1.64e-02 | 123 |
| GO:00466052 | Liver | HCC | regulation of centrosome cycle | 30/7958 | 49/18723 | 6.31e-03 | 2.57e-02 | 30 |
| GO:1901985 | Liver | HCC | positive regulation of protein acetylation | 27/7958 | 45/18723 | 1.35e-02 | 4.80e-02 | 27 |
| GO:1904951113 | Thyroid | PTC | positive regulation of establishment of protein localization | 175/5968 | 319/18723 | 1.10e-17 | 1.12e-15 | 175 |
| GO:00064737 | Thyroid | PTC | protein acetylation | 116/5968 | 201/18723 | 3.05e-14 | 1.92e-12 | 116 |
| GO:00435437 | Thyroid | PTC | protein acylation | 134/5968 | 243/18723 | 4.22e-14 | 2.58e-12 | 134 |
| GO:005149526 | Thyroid | PTC | positive regulation of cytoskeleton organization | 121/5968 | 226/18723 | 1.04e-11 | 4.27e-10 | 121 |
| GO:004578718 | Thyroid | PTC | positive regulation of cell cycle | 144/5968 | 313/18723 | 9.93e-08 | 1.99e-06 | 144 |
| GO:19019837 | Thyroid | PTC | regulation of protein acetylation | 46/5968 | 77/18723 | 4.26e-07 | 7.03e-06 | 46 |
| Page: 1 2 3 |
| Pathway ID | Tissue | Disease Stage | Description | Gene Ratio | Bg Ratio | pvalue | p.adjust | qvalue | Count |
| Page: 1 |
Top |
Cell-cell communication analysis |
| Identification of potential cell-cell interactions between two cell types and their ligand-receptor pairs for different disease states |
| Ligand | Receptor | LRpair | Pathway | Tissue | Disease Stage |
| Page: 1 |
Top |
Single-cell gene regulatory network inference analysis |
| Find out the significant the regulons (TFs) and the target genes of each regulon across cell types for different disease states |
| TF | Cell Type | Tissue | Disease Stage | Target Gene | RSS | Regulon Activity |
| ∗The dot plots of a searched regulon are shown for all cell subpopulations in each disease state of each tissue based on the regulon specific score inferred using pySCENIC and by calculating the average expression. |
| Page: 1 |
Top |
Somatic mutation of malignant transformation related genes |
| Annotation of somatic variants for genes involved in malignant transformation |
| Hugo Symbol | Variant Class | Variant Classification | dbSNP RS | HGVSc | HGVSp | HGVSp Short | SWISSPROT | BIOTYPE | SIFT | PolyPhen | Tumor Sample Barcode | Tissue | Histology | Sex | Age | Stage | Therapy Types | Drugs | Outcome |
| CEP295 | SNV | Missense_Mutation | c.6295N>T | p.Pro2099Ser | p.P2099S | Q9C0D2 | protein_coding | deleterious(0.01) | benign(0.023) | TCGA-A2-A0YK-01 | Breast | breast invasive carcinoma | Female | <65 | I/II | Chemotherapy | cytoxan | SD | |
| CEP295 | SNV | Missense_Mutation | rs745824491 | c.4031N>C | p.Ile1344Thr | p.I1344T | Q9C0D2 | protein_coding | tolerated(0.1) | possibly_damaging(0.906) | TCGA-A2-A1G4-01 | Breast | breast invasive carcinoma | Female | >=65 | III/IV | Chemotherapy | adriamycin | SD |
| CEP295 | SNV | Missense_Mutation | novel | c.7603N>A | p.Val2535Ile | p.V2535I | Q9C0D2 | protein_coding | tolerated(0.1) | benign(0.007) | TCGA-A7-A6VY-01 | Breast | breast invasive carcinoma | Female | <65 | I/II | Chemotherapy | cyclophosphamide | CR |
| CEP295 | SNV | Missense_Mutation | rs760271651 | c.6727G>A | p.Asp2243Asn | p.D2243N | Q9C0D2 | protein_coding | tolerated(0.08) | benign(0.018) | TCGA-AC-A23H-01 | Breast | breast invasive carcinoma | Female | >=65 | I/II | Unknown | Unknown | PD |
| CEP295 | SNV | Missense_Mutation | novel | c.1847N>T | p.Ser616Leu | p.S616L | Q9C0D2 | protein_coding | deleterious(0.01) | possibly_damaging(0.6) | TCGA-AN-A046-01 | Breast | breast invasive carcinoma | Female | >=65 | I/II | Unknown | Unknown | SD |
| CEP295 | SNV | Missense_Mutation | novel | c.3194C>T | p.Thr1065Ile | p.T1065I | Q9C0D2 | protein_coding | tolerated(0.16) | benign(0.025) | TCGA-B6-A0IN-01 | Breast | breast invasive carcinoma | Female | <65 | I/II | Unknown | Unknown | PD |
| CEP295 | SNV | Missense_Mutation | rs745824491 | c.4031T>C | p.Ile1344Thr | p.I1344T | Q9C0D2 | protein_coding | tolerated(0.1) | possibly_damaging(0.906) | TCGA-B6-A1KC-01 | Breast | breast invasive carcinoma | Female | >=65 | I/II | Unknown | Unknown | SD |
| CEP295 | SNV | Missense_Mutation | c.3103G>C | p.Asp1035His | p.D1035H | Q9C0D2 | protein_coding | deleterious(0) | possibly_damaging(0.568) | TCGA-BH-A0W7-01 | Breast | breast invasive carcinoma | Female | <65 | I/II | Chemotherapy | taxotere | CR | |
| CEP295 | SNV | Missense_Mutation | c.935N>G | p.Tyr312Cys | p.Y312C | Q9C0D2 | protein_coding | deleterious(0.01) | possibly_damaging(0.51) | TCGA-BH-A18G-01 | Breast | breast invasive carcinoma | Female | >=65 | I/II | Unknown | Unknown | SD | |
| CEP295 | SNV | Missense_Mutation | novel | c.6088N>G | p.Leu2030Val | p.L2030V | Q9C0D2 | protein_coding | tolerated(0.23) | benign(0.025) | TCGA-BH-A2L8-01 | Breast | breast invasive carcinoma | Female | <65 | I/II | Chemotherapy | cytoxan | CR |
| Page: 1 2 3 4 5 6 7 8 9 10 11 12 13 14 15 16 |
Top |
Related drugs of malignant transformation related genes |
| Identification of chemicals and drugs interact with genes involved in malignant transfromation |
| (DGIdb 4.0) |
| Entrez ID | Symbol | Category | Interaction Types | Drug Claim Name | Drug Name | PMIDs |
| Page: 1 |

Copyright 2023-Present -The University of Texas Health Science Center at Houston |