Schematic overview of the cellular and molecular mechanisms involved in the cancer progression, including the proposed cellular and molecular mechanisms in cancer cells trajectory. AT1: alveolar type 1 cells; AT2: alveolar type 2 cells; AAH: atypical adenomatous hyperplasia; AIS: adenocarcinoma in situ; MIA: minimally invasive adenocarcinoma; IA: invasive adenocarcinoma; EMT: epithelial-mesenchymal transition

Home

Download

Statistics

Help

Contact

Center for Computational Systems Medicine
leaf

Gene summary

leaf

Malignant transformation analysis

leaf

Malignant transformation related pathway analysis

leaf

Cell-cell communication analysis

leaf

Single-cell gene regulatory network inference analysis

leaf

Somatic mutation of malignant transformation related genes

leaf

Related drugs of malignant transformation related genes

Gene: CEP290

Gene summary for CEP290

check button Gene summary.

Gene informationSpeciesHuman
Gene symbol

CEP290

Gene ID

80184

Gene namecentrosomal protein 290
Gene Alias3H11Ag
Cytomap12q21.32
Gene Typeprotein-coding
GO ID

GO:0001654

UniProtAcc

O15078


Top

Malignant transformation analysis

check button Identification of the aberrant gene expression in precancerous and cancerous lesions by comparing the gene expression of stem-like cells in diseased tissues with normal stem cells
check button Malignant transformation involving gene list.
Entrez IDSymbolReplicatesSpeciesOrganTissueAdj P-valueLog2FCMalignancy
80184CEP290LZE4THumanEsophagusESCC2.76e-082.95e-010.0811
80184CEP290LZE5THumanEsophagusESCC4.73e-053.13e-010.0514
80184CEP290LZE7THumanEsophagusESCC8.63e-083.18e-010.0667
80184CEP290LZE8THumanEsophagusESCC5.30e-041.62e-010.067
80184CEP290LZE24THumanEsophagusESCC6.21e-102.80e-010.0596
80184CEP290P1T-EHumanEsophagusESCC2.10e-144.91e-010.0875
80184CEP290P2T-EHumanEsophagusESCC5.93e-471.05e+000.1177
80184CEP290P4T-EHumanEsophagusESCC6.21e-255.21e-010.1323
80184CEP290P5T-EHumanEsophagusESCC4.63e-214.46e-010.1327
80184CEP290P8T-EHumanEsophagusESCC5.99e-254.24e-010.0889
80184CEP290P9T-EHumanEsophagusESCC2.13e-122.22e-010.1131
80184CEP290P10T-EHumanEsophagusESCC2.44e-214.36e-010.116
80184CEP290P11T-EHumanEsophagusESCC3.09e-103.79e-010.1426
80184CEP290P12T-EHumanEsophagusESCC1.17e-214.28e-010.1122
80184CEP290P15T-EHumanEsophagusESCC1.54e-133.37e-010.1149
80184CEP290P16T-EHumanEsophagusESCC3.30e-345.35e-010.1153
80184CEP290P17T-EHumanEsophagusESCC2.40e-083.79e-010.1278
80184CEP290P19T-EHumanEsophagusESCC2.65e-045.74e-010.1662
80184CEP290P20T-EHumanEsophagusESCC3.35e-153.14e-010.1124
80184CEP290P21T-EHumanEsophagusESCC1.88e-214.86e-010.1617
Page: 1 2 3 4 5 6 

check button Transcriptomic changes along malignancy continuum.
TissueExpression DynamicsAbbreviation
EsophagusThe image shows the transcriptomic changes along malignancy continuum.log2FC in expression of this searched gene in stem-like cells from each diseased tissue sample relative to stem-like cells in normal samples in each tissue plotted against the malignancy continuum. Samples are colored based on if they are from different disease stage.ESCC: Esophageal squamous cell carcinoma
HGIN: High-grade intraepithelial neoplasias
LGIN: Low-grade intraepithelial neoplasias
LiverThe image shows the transcriptomic changes along malignancy continuum.log2FC in expression of this searched gene in stem-like cells from each diseased tissue sample relative to stem-like cells in normal samples in each tissue plotted against the malignancy continuum. Samples are colored based on if they are from different disease stage.
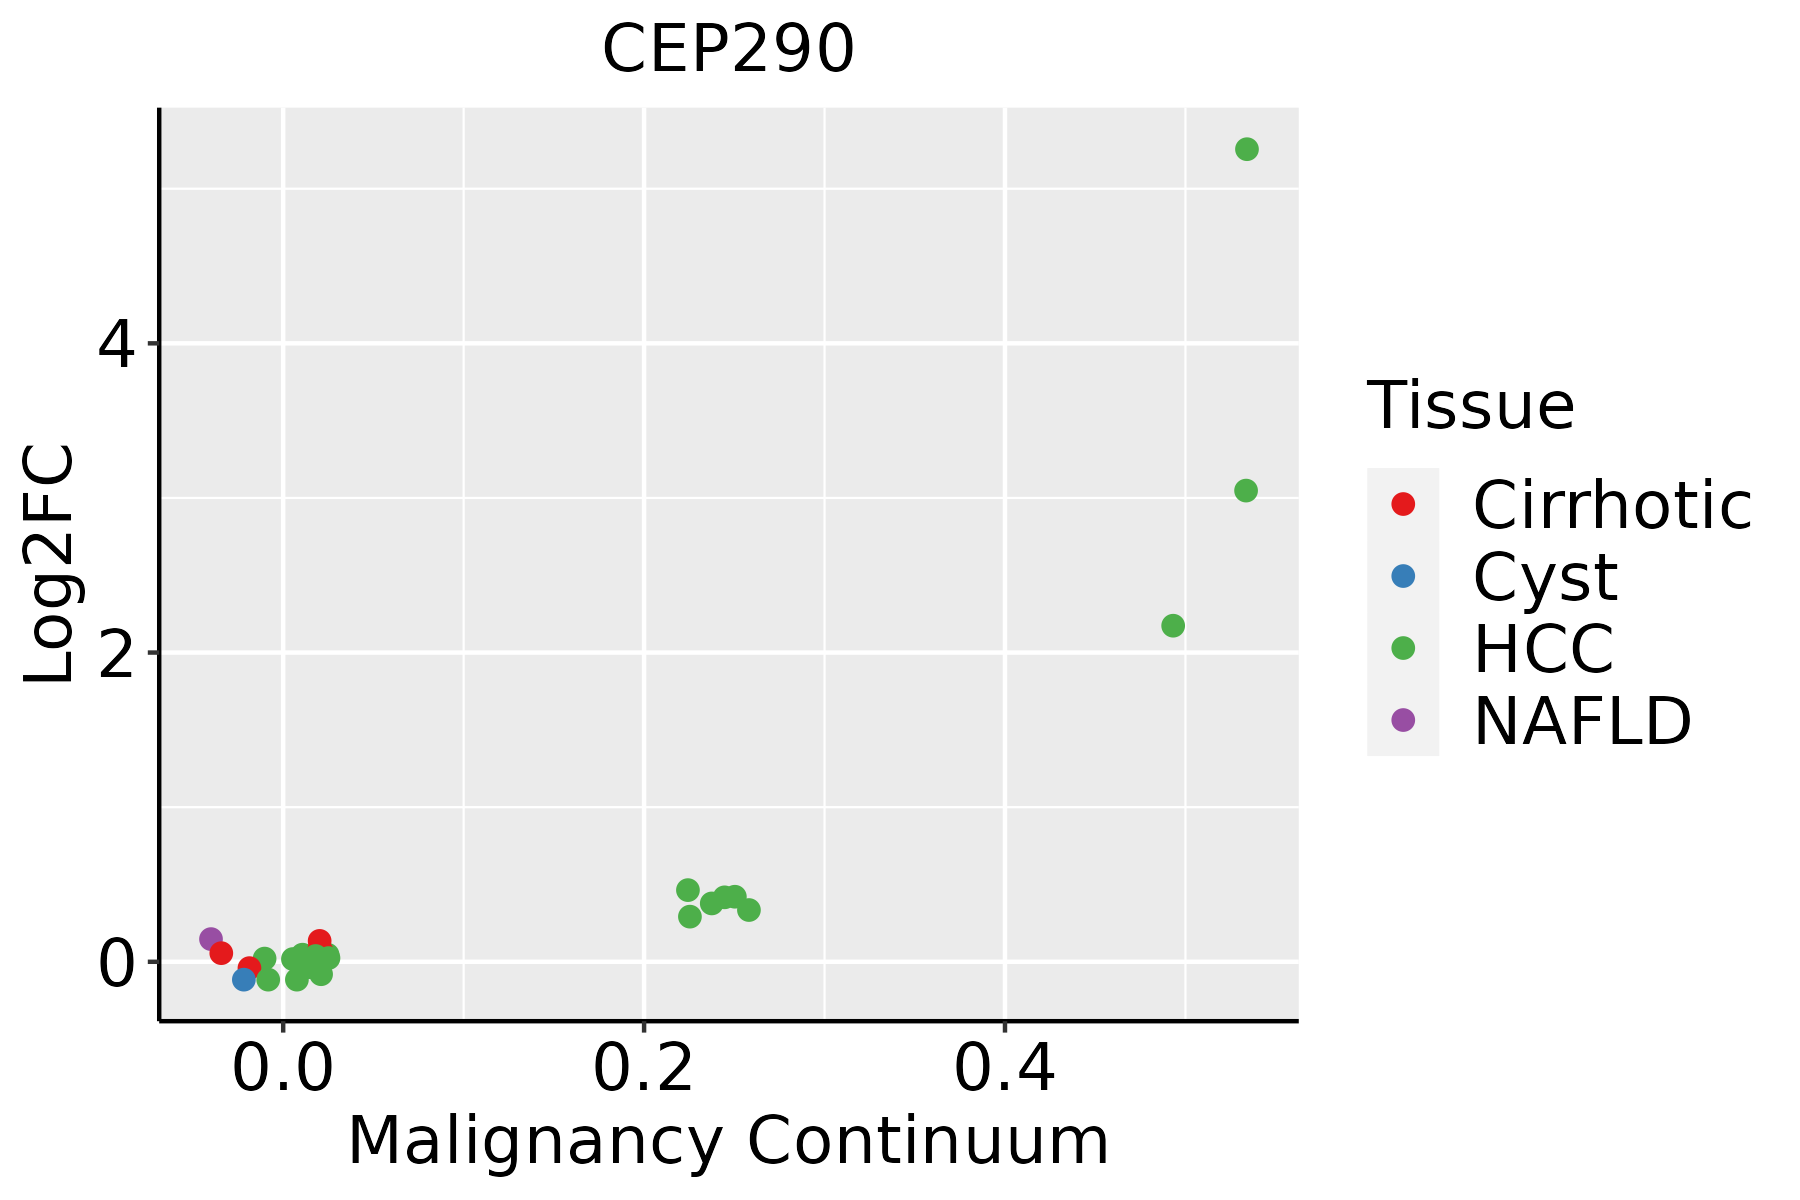
HCC: Hepatocellular carcinoma
NAFLD: Non-alcoholic fatty liver disease
Oral CavityThe image shows the transcriptomic changes along malignancy continuum.log2FC in expression of this searched gene in stem-like cells from each diseased tissue sample relative to stem-like cells in normal samples in each tissue plotted against the malignancy continuum. Samples are colored based on if they are from different disease stage.EOLP: Erosive Oral lichen planus
LP: leukoplakia
NEOLP: Non-erosive oral lichen planus
OSCC: Oral squamous cell carcinoma
SkinThe image shows the transcriptomic changes along malignancy continuum.log2FC in expression of this searched gene in stem-like cells from each diseased tissue sample relative to stem-like cells in normal samples in each tissue plotted against the malignancy continuum. Samples are colored based on if they are from different disease stage.
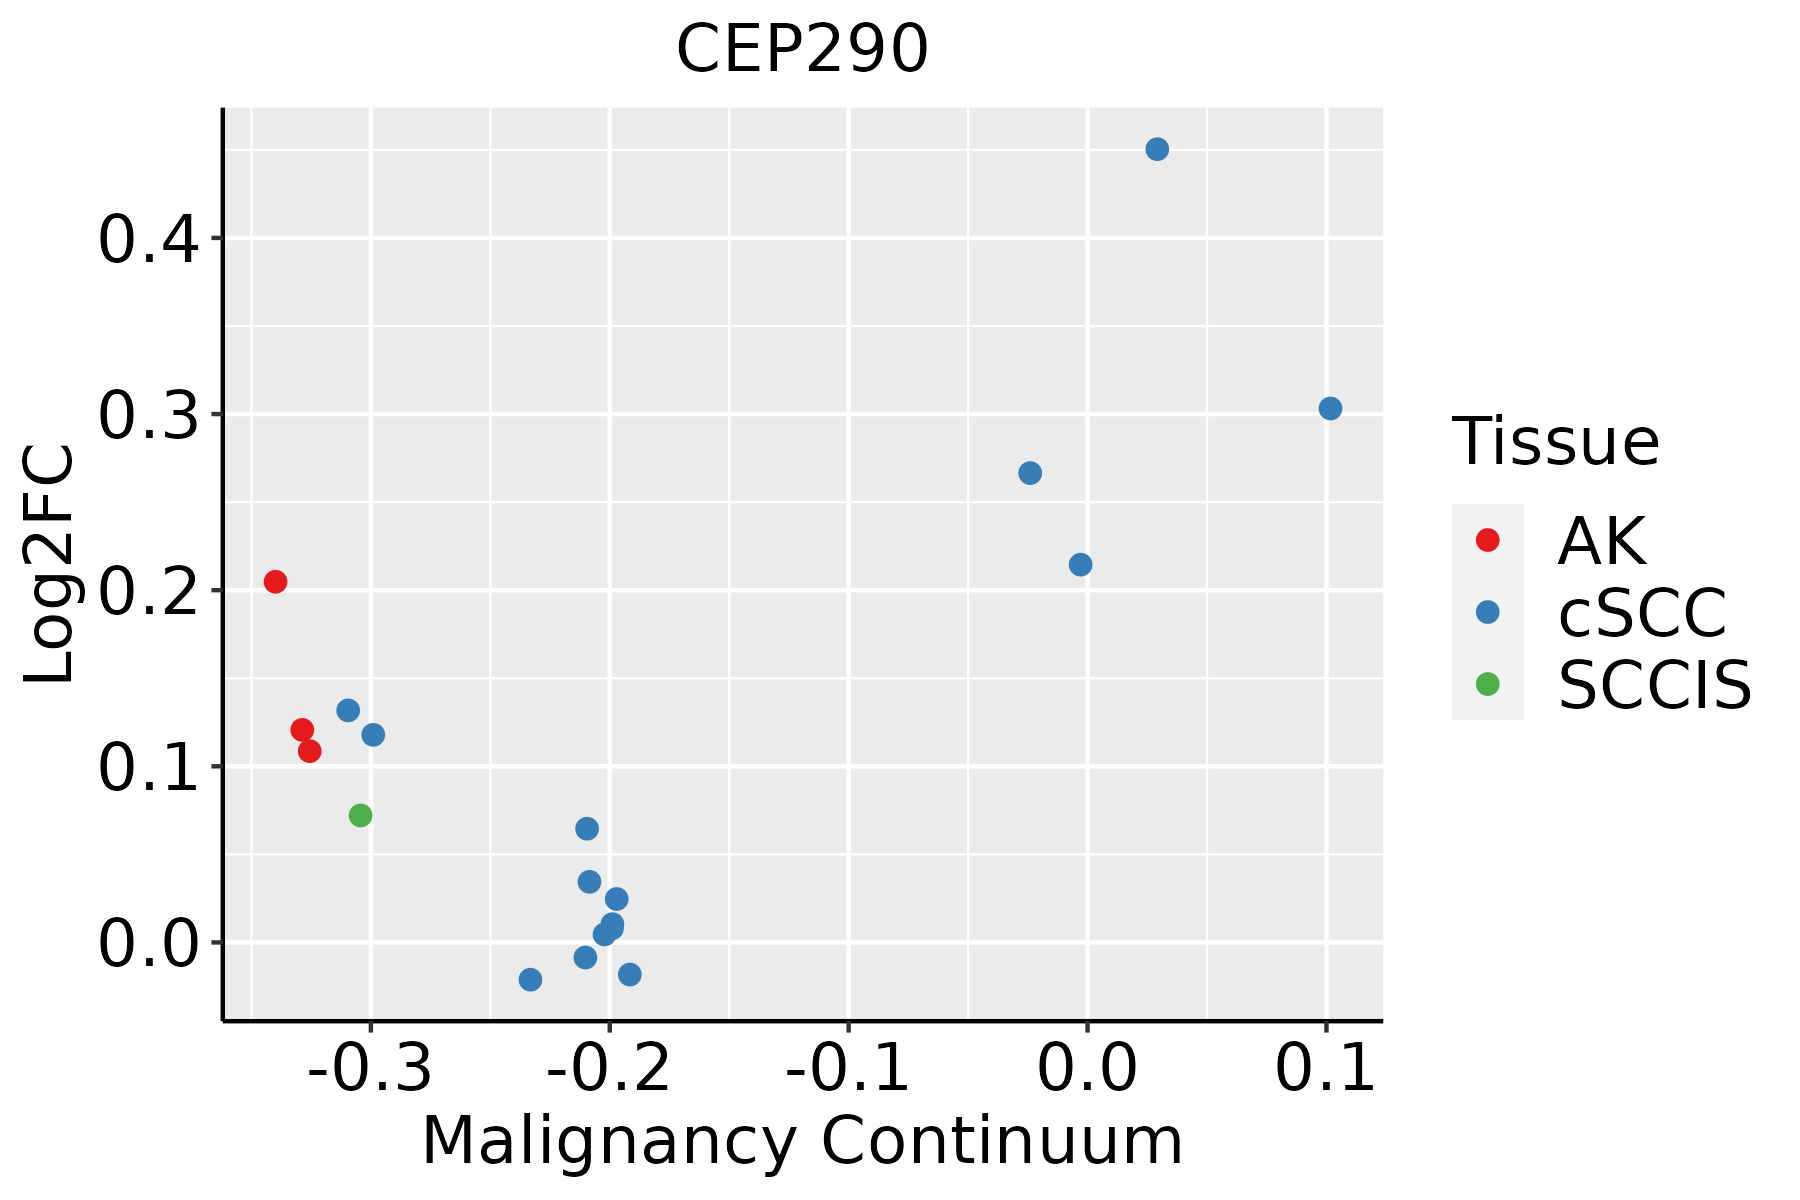
AK: Actinic keratosis
cSCC: Cutaneous squamous cell carcinoma
SCCIS:squamous cell carcinoma in situ
ThyroidThe image shows the transcriptomic changes along malignancy continuum.log2FC in expression of this searched gene in stem-like cells from each diseased tissue sample relative to stem-like cells in normal samples in each tissue plotted against the malignancy continuum. Samples are colored based on if they are from different disease stage.
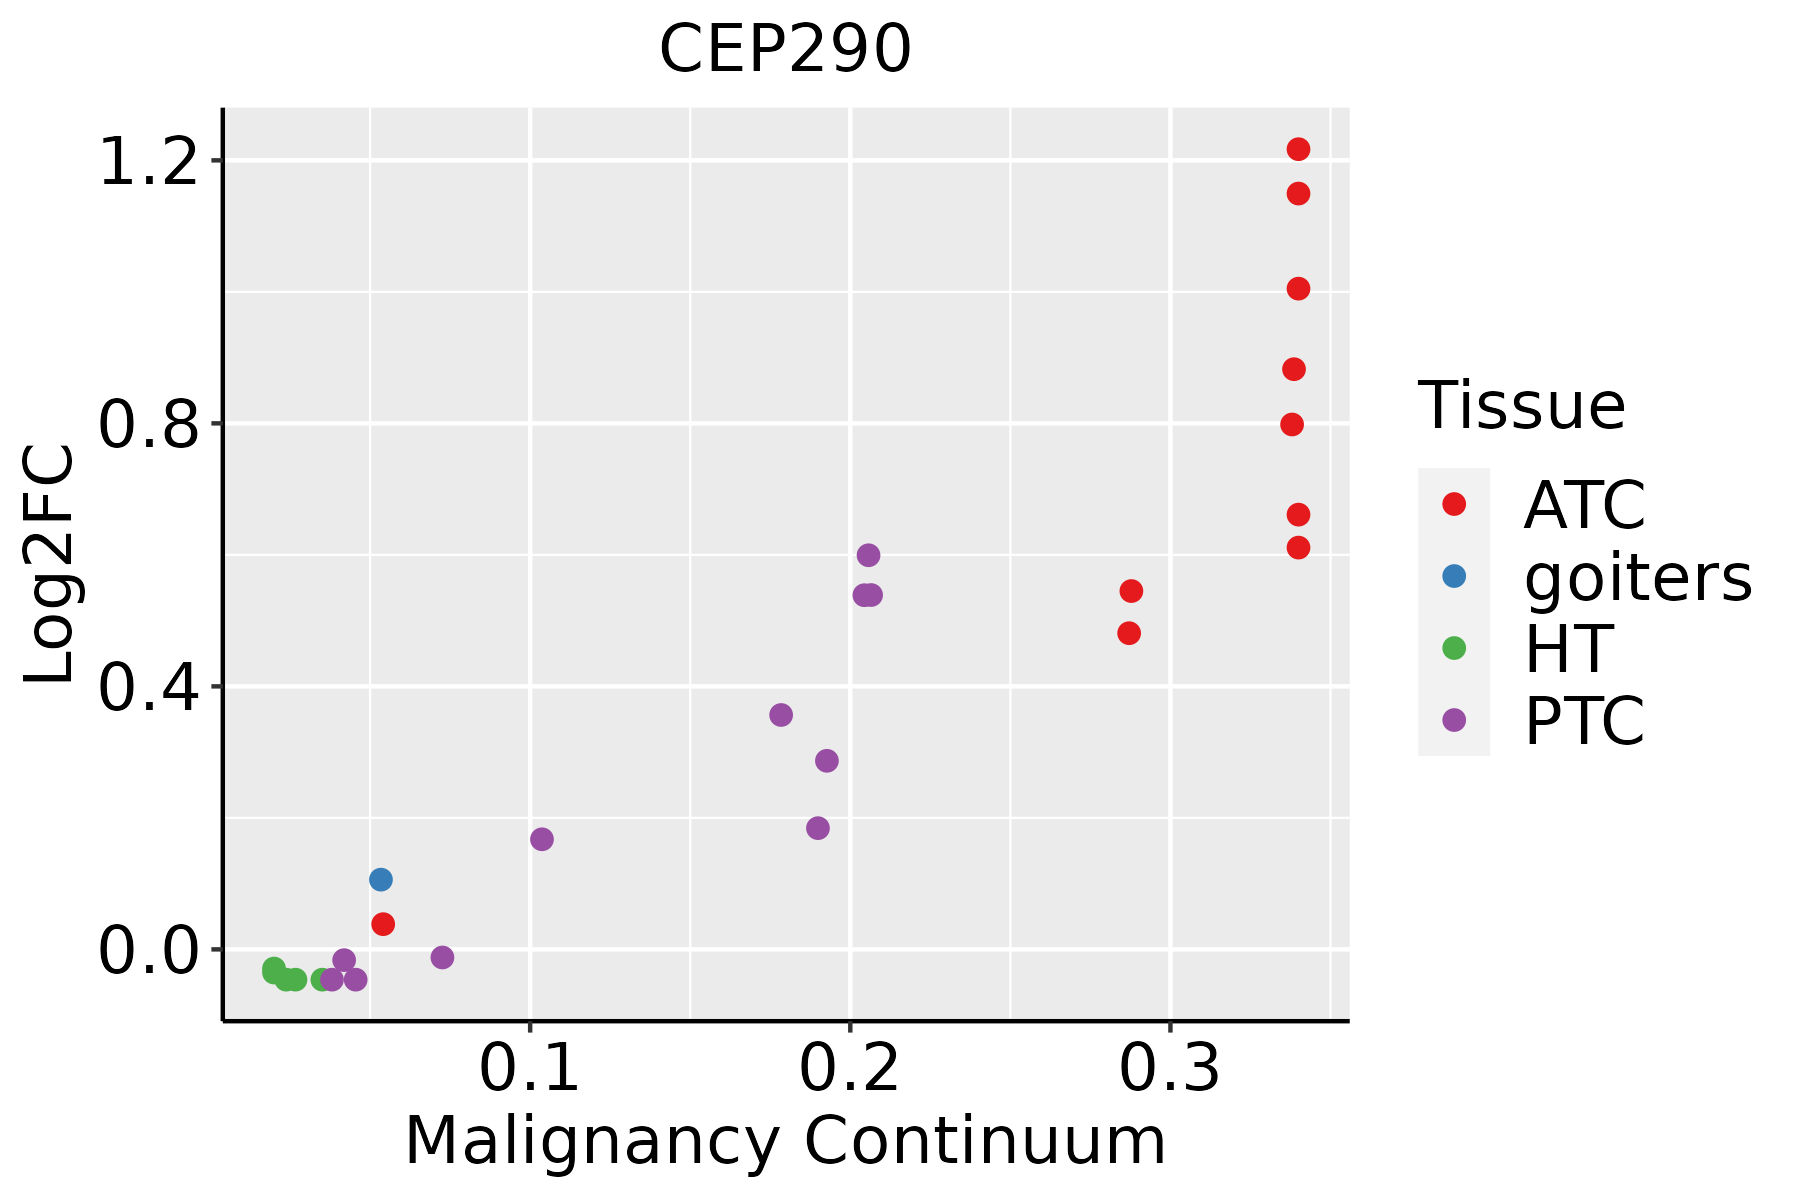
ATC: Anaplastic thyroid cancer
HT: Hashimoto's thyroiditis
PTC: Papillary thyroid cancer
∗log2FC in expression of this searched gene in stem-like cells from each diseased tissue sample relative to stem-like cells in normal samples in each tissue plotted against the malignancy continuum. Samples are colored based on if they are from different disease stage.

Top

Malignant transformation related pathway analysis

check buttonFind out the enriched GO biological processes and KEGG pathways involved in transition from healthy to precancer to cancer
check button Figure of enriched GO biological processes.
TissueDisease StageEnriched GO biological Processes
ColorectumADGO analysis - Figure of enriched GO biological processes: Top 15 enriched GO BP terms are showed in the bar plot of each disease state in each tissue. Each row represents a significant GO biological process which is colored according to the -log10(p.adjust).
ColorectumSERGO analysis - Figure of enriched GO biological processes: Top 15 enriched GO BP terms are showed in the bar plot of each disease state in each tissue. Each row represents a significant GO biological process which is colored according to the -log10(p.adjust).
ColorectumMSSGO analysis - Figure of enriched GO biological processes: Top 15 enriched GO BP terms are showed in the bar plot of each disease state in each tissue. Each row represents a significant GO biological process which is colored according to the -log10(p.adjust).
ColorectumMSI-HGO analysis - Figure of enriched GO biological processes: Top 15 enriched GO BP terms are showed in the bar plot of each disease state in each tissue. Each row represents a significant GO biological process which is colored according to the -log10(p.adjust).
ColorectumFAPGO analysis - Figure of enriched GO biological processes: Top 15 enriched GO BP terms are showed in the bar plot of each disease state in each tissue. Each row represents a significant GO biological process which is colored according to the -log10(p.adjust).
∗Top 15 enriched GO BP terms are showed in the bar plot of each disease state in each tissue. Each row represents a significant GO biological process which is colored according to the -log10(p.adjust).
Page: 1 2 3 4 5 6 7 8 9 

check button Enriched GO biological processes.
GO IDTissueDisease StageDescriptionGene RatioBg Ratiopvaluep.adjustCount
GO:003238618EsophagusESCCregulation of intracellular transport243/8552337/187233.20e-237.25e-21243
GO:0033157110EsophagusESCCregulation of intracellular protein transport169/8552229/187233.31e-183.23e-16169
GO:0032388110EsophagusESCCpositive regulation of intracellular transport152/8552202/187237.89e-187.36e-16152
GO:1904951111EsophagusESCCpositive regulation of establishment of protein localization216/8552319/187231.01e-156.86e-14216
GO:009031617EsophagusESCCpositive regulation of intracellular protein transport122/8552160/187232.45e-151.49e-13122
GO:0051222111EsophagusESCCpositive regulation of protein transport204/8552303/187231.56e-148.38e-13204
GO:00224069EsophagusESCCmembrane docking62/855286/187235.93e-077.79e-0662
GO:003514815EsophagusESCCtube formation96/8552148/187231.86e-062.16e-0596
GO:00721759EsophagusESCCepithelial tube formation86/8552132/187234.81e-065.10e-0586
GO:006056210EsophagusESCCepithelial tube morphogenesis187/8552325/187239.95e-069.44e-05187
GO:01400567EsophagusESCCorganelle localization by membrane tethering53/855277/187233.33e-052.74e-0453
GO:00485687EsophagusESCCembryonic organ development228/8552427/187237.28e-043.79e-03228
GO:19055153EsophagusESCCnon-motile cilium assembly39/855261/187233.08e-031.28e-0239
GO:00016559EsophagusESCCurogenital system development177/8552338/187237.51e-032.69e-02177
GO:003238621LiverHCCregulation of intracellular transport231/7958337/187231.99e-223.40e-20231
GO:003315721LiverHCCregulation of intracellular protein transport165/7958229/187238.37e-201.15e-17165
GO:003238821LiverHCCpositive regulation of intracellular transport148/7958202/187235.15e-196.66e-17148
GO:009031621LiverHCCpositive regulation of intracellular protein transport121/7958160/187231.27e-171.39e-15121
GO:190495122LiverHCCpositive regulation of establishment of protein localization207/7958319/187233.95e-163.29e-14207
GO:005122222LiverHCCpositive regulation of protein transport194/7958303/187232.41e-141.56e-12194
Page: 1 2 3 4 5 

check button Enriched KEGG pathways.
Pathway IDTissueDisease StageDescriptionGene RatioBg Ratiopvaluep.adjustqvalueCount
Page: 1 

Top

Cell-cell communication analysis

check buttonIdentification of potential cell-cell interactions between two cell types and their ligand-receptor pairs for different disease states
LigandReceptorLRpairPathwayTissueDisease Stage
Page: 1 

Top

Single-cell gene regulatory network inference analysis

check buttonFind out the significant the regulons (TFs) and the target genes of each regulon across cell types for different disease states
TFCell TypeTissueDisease StageTarget GeneRSSRegulon Activity
∗The dot plots of a searched regulon are shown for all cell subpopulations in each disease state of each tissue based on the regulon specific score inferred using pySCENIC and by calculating the average expression.
Page: 1 

Top

Somatic mutation of malignant transformation related genes

check buttonAnnotation of somatic variants for genes involved in malignant transformation
Hugo SymbolVariant ClassVariant ClassificationdbSNP RSHGVScHGVSpHGVSp ShortSWISSPROTBIOTYPESIFTPolyPhenTumor Sample BarcodeTissueHistologySexAgeStageTherapy TypesDrugsOutcome
CEP290SNVMissense_Mutationc.5234G>Ap.Ser1745Asnp.S1745NO15078protein_codingdeleterious(0)probably_damaging(0.999)TCGA-A1-A0SG-01Breastbreast invasive carcinomaFemale<65I/IIChemotherapySD
CEP290SNVMissense_Mutationrs376425111c.4063C>Tp.Arg1355Cysp.R1355CO15078protein_codingdeleterious(0)probably_damaging(0.972)TCGA-A2-A0YG-01Breastbreast invasive carcinomaFemale<65III/IVChemotherapycytoxanSD
CEP290SNVMissense_Mutationc.1475N>Gp.Lys492Argp.K492RO15078protein_codingtolerated(0.27)benign(0.189)TCGA-A7-A0DA-01Breastbreast invasive carcinomaFemale<65I/IIChemotherapyadriamycinSD
CEP290SNVMissense_Mutationc.1241N>Tp.Asp414Valp.D414VO15078protein_codingdeleterious(0.03)benign(0.026)TCGA-A8-A09Z-01Breastbreast invasive carcinomaFemale>=65I/IIUnknownUnknownSD
CEP290SNVMissense_Mutationrs565584005c.4111N>Ap.Glu1371Lysp.E1371KO15078protein_codingdeleterious(0.03)possibly_damaging(0.67)TCGA-AN-A046-01Breastbreast invasive carcinomaFemale>=65I/IIUnknownUnknownSD
CEP290SNVMissense_Mutationnovelc.2397N>Tp.Lys799Asnp.K799NO15078protein_codingtolerated(0.09)benign(0.006)TCGA-AN-A046-01Breastbreast invasive carcinomaFemale>=65I/IIUnknownUnknownSD
CEP290SNVMissense_Mutationnovelc.1859N>Gp.Glu620Glyp.E620GO15078protein_codingdeleterious(0.01)possibly_damaging(0.856)TCGA-AN-A046-01Breastbreast invasive carcinomaFemale>=65I/IIUnknownUnknownSD
CEP290SNVMissense_Mutationc.1805T>Cp.Met602Thrp.M602TO15078protein_codingtolerated(0.21)benign(0.007)TCGA-AO-A128-01Breastbreast invasive carcinomaFemale<65I/IIChemotherapydoxorubicinSD
CEP290SNVMissense_Mutationc.7420G>Ap.Val2474Ilep.V2474IO15078protein_codingtolerated_low_confidence(0.44)benign(0)TCGA-AQ-A04H-01Breastbreast invasive carcinomaFemale<65III/IVChemotherapytaxotereSD
CEP290SNVMissense_Mutationc.2338N>Gp.Gln780Glup.Q780EO15078protein_codingdeleterious(0.01)benign(0.174)TCGA-AR-A24V-01Breastbreast invasive carcinomaFemale<65I/IIChemotherapydoxorubicinSD
Page: 1 2 3 4 5 6 7 8 9 10 11 12 13 14 15 16 17 18 19 20 21 22 23 24 25 26 27 

Top

Related drugs of malignant transformation related genes

check buttonIdentification of chemicals and drugs interact with genes involved in malignant transfromation
(DGIdb 4.0)
Entrez IDSymbolCategoryInteraction TypesDrug Claim NameDrug NamePMIDs
Page: 1