
|
|||||
|
 | |
| |
| |
| |
| |
| |
|
Gene: CEP192 |
Gene summary for CEP192 |
| Gene information | Species | Human | Gene symbol | CEP192 | Gene ID | 55125 |
| Gene name | centrosomal protein 192 | |
| Gene Alias | PPP1R62 | |
| Cytomap | 18p11.21 | |
| Gene Type | protein-coding | GO ID | GO:0000226 | UniProtAcc | Q8TEP8 |
Top |
Malignant transformation analysis |
| Identification of the aberrant gene expression in precancerous and cancerous lesions by comparing the gene expression of stem-like cells in diseased tissues with normal stem cells |
| Entrez ID | Symbol | Replicates | Species | Organ | Tissue | Adj P-value | Log2FC | Malignancy |
| 55125 | CEP192 | CCI_1 | Human | Cervix | CC | 6.67e-06 | 8.55e-01 | 0.528 |
| 55125 | CEP192 | CCI_2 | Human | Cervix | CC | 2.08e-06 | 6.69e-01 | 0.5249 |
| 55125 | CEP192 | CCI_3 | Human | Cervix | CC | 1.40e-10 | 9.59e-01 | 0.516 |
| 55125 | CEP192 | HTA11_3410_2000001011 | Human | Colorectum | AD | 6.68e-09 | -5.28e-01 | 0.0155 |
| 55125 | CEP192 | HTA11_866_3004761011 | Human | Colorectum | AD | 5.13e-04 | -4.37e-01 | 0.096 |
| 55125 | CEP192 | HTA11_7696_3000711011 | Human | Colorectum | AD | 3.31e-02 | -3.62e-01 | 0.0674 |
| 55125 | CEP192 | HTA11_99999971662_82457 | Human | Colorectum | MSS | 1.09e-03 | -4.03e-01 | 0.3859 |
| 55125 | CEP192 | HTA11_99999973899_84307 | Human | Colorectum | MSS | 2.06e-02 | -5.47e-01 | 0.2585 |
| 55125 | CEP192 | HTA11_99999974143_84620 | Human | Colorectum | MSS | 3.16e-13 | -5.33e-01 | 0.3005 |
| 55125 | CEP192 | A015-C-203 | Human | Colorectum | FAP | 1.75e-24 | -3.23e-01 | -0.1294 |
| 55125 | CEP192 | A015-C-204 | Human | Colorectum | FAP | 4.38e-03 | -1.96e-01 | -0.0228 |
| 55125 | CEP192 | A002-C-201 | Human | Colorectum | FAP | 6.29e-10 | -1.55e-01 | 0.0324 |
| 55125 | CEP192 | A001-C-119 | Human | Colorectum | FAP | 4.13e-05 | -3.04e-01 | -0.1557 |
| 55125 | CEP192 | A001-C-108 | Human | Colorectum | FAP | 1.53e-13 | -1.21e-01 | -0.0272 |
| 55125 | CEP192 | A002-C-205 | Human | Colorectum | FAP | 9.76e-15 | -2.35e-01 | -0.1236 |
| 55125 | CEP192 | A001-C-104 | Human | Colorectum | FAP | 1.63e-03 | -2.94e-02 | 0.0184 |
| 55125 | CEP192 | A015-C-005 | Human | Colorectum | FAP | 1.97e-02 | -1.23e-01 | -0.0336 |
| 55125 | CEP192 | A015-C-006 | Human | Colorectum | FAP | 4.96e-10 | -2.33e-01 | -0.0994 |
| 55125 | CEP192 | A015-C-106 | Human | Colorectum | FAP | 3.41e-07 | -1.42e-01 | -0.0511 |
| 55125 | CEP192 | A002-C-114 | Human | Colorectum | FAP | 2.34e-13 | -3.22e-01 | -0.1561 |
| Page: 1 2 3 4 5 |
| Tissue | Expression Dynamics | Abbreviation |
| Cervix |  | CC: Cervix cancer |
| HSIL_HPV: HPV-infected high-grade squamous intraepithelial lesions | ||
| N_HPV: HPV-infected normal cervix | ||
| Colorectum (GSE201348) |  | FAP: Familial adenomatous polyposis |
| CRC: Colorectal cancer | ||
| Colorectum (HTA11) |  | AD: Adenomas |
| SER: Sessile serrated lesions | ||
| MSI-H: Microsatellite-high colorectal cancer | ||
| MSS: Microsatellite stable colorectal cancer | ||
| Esophagus | 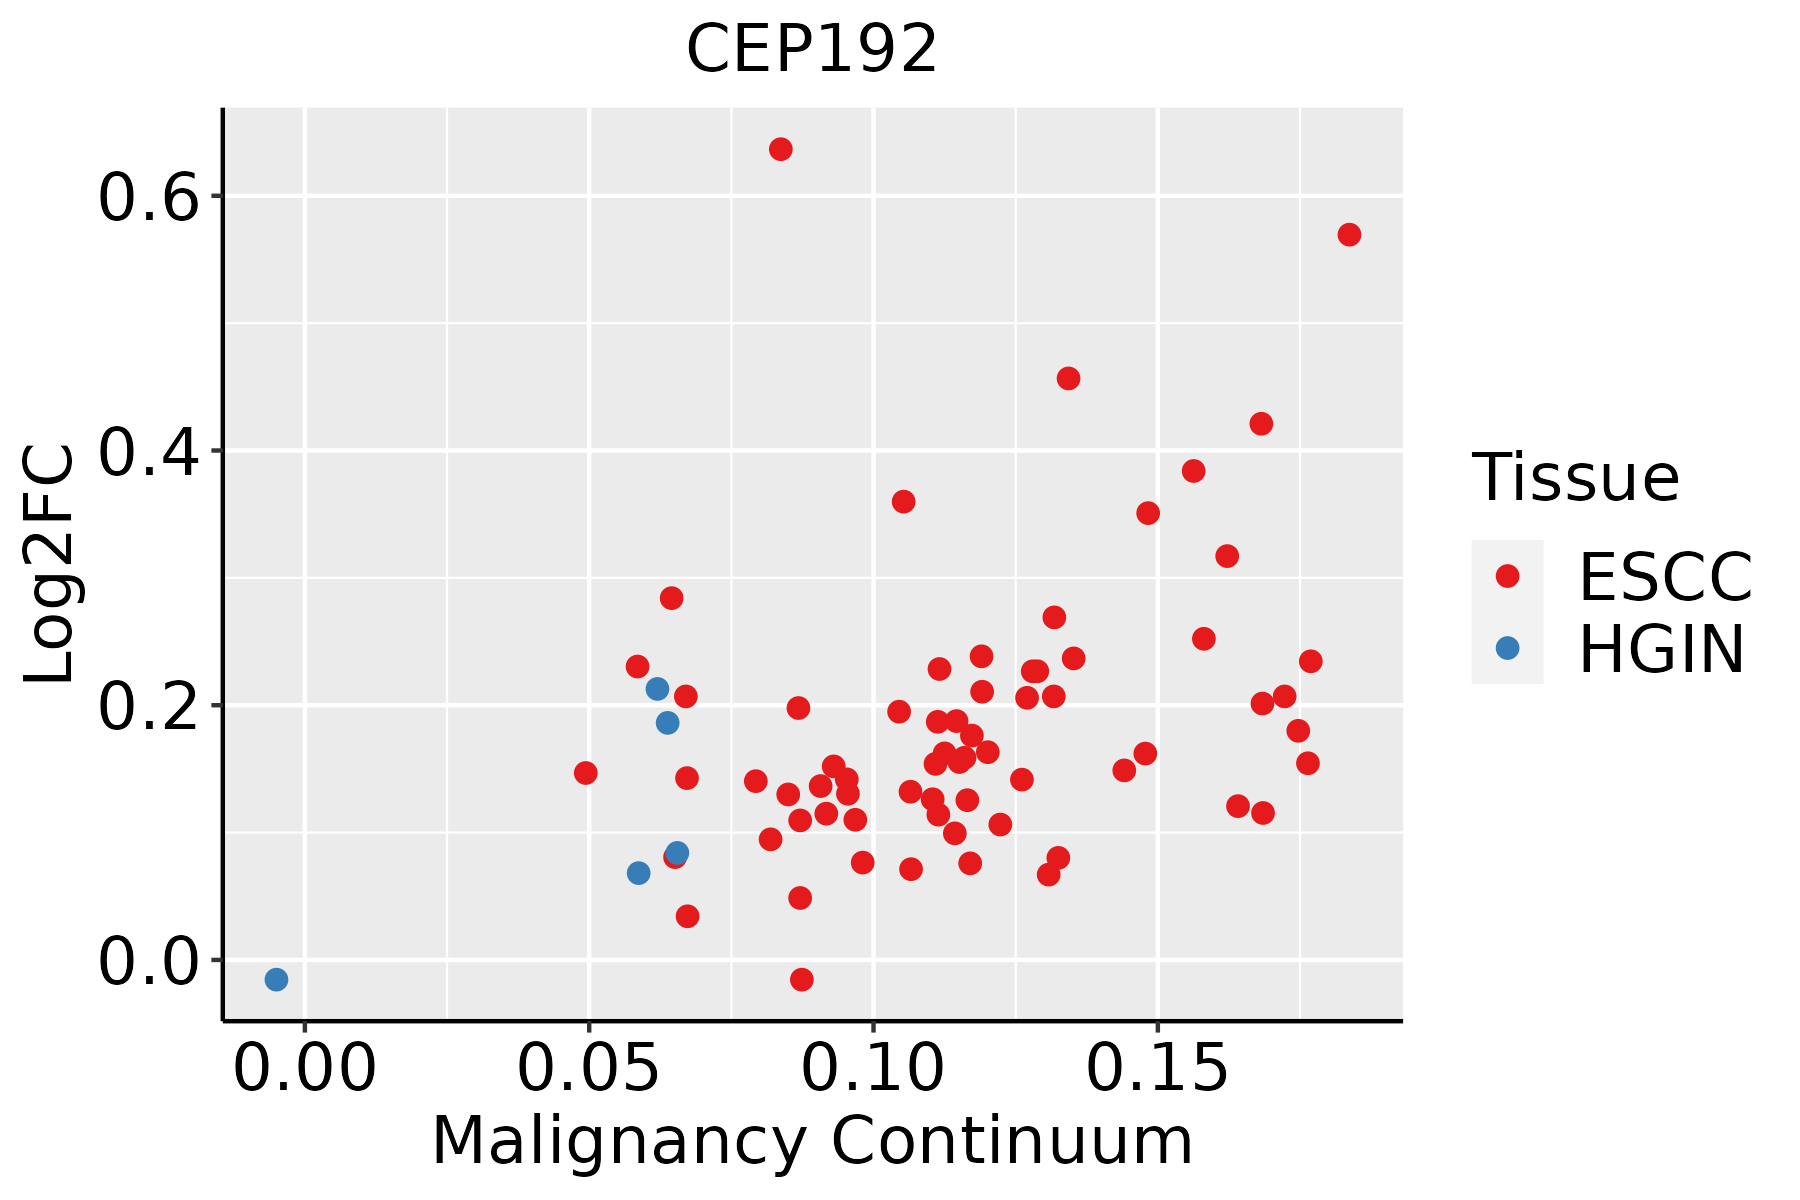 | ESCC: Esophageal squamous cell carcinoma |
| HGIN: High-grade intraepithelial neoplasias | ||
| LGIN: Low-grade intraepithelial neoplasias | ||
| Liver | 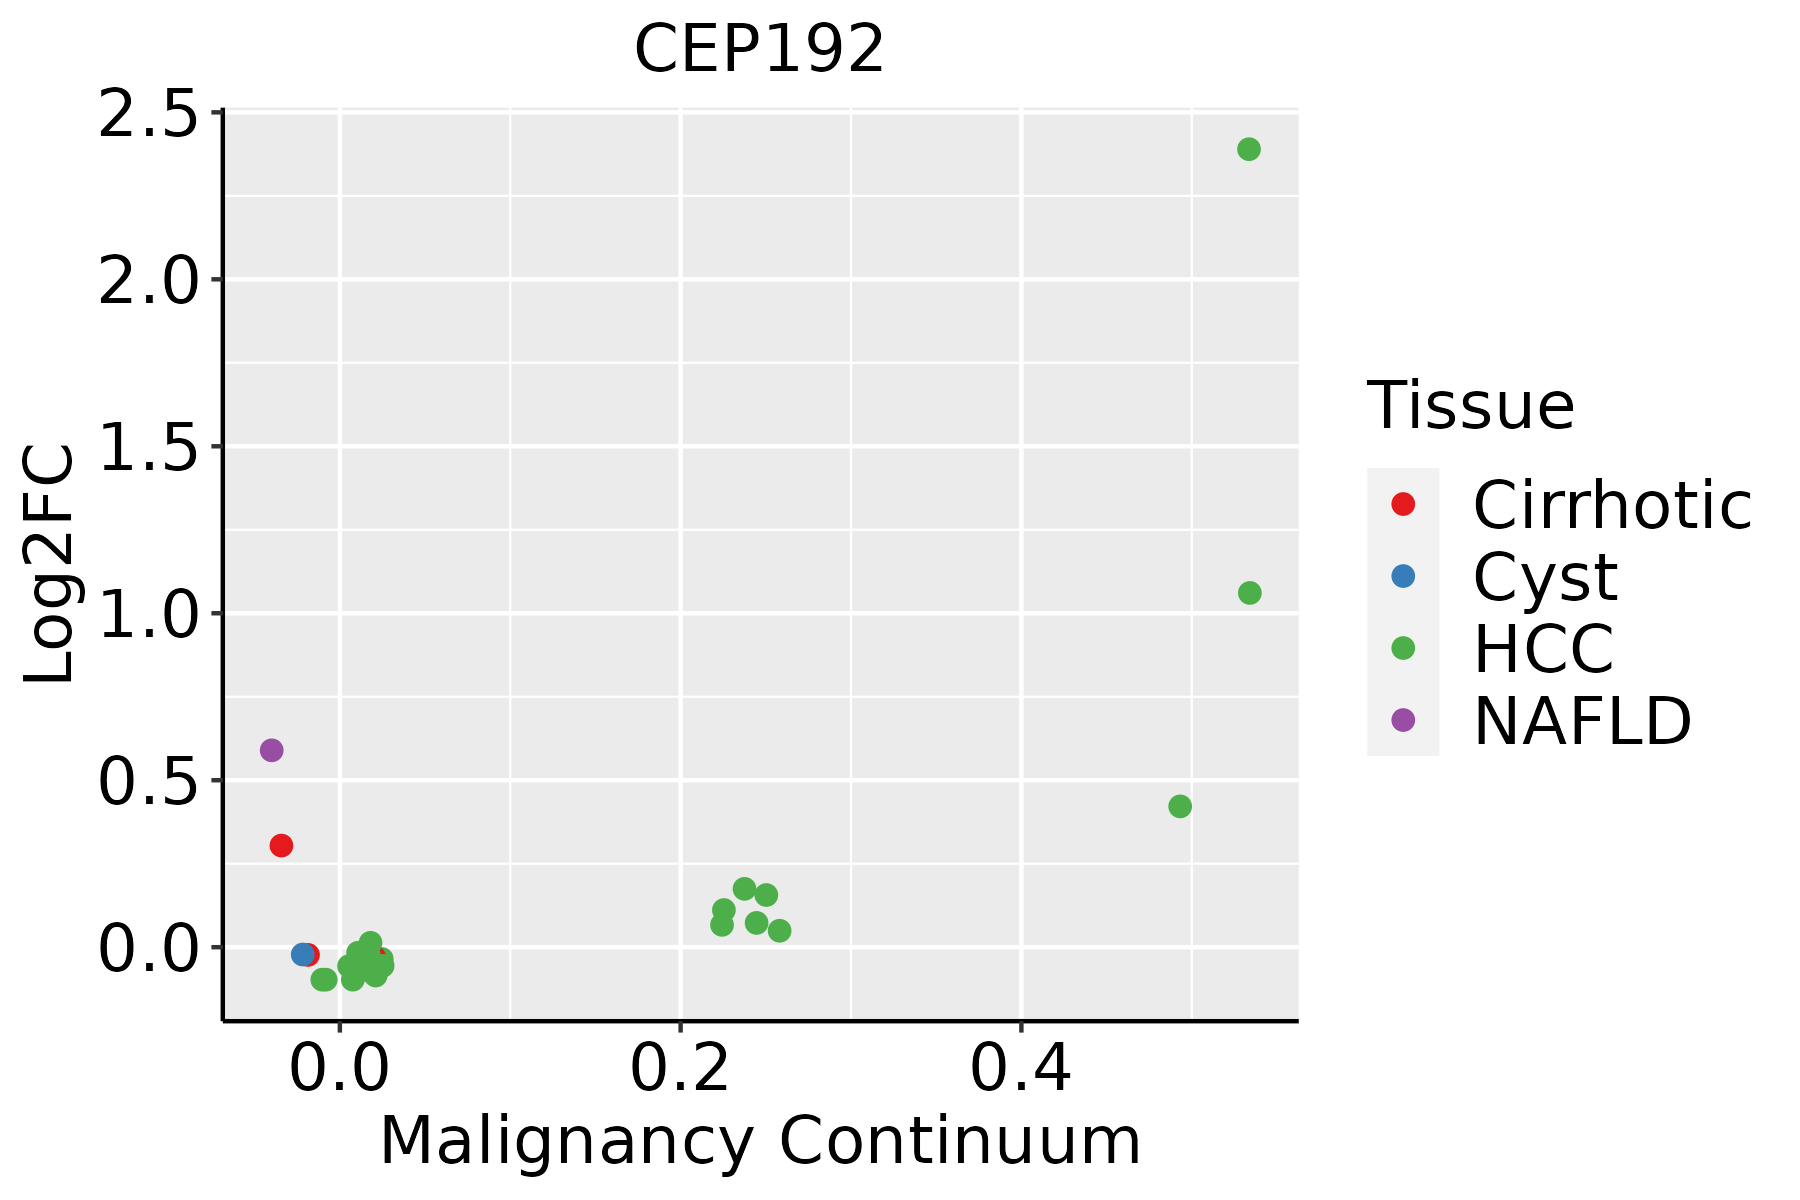 | HCC: Hepatocellular carcinoma |
| NAFLD: Non-alcoholic fatty liver disease | ||
| Thyroid | 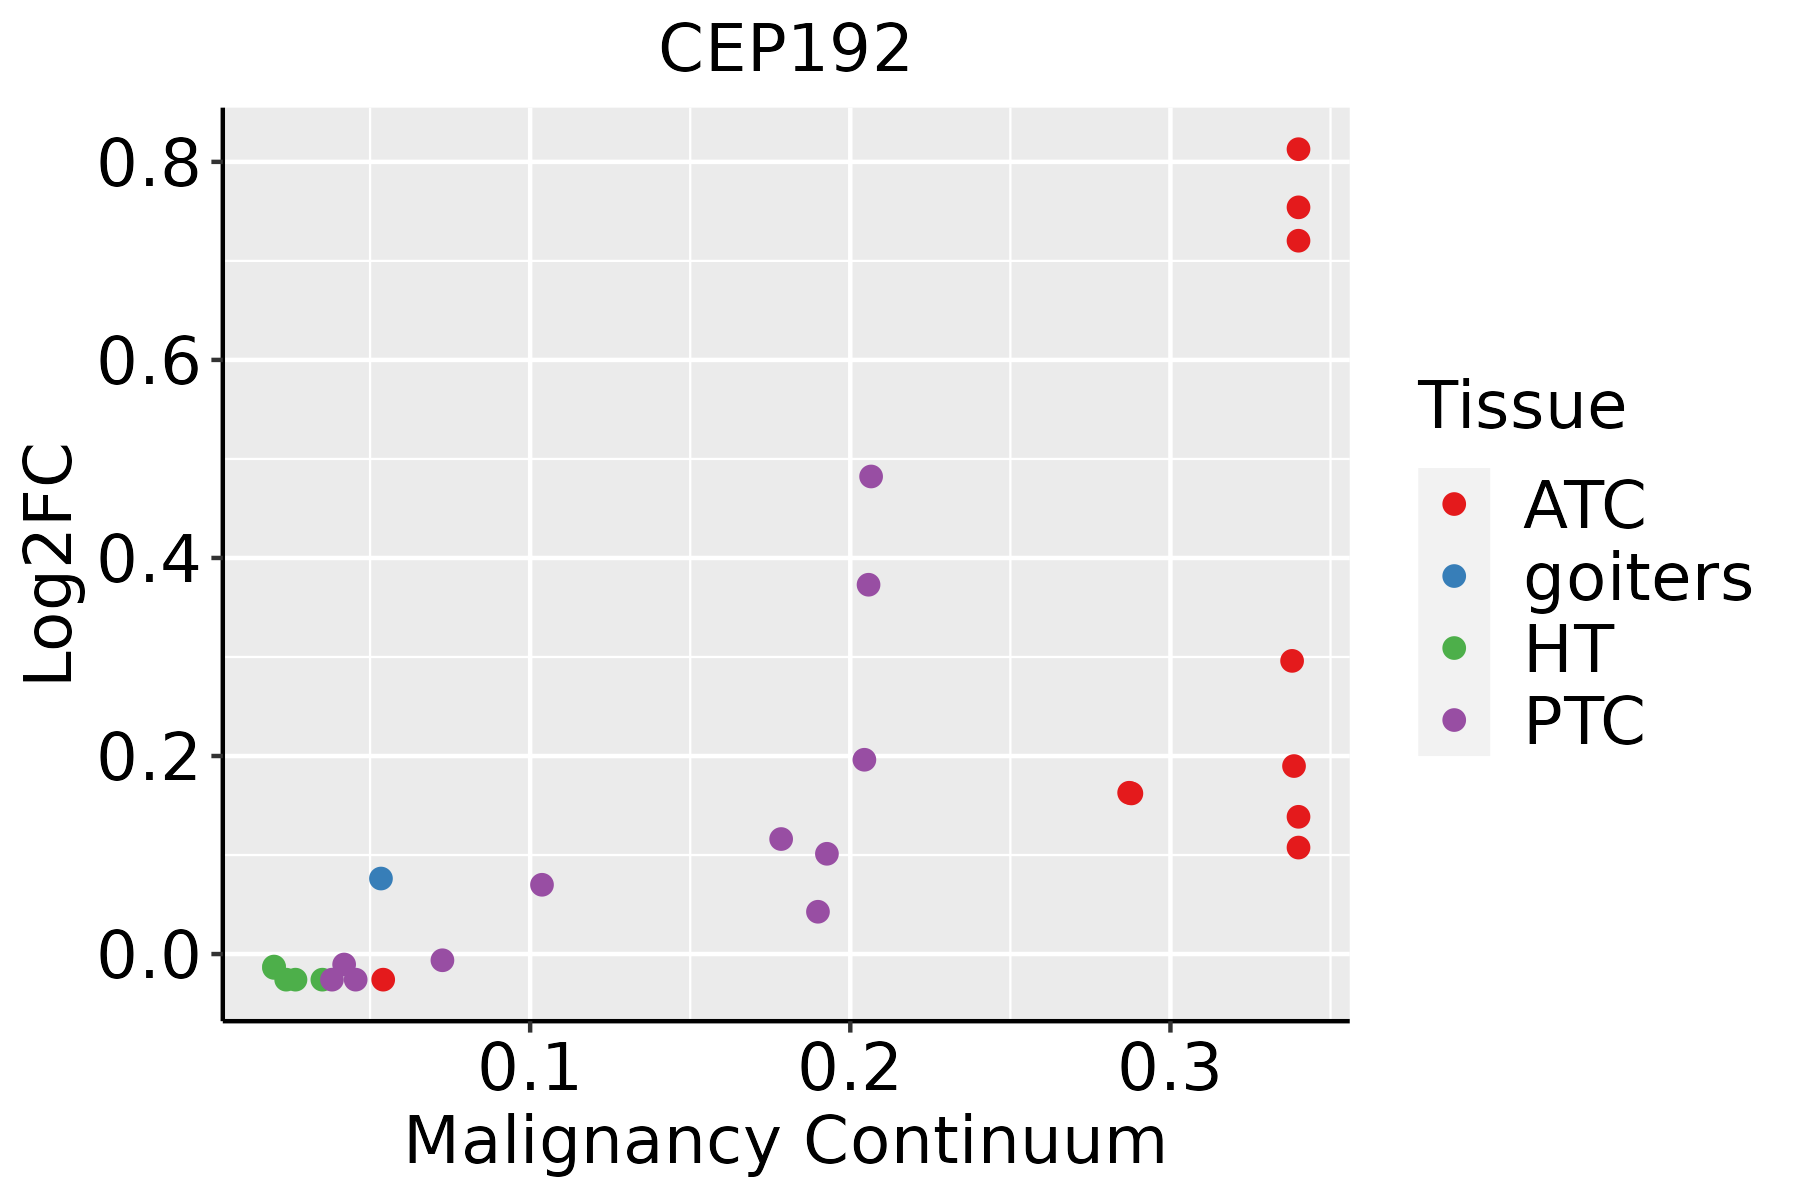 | ATC: Anaplastic thyroid cancer |
| HT: Hashimoto's thyroiditis | ||
| PTC: Papillary thyroid cancer |
| ∗log2FC in expression of this searched gene in stem-like cells from each diseased tissue sample relative to stem-like cells in normal samples in each tissue plotted against the malignancy continuum. Samples are colored based on if they are from different disease stage. |
Top |
Malignant transformation related pathway analysis |
| Find out the enriched GO biological processes and KEGG pathways involved in transition from healthy to precancer to cancer |
| Tissue | Disease Stage | Enriched GO biological Processes |
| Colorectum | AD |  |
| Colorectum | SER |  |
| Colorectum | MSS |  |
| Colorectum | MSI-H |  |
| Colorectum | FAP |  |
| ∗Top 15 enriched GO BP terms are showed in the bar plot of each disease state in each tissue. Each row represents a significant GO biological process which is colored according to the -log10(p.adjust). |
| Page: 1 2 3 4 5 6 7 8 9 |
| GO ID | Tissue | Disease Stage | Description | Gene Ratio | Bg Ratio | pvalue | p.adjust | Count |
| GO:005125810 | Cervix | CC | protein polymerization | 70/2311 | 297/18723 | 5.20e-08 | 3.11e-06 | 70 |
| GO:00467853 | Cervix | CC | microtubule polymerization | 19/2311 | 83/18723 | 5.25e-03 | 3.08e-02 | 19 |
| GO:01400143 | Cervix | CC | mitotic nuclear division | 50/2311 | 287/18723 | 7.27e-03 | 3.91e-02 | 50 |
| GO:00482851 | Cervix | CC | organelle fission | 78/2311 | 488/18723 | 9.70e-03 | 4.79e-02 | 78 |
| GO:0051258 | Colorectum | AD | protein polymerization | 112/3918 | 297/18723 | 1.85e-11 | 2.27e-09 | 112 |
| GO:0071539 | Colorectum | AD | protein localization to centrosome | 16/3918 | 33/18723 | 3.86e-04 | 4.41e-03 | 16 |
| GO:0007051 | Colorectum | AD | spindle organization | 58/3918 | 184/18723 | 4.71e-04 | 5.20e-03 | 58 |
| GO:1902850 | Colorectum | AD | microtubule cytoskeleton organization involved in mitosis | 48/3918 | 147/18723 | 5.87e-04 | 6.21e-03 | 48 |
| GO:1905508 | Colorectum | AD | protein localization to microtubule organizing center | 16/3918 | 35/18723 | 8.76e-04 | 8.51e-03 | 16 |
| GO:0090307 | Colorectum | AD | mitotic spindle assembly | 25/3918 | 65/18723 | 9.12e-04 | 8.71e-03 | 25 |
| GO:0007052 | Colorectum | AD | mitotic spindle organization | 40/3918 | 120/18723 | 1.03e-03 | 9.61e-03 | 40 |
| GO:0051225 | Colorectum | AD | spindle assembly | 37/3918 | 117/18723 | 4.32e-03 | 2.96e-02 | 37 |
| GO:0140014 | Colorectum | AD | mitotic nuclear division | 78/3918 | 287/18723 | 6.48e-03 | 4.05e-02 | 78 |
| GO:00512582 | Colorectum | MSS | protein polymerization | 97/3467 | 297/18723 | 2.98e-09 | 2.07e-07 | 97 |
| GO:00715391 | Colorectum | MSS | protein localization to centrosome | 16/3467 | 33/18723 | 8.66e-05 | 1.40e-03 | 16 |
| GO:19055081 | Colorectum | MSS | protein localization to microtubule organizing center | 16/3467 | 35/18723 | 2.07e-04 | 2.89e-03 | 16 |
| GO:00070511 | Colorectum | MSS | spindle organization | 53/3467 | 184/18723 | 4.23e-04 | 5.19e-03 | 53 |
| GO:19028501 | Colorectum | MSS | microtubule cytoskeleton organization involved in mitosis | 44/3467 | 147/18723 | 5.17e-04 | 5.98e-03 | 44 |
| GO:00070521 | Colorectum | MSS | mitotic spindle organization | 36/3467 | 120/18723 | 1.52e-03 | 1.39e-02 | 36 |
| GO:00903071 | Colorectum | MSS | mitotic spindle assembly | 22/3467 | 65/18723 | 2.33e-03 | 1.90e-02 | 22 |
| Page: 1 2 3 4 5 6 |
| Pathway ID | Tissue | Disease Stage | Description | Gene Ratio | Bg Ratio | pvalue | p.adjust | qvalue | Count |
| Page: 1 |
Top |
Cell-cell communication analysis |
| Identification of potential cell-cell interactions between two cell types and their ligand-receptor pairs for different disease states |
| Ligand | Receptor | LRpair | Pathway | Tissue | Disease Stage |
| Page: 1 |
Top |
Single-cell gene regulatory network inference analysis |
| Find out the significant the regulons (TFs) and the target genes of each regulon across cell types for different disease states |
| TF | Cell Type | Tissue | Disease Stage | Target Gene | RSS | Regulon Activity |
| ∗The dot plots of a searched regulon are shown for all cell subpopulations in each disease state of each tissue based on the regulon specific score inferred using pySCENIC and by calculating the average expression. |
| Page: 1 |
Top |
Somatic mutation of malignant transformation related genes |
| Annotation of somatic variants for genes involved in malignant transformation |
| Hugo Symbol | Variant Class | Variant Classification | dbSNP RS | HGVSc | HGVSp | HGVSp Short | SWISSPROT | BIOTYPE | SIFT | PolyPhen | Tumor Sample Barcode | Tissue | Histology | Sex | Age | Stage | Therapy Types | Drugs | Outcome |
| CEP192 | SNV | Missense_Mutation | rs773584017 | c.3906N>T | p.Glu1302Asp | p.E1302D | Q8TEP8 | protein_coding | tolerated(0.43) | benign(0.034) | TCGA-A7-A3IZ-01 | Breast | breast invasive carcinoma | Female | <65 | I/II | Chemotherapy | cytoxan | SD |
| CEP192 | SNV | Missense_Mutation | c.7438N>A | p.Glu2480Lys | p.E2480K | Q8TEP8 | protein_coding | deleterious(0) | probably_damaging(0.921) | TCGA-A8-A06X-01 | Breast | breast invasive carcinoma | Female | >=65 | I/II | Unknown | Unknown | SD | |
| CEP192 | SNV | Missense_Mutation | c.2802G>T | p.Gln934His | p.Q934H | Q8TEP8 | protein_coding | tolerated(0.08) | benign(0.015) | TCGA-A8-A079-01 | Breast | breast invasive carcinoma | Female | >=65 | III/IV | Chemotherapy | 5-fluorouracil | SD | |
| CEP192 | SNV | Missense_Mutation | c.2803A>T | p.Arg935Trp | p.R935W | Q8TEP8 | protein_coding | deleterious(0.01) | probably_damaging(0.928) | TCGA-A8-A079-01 | Breast | breast invasive carcinoma | Female | >=65 | III/IV | Chemotherapy | 5-fluorouracil | SD | |
| CEP192 | SNV | Missense_Mutation | novel | c.1934N>T | p.Ser645Leu | p.S645L | Q8TEP8 | protein_coding | deleterious(0.01) | possibly_damaging(0.675) | TCGA-AC-A6IW-01 | Breast | breast invasive carcinoma | Female | >=65 | I/II | Unknown | Unknown | SD |
| CEP192 | SNV | Missense_Mutation | novel | c.5659N>C | p.Glu1887Gln | p.E1887Q | Q8TEP8 | protein_coding | deleterious(0.02) | probably_damaging(0.982) | TCGA-AC-A6IW-01 | Breast | breast invasive carcinoma | Female | >=65 | I/II | Unknown | Unknown | SD |
| CEP192 | SNV | Missense_Mutation | novel | c.5233N>A | p.Glu1745Lys | p.E1745K | Q8TEP8 | protein_coding | deleterious(0) | probably_damaging(0.981) | TCGA-AN-A046-01 | Breast | breast invasive carcinoma | Female | >=65 | I/II | Unknown | Unknown | SD |
| CEP192 | SNV | Missense_Mutation | c.7400N>A | p.Ser2467Tyr | p.S2467Y | Q8TEP8 | protein_coding | deleterious(0) | probably_damaging(0.991) | TCGA-AN-A046-01 | Breast | breast invasive carcinoma | Female | >=65 | I/II | Unknown | Unknown | SD | |
| CEP192 | SNV | Missense_Mutation | novel | c.5384N>A | p.Ser1795Tyr | p.S1795Y | Q8TEP8 | protein_coding | deleterious(0) | possibly_damaging(0.885) | TCGA-AN-A0AK-01 | Breast | breast invasive carcinoma | Female | >=65 | I/II | Unknown | Unknown | SD |
| CEP192 | SNV | Missense_Mutation | c.3840N>G | p.Cys1280Trp | p.C1280W | Q8TEP8 | protein_coding | tolerated(0.06) | probably_damaging(0.947) | TCGA-AR-A255-01 | Breast | breast invasive carcinoma | Female | <65 | I/II | Targeted Molecular therapy | trastuzumab | SD |
| Page: 1 2 3 4 5 6 7 8 9 10 11 12 13 14 15 16 17 18 19 20 21 22 23 24 25 26 |
Top |
Related drugs of malignant transformation related genes |
| Identification of chemicals and drugs interact with genes involved in malignant transfromation |
| (DGIdb 4.0) |
| Entrez ID | Symbol | Category | Interaction Types | Drug Claim Name | Drug Name | PMIDs |
| Page: 1 |

Copyright 2023-Present -The University of Texas Health Science Center at Houston |