
|
|||||
|
 | |
| |
| |
| |
| |
| |
|
Gene: CEP19 |
Gene summary for CEP19 |
| Gene information | Species | Human | Gene symbol | CEP19 | Gene ID | 84984 |
| Gene name | centrosomal protein 19 | |
| Gene Alias | C3orf34 | |
| Cytomap | 3q29 | |
| Gene Type | protein-coding | GO ID | GO:0000226 | UniProtAcc | Q96LK0 |
Top |
Malignant transformation analysis |
| Identification of the aberrant gene expression in precancerous and cancerous lesions by comparing the gene expression of stem-like cells in diseased tissues with normal stem cells |
| Entrez ID | Symbol | Replicates | Species | Organ | Tissue | Adj P-value | Log2FC | Malignancy |
| 84984 | CEP19 | LZE4T | Human | Esophagus | ESCC | 3.78e-08 | 2.57e-01 | 0.0811 |
| 84984 | CEP19 | LZE7T | Human | Esophagus | ESCC | 3.90e-02 | 1.73e-01 | 0.0667 |
| 84984 | CEP19 | LZE8T | Human | Esophagus | ESCC | 1.10e-02 | 1.29e-01 | 0.067 |
| 84984 | CEP19 | LZE21D1 | Human | Esophagus | HGIN | 2.75e-06 | 5.10e-01 | 0.0632 |
| 84984 | CEP19 | P1T-E | Human | Esophagus | ESCC | 1.64e-05 | 3.78e-01 | 0.0875 |
| 84984 | CEP19 | P2T-E | Human | Esophagus | ESCC | 9.74e-22 | 4.12e-01 | 0.1177 |
| 84984 | CEP19 | P4T-E | Human | Esophagus | ESCC | 1.17e-15 | 3.65e-01 | 0.1323 |
| 84984 | CEP19 | P5T-E | Human | Esophagus | ESCC | 1.96e-05 | 1.96e-01 | 0.1327 |
| 84984 | CEP19 | P9T-E | Human | Esophagus | ESCC | 6.89e-11 | 3.04e-01 | 0.1131 |
| 84984 | CEP19 | P10T-E | Human | Esophagus | ESCC | 9.56e-08 | 1.76e-01 | 0.116 |
| 84984 | CEP19 | P12T-E | Human | Esophagus | ESCC | 7.90e-03 | 1.39e-01 | 0.1122 |
| 84984 | CEP19 | P15T-E | Human | Esophagus | ESCC | 1.32e-06 | 2.15e-01 | 0.1149 |
| 84984 | CEP19 | P16T-E | Human | Esophagus | ESCC | 4.16e-22 | 4.61e-01 | 0.1153 |
| 84984 | CEP19 | P20T-E | Human | Esophagus | ESCC | 4.38e-08 | 1.92e-01 | 0.1124 |
| 84984 | CEP19 | P21T-E | Human | Esophagus | ESCC | 2.03e-09 | 2.08e-01 | 0.1617 |
| 84984 | CEP19 | P22T-E | Human | Esophagus | ESCC | 1.35e-23 | 4.47e-01 | 0.1236 |
| 84984 | CEP19 | P23T-E | Human | Esophagus | ESCC | 7.44e-14 | 4.27e-01 | 0.108 |
| 84984 | CEP19 | P24T-E | Human | Esophagus | ESCC | 1.88e-04 | 1.05e-01 | 0.1287 |
| 84984 | CEP19 | P26T-E | Human | Esophagus | ESCC | 2.39e-24 | 4.50e-01 | 0.1276 |
| 84984 | CEP19 | P27T-E | Human | Esophagus | ESCC | 1.97e-10 | 2.48e-01 | 0.1055 |
| Page: 1 2 3 4 |
| Tissue | Expression Dynamics | Abbreviation |
| Esophagus | 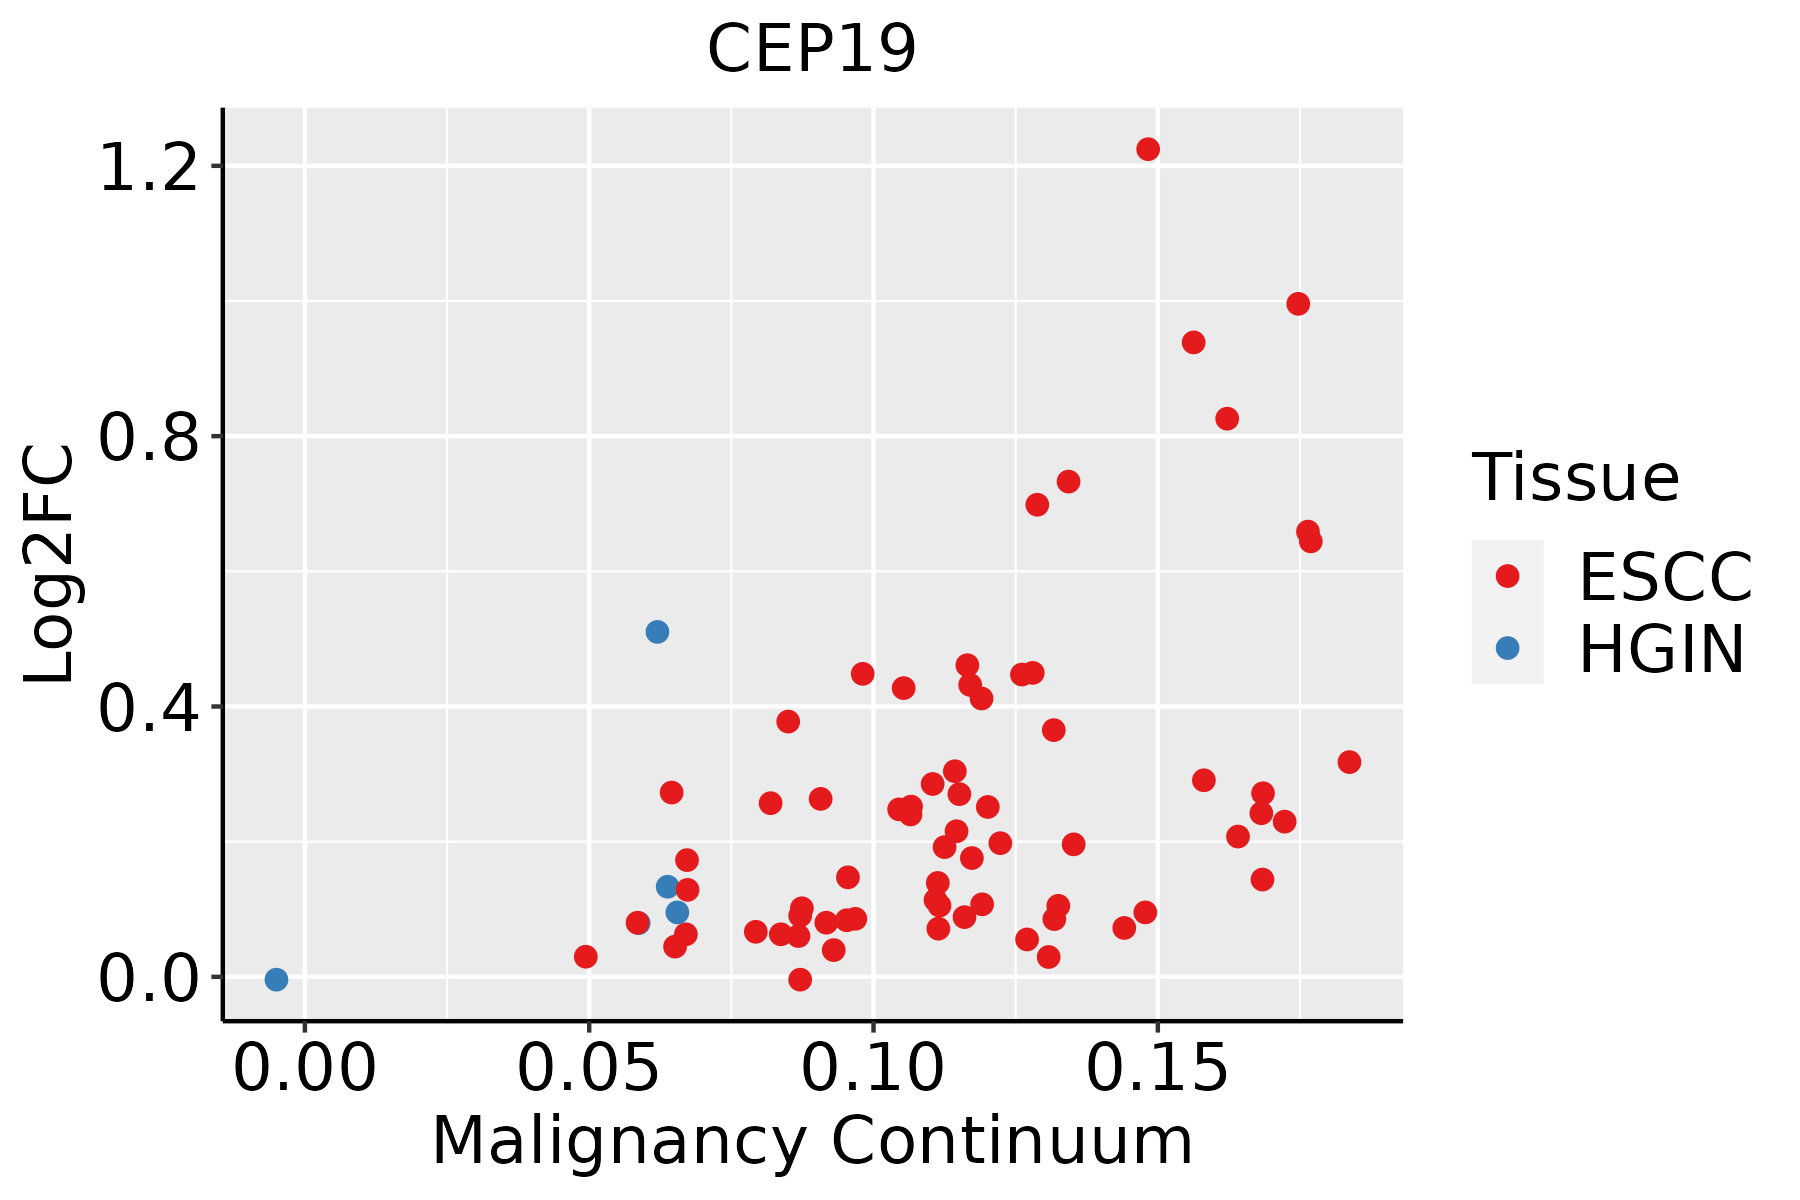 | ESCC: Esophageal squamous cell carcinoma |
| HGIN: High-grade intraepithelial neoplasias | ||
| LGIN: Low-grade intraepithelial neoplasias | ||
| Liver | 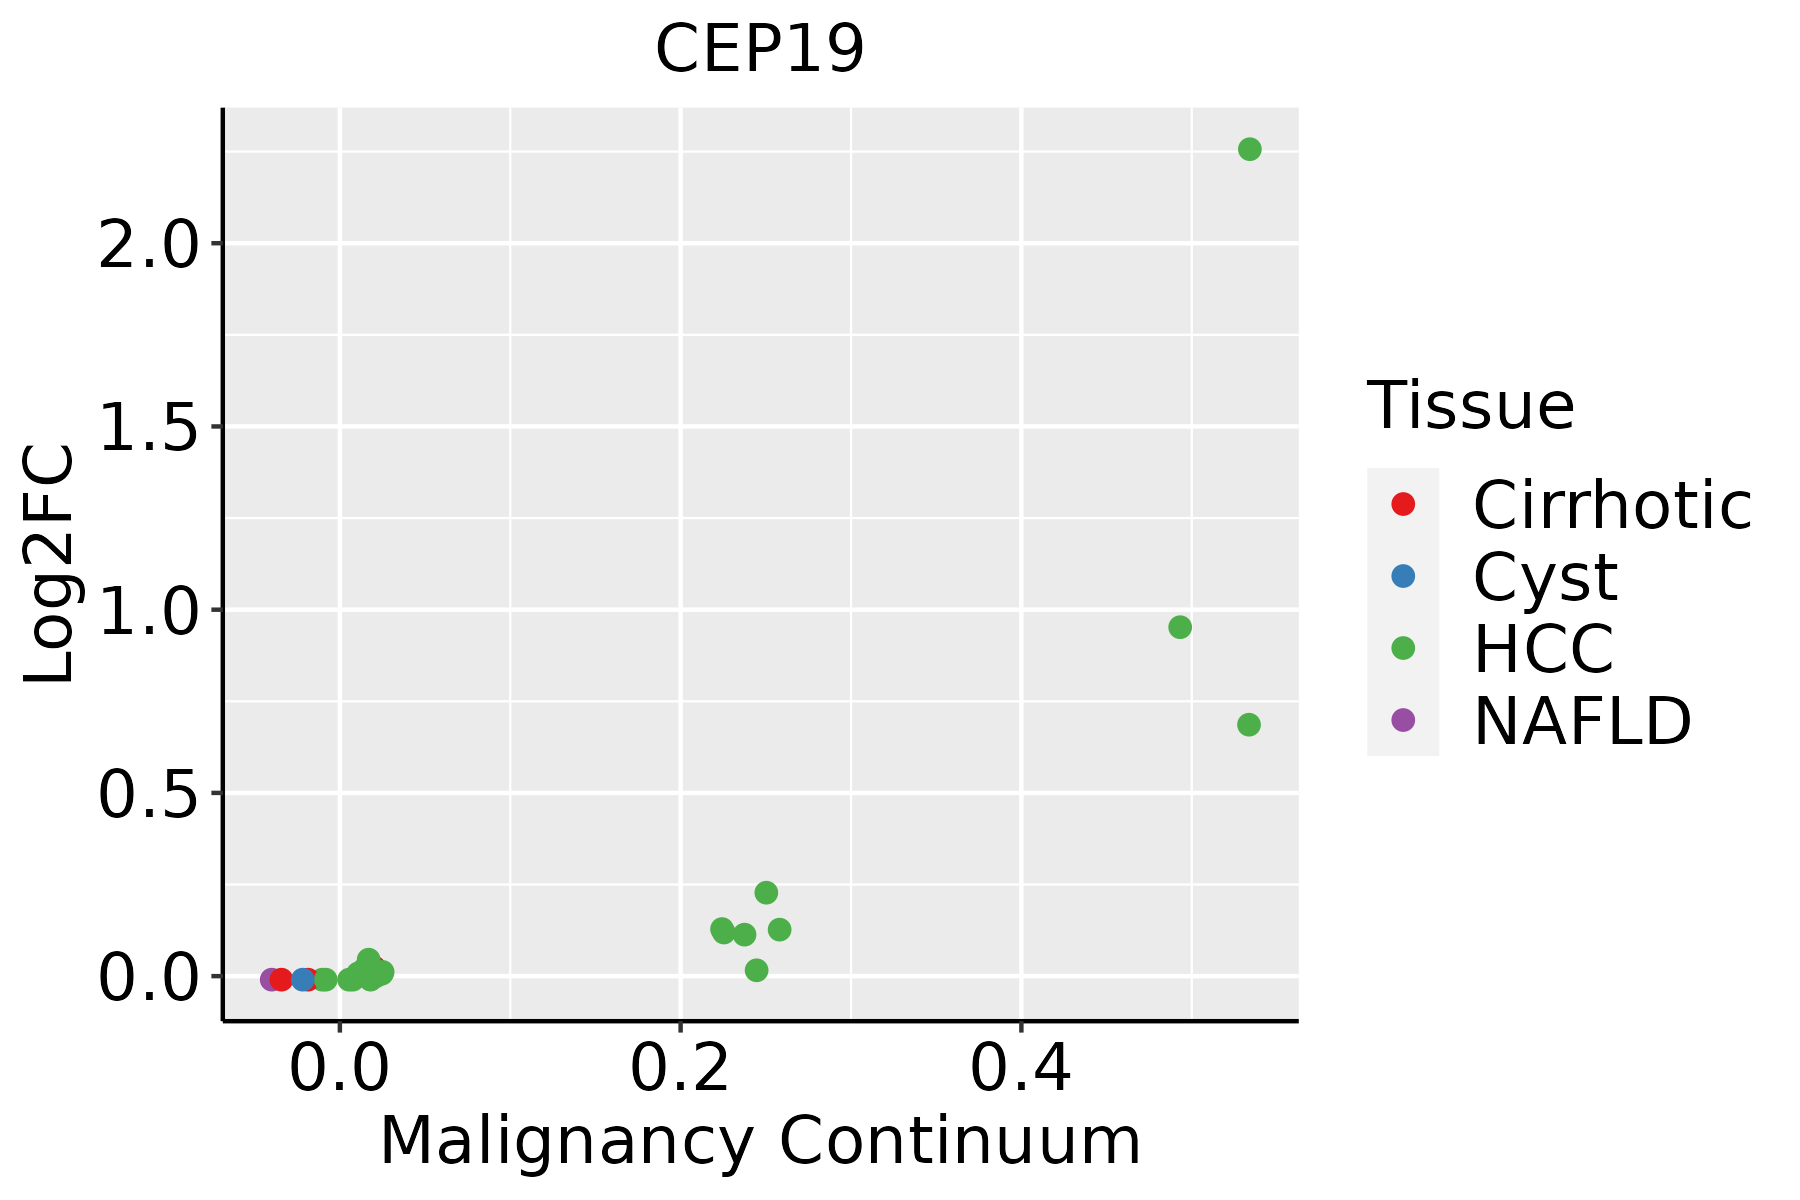 | HCC: Hepatocellular carcinoma |
| NAFLD: Non-alcoholic fatty liver disease | ||
| Oral Cavity | 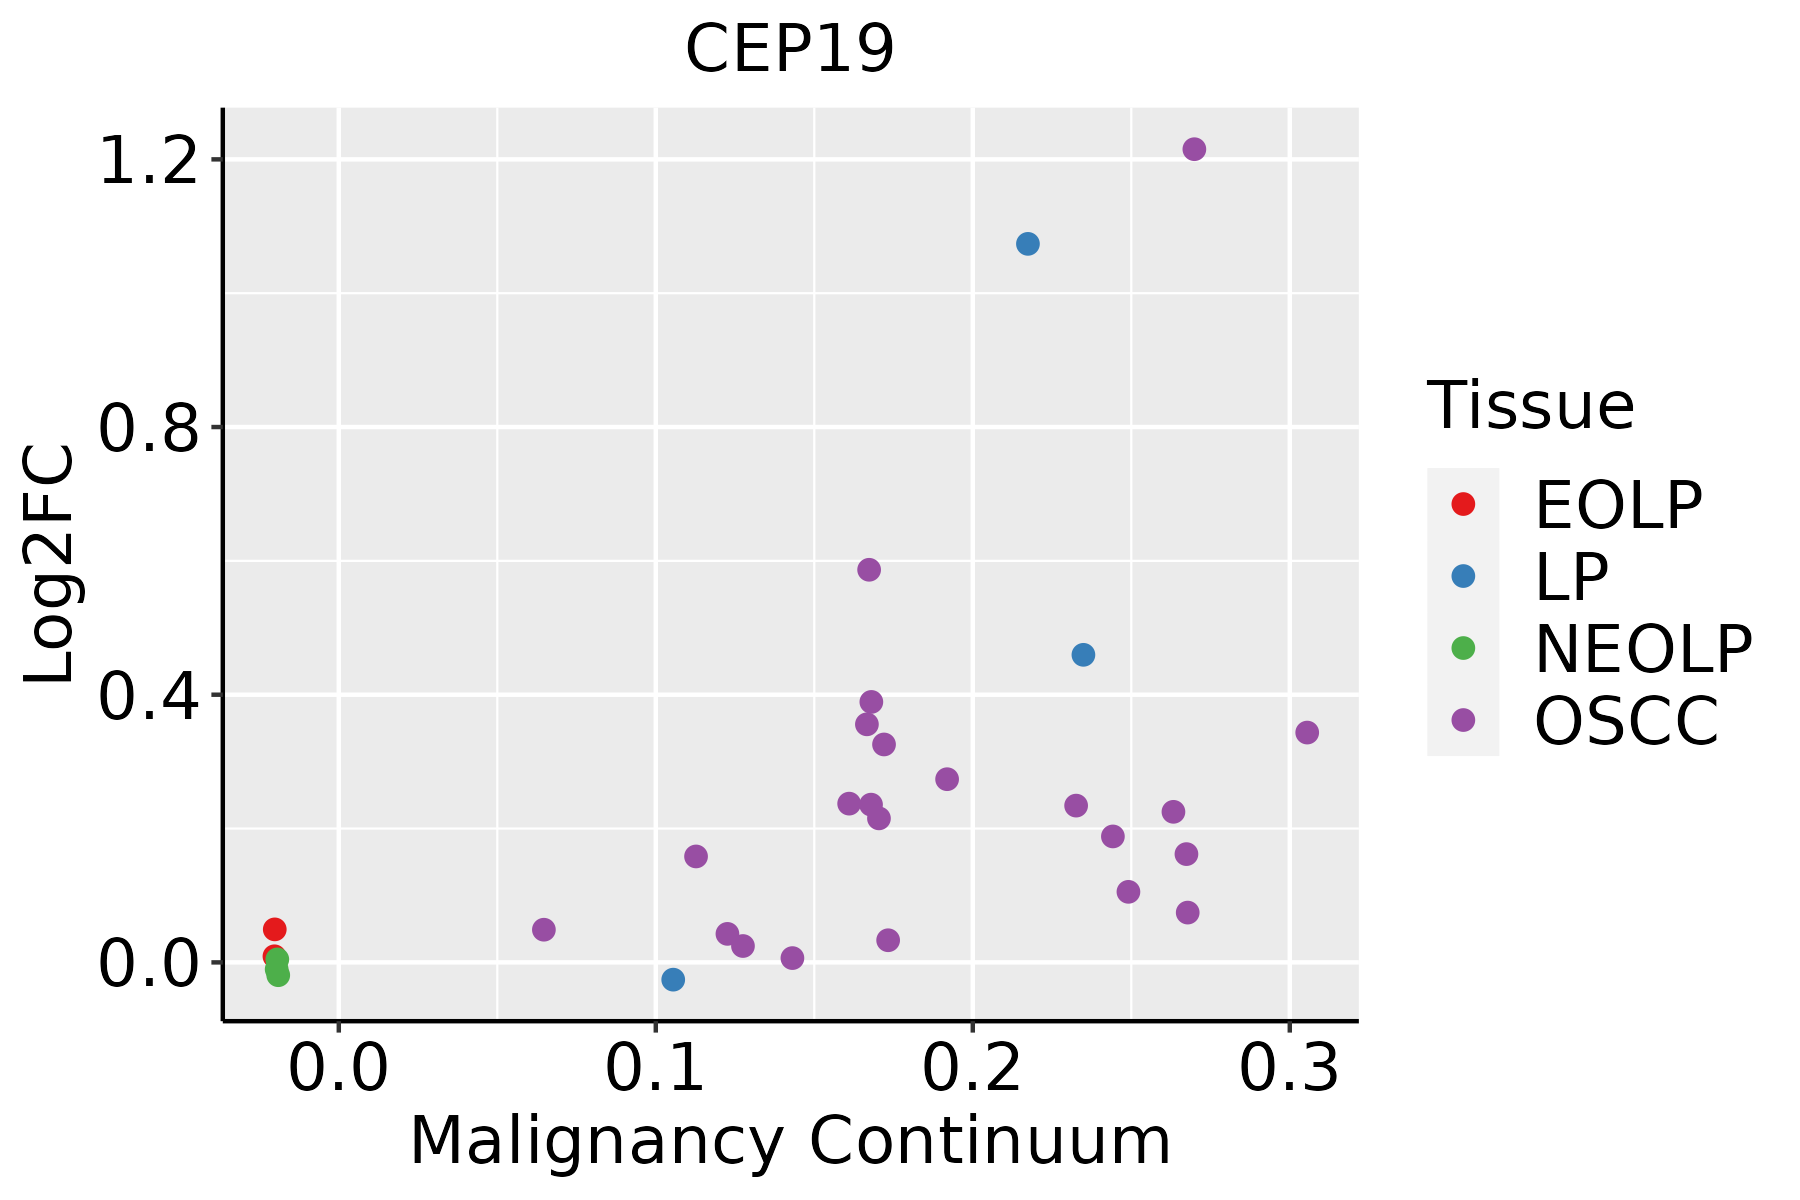 | EOLP: Erosive Oral lichen planus |
| LP: leukoplakia | ||
| NEOLP: Non-erosive oral lichen planus | ||
| OSCC: Oral squamous cell carcinoma |
| ∗log2FC in expression of this searched gene in stem-like cells from each diseased tissue sample relative to stem-like cells in normal samples in each tissue plotted against the malignancy continuum. Samples are colored based on if they are from different disease stage. |
Top |
Malignant transformation related pathway analysis |
| Find out the enriched GO biological processes and KEGG pathways involved in transition from healthy to precancer to cancer |
| Tissue | Disease Stage | Enriched GO biological Processes |
| Colorectum | AD |  |
| Colorectum | SER |  |
| Colorectum | MSS |  |
| Colorectum | MSI-H |  |
| Colorectum | FAP |  |
| ∗Top 15 enriched GO BP terms are showed in the bar plot of each disease state in each tissue. Each row represents a significant GO biological process which is colored according to the -log10(p.adjust). |
| Page: 1 2 3 4 5 6 7 8 9 |
| GO ID | Tissue | Disease Stage | Description | Gene Ratio | Bg Ratio | pvalue | p.adjust | Count |
| GO:005125810 | Cervix | CC | protein polymerization | 70/2311 | 297/18723 | 5.20e-08 | 3.11e-06 | 70 |
| GO:00467853 | Cervix | CC | microtubule polymerization | 19/2311 | 83/18723 | 5.25e-03 | 3.08e-02 | 19 |
| GO:01400143 | Cervix | CC | mitotic nuclear division | 50/2311 | 287/18723 | 7.27e-03 | 3.91e-02 | 50 |
| GO:00482851 | Cervix | CC | organelle fission | 78/2311 | 488/18723 | 9.70e-03 | 4.79e-02 | 78 |
| GO:0051258 | Colorectum | AD | protein polymerization | 112/3918 | 297/18723 | 1.85e-11 | 2.27e-09 | 112 |
| GO:0071539 | Colorectum | AD | protein localization to centrosome | 16/3918 | 33/18723 | 3.86e-04 | 4.41e-03 | 16 |
| GO:0007051 | Colorectum | AD | spindle organization | 58/3918 | 184/18723 | 4.71e-04 | 5.20e-03 | 58 |
| GO:1902850 | Colorectum | AD | microtubule cytoskeleton organization involved in mitosis | 48/3918 | 147/18723 | 5.87e-04 | 6.21e-03 | 48 |
| GO:1905508 | Colorectum | AD | protein localization to microtubule organizing center | 16/3918 | 35/18723 | 8.76e-04 | 8.51e-03 | 16 |
| GO:0090307 | Colorectum | AD | mitotic spindle assembly | 25/3918 | 65/18723 | 9.12e-04 | 8.71e-03 | 25 |
| GO:0007052 | Colorectum | AD | mitotic spindle organization | 40/3918 | 120/18723 | 1.03e-03 | 9.61e-03 | 40 |
| GO:0051225 | Colorectum | AD | spindle assembly | 37/3918 | 117/18723 | 4.32e-03 | 2.96e-02 | 37 |
| GO:0140014 | Colorectum | AD | mitotic nuclear division | 78/3918 | 287/18723 | 6.48e-03 | 4.05e-02 | 78 |
| GO:00512582 | Colorectum | MSS | protein polymerization | 97/3467 | 297/18723 | 2.98e-09 | 2.07e-07 | 97 |
| GO:00715391 | Colorectum | MSS | protein localization to centrosome | 16/3467 | 33/18723 | 8.66e-05 | 1.40e-03 | 16 |
| GO:19055081 | Colorectum | MSS | protein localization to microtubule organizing center | 16/3467 | 35/18723 | 2.07e-04 | 2.89e-03 | 16 |
| GO:00070511 | Colorectum | MSS | spindle organization | 53/3467 | 184/18723 | 4.23e-04 | 5.19e-03 | 53 |
| GO:19028501 | Colorectum | MSS | microtubule cytoskeleton organization involved in mitosis | 44/3467 | 147/18723 | 5.17e-04 | 5.98e-03 | 44 |
| GO:00070521 | Colorectum | MSS | mitotic spindle organization | 36/3467 | 120/18723 | 1.52e-03 | 1.39e-02 | 36 |
| GO:00903071 | Colorectum | MSS | mitotic spindle assembly | 22/3467 | 65/18723 | 2.33e-03 | 1.90e-02 | 22 |
| Page: 1 2 3 4 5 6 7 |
| Pathway ID | Tissue | Disease Stage | Description | Gene Ratio | Bg Ratio | pvalue | p.adjust | qvalue | Count |
| Page: 1 |
Top |
Cell-cell communication analysis |
| Identification of potential cell-cell interactions between two cell types and their ligand-receptor pairs for different disease states |
| Ligand | Receptor | LRpair | Pathway | Tissue | Disease Stage |
| Page: 1 |
Top |
Single-cell gene regulatory network inference analysis |
| Find out the significant the regulons (TFs) and the target genes of each regulon across cell types for different disease states |
| TF | Cell Type | Tissue | Disease Stage | Target Gene | RSS | Regulon Activity |
| ∗The dot plots of a searched regulon are shown for all cell subpopulations in each disease state of each tissue based on the regulon specific score inferred using pySCENIC and by calculating the average expression. |
| Page: 1 |
Top |
Somatic mutation of malignant transformation related genes |
| Annotation of somatic variants for genes involved in malignant transformation |
| Hugo Symbol | Variant Class | Variant Classification | dbSNP RS | HGVSc | HGVSp | HGVSp Short | SWISSPROT | BIOTYPE | SIFT | PolyPhen | Tumor Sample Barcode | Tissue | Histology | Sex | Age | Stage | Therapy Types | Drugs | Outcome |
| CEP19 | SNV | Missense_Mutation | c.264N>C | p.Gln88His | p.Q88H | Q96LK0 | protein_coding | tolerated(0.55) | benign(0.055) | TCGA-AC-A23H-01 | Breast | breast invasive carcinoma | Female | >=65 | I/II | Unknown | Unknown | PD | |
| CEP19 | SNV | Missense_Mutation | c.470G>T | p.Cys157Phe | p.C157F | Q96LK0 | protein_coding | deleterious(0) | probably_damaging(0.976) | TCGA-E9-A1NF-01 | Breast | breast invasive carcinoma | Female | <65 | I/II | Chemotherapy | doxorubicin | PD | |
| CEP19 | SNV | Missense_Mutation | rs201883289 | c.245G>C | p.Arg82Pro | p.R82P | Q96LK0 | protein_coding | deleterious(0.01) | possibly_damaging(0.737) | TCGA-IR-A3LB-01 | Cervix | cervical & endocervical cancer | Female | <65 | I/II | Chemotherapy | cisplatin | PD |
| CEP19 | SNV | Missense_Mutation | novel | c.122N>A | p.Arg41Gln | p.R41Q | Q96LK0 | protein_coding | deleterious(0.04) | probably_damaging(0.962) | TCGA-AA-3526-01 | Colorectum | colon adenocarcinoma | Male | <65 | I/II | Unknown | Unknown | SD |
| CEP19 | SNV | Missense_Mutation | c.101G>T | p.Arg34Leu | p.R34L | Q96LK0 | protein_coding | deleterious(0) | possibly_damaging(0.87) | TCGA-D5-6928-01 | Colorectum | colon adenocarcinoma | Male | >=65 | I/II | Unknown | Unknown | SD | |
| CEP19 | SNV | Missense_Mutation | c.418N>A | p.Phe140Ile | p.F140I | Q96LK0 | protein_coding | deleterious(0) | probably_damaging(0.996) | TCGA-AG-A002-01 | Colorectum | rectum adenocarcinoma | Male | <65 | I/II | Unknown | Unknown | SD | |
| CEP19 | SNV | Missense_Mutation | novel | c.44N>T | p.Arg15Met | p.R15M | Q96LK0 | protein_coding | deleterious(0.01) | probably_damaging(0.976) | TCGA-AJ-A5DW-01 | Endometrium | uterine corpus endometrioid carcinoma | Female | <65 | I/II | Unknown | Unknown | SD |
| CEP19 | SNV | Missense_Mutation | novel | c.467C>A | p.Ser156Tyr | p.S156Y | Q96LK0 | protein_coding | deleterious(0) | possibly_damaging(0.873) | TCGA-AX-A2HC-01 | Endometrium | uterine corpus endometrioid carcinoma | Female | <65 | III/IV | Chemotherapy | paclitaxel | PD |
| CEP19 | SNV | Missense_Mutation | novel | c.271G>A | p.Ala91Thr | p.A91T | Q96LK0 | protein_coding | tolerated(0.53) | benign(0.007) | TCGA-AX-A2HC-01 | Endometrium | uterine corpus endometrioid carcinoma | Female | <65 | III/IV | Chemotherapy | paclitaxel | PD |
| CEP19 | SNV | Missense_Mutation | rs374921346 | c.107G>A | p.Arg36His | p.R36H | Q96LK0 | protein_coding | tolerated(0.1) | possibly_damaging(0.574) | TCGA-AX-A2HD-01 | Endometrium | uterine corpus endometrioid carcinoma | Female | >=65 | III/IV | Unknown | Unknown | SD |
| Page: 1 2 3 |
Top |
Related drugs of malignant transformation related genes |
| Identification of chemicals and drugs interact with genes involved in malignant transfromation |
| (DGIdb 4.0) |
| Entrez ID | Symbol | Category | Interaction Types | Drug Claim Name | Drug Name | PMIDs |
| Page: 1 |

Copyright 2023-Present -The University of Texas Health Science Center at Houston |