
|
|||||
|
 | |
| |
| |
| |
| |
| |
|
Gene: CEP170B |
Gene summary for CEP170B |
| Gene information | Species | Human | Gene symbol | CEP170B | Gene ID | 283638 |
| Gene name | centrosomal protein 170B | |
| Gene Alias | CEP170R | |
| Cytomap | 14q32.33 | |
| Gene Type | protein-coding | GO ID | GO:0005575 | UniProtAcc | Q9Y4F5 |
Top |
Malignant transformation analysis |
| Identification of the aberrant gene expression in precancerous and cancerous lesions by comparing the gene expression of stem-like cells in diseased tissues with normal stem cells |
| Entrez ID | Symbol | Replicates | Species | Organ | Tissue | Adj P-value | Log2FC | Malignancy |
| 283638 | CEP170B | HTA11_2487_2000001011 | Human | Colorectum | SER | 1.02e-05 | 4.06e-01 | -0.1808 |
| 283638 | CEP170B | HTA11_1938_2000001011 | Human | Colorectum | AD | 8.52e-06 | 2.83e-01 | -0.0811 |
| 283638 | CEP170B | HTA11_347_2000001011 | Human | Colorectum | AD | 6.63e-06 | 2.43e-01 | -0.1954 |
| 283638 | CEP170B | HTA11_411_2000001011 | Human | Colorectum | SER | 1.35e-07 | 1.03e+00 | -0.2602 |
| 283638 | CEP170B | HTA11_3361_2000001011 | Human | Colorectum | AD | 2.64e-05 | 3.69e-01 | -0.1207 |
| 283638 | CEP170B | HTA11_83_2000001011 | Human | Colorectum | SER | 3.69e-09 | 5.17e-01 | -0.1526 |
| 283638 | CEP170B | HTA11_696_2000001011 | Human | Colorectum | AD | 1.63e-06 | 3.94e-01 | -0.1464 |
| 283638 | CEP170B | HTA11_866_2000001011 | Human | Colorectum | AD | 1.79e-02 | 1.87e-01 | -0.1001 |
| 283638 | CEP170B | HTA11_1391_2000001011 | Human | Colorectum | AD | 8.92e-12 | 4.80e-01 | -0.059 |
| 283638 | CEP170B | HTA11_7862_2000001011 | Human | Colorectum | AD | 4.15e-03 | 2.36e-01 | -0.0179 |
| 283638 | CEP170B | HTA11_866_3004761011 | Human | Colorectum | AD | 1.49e-02 | 2.12e-01 | 0.096 |
| 283638 | CEP170B | HTA11_7663_2000001011 | Human | Colorectum | SER | 1.76e-02 | 3.30e-01 | 0.0131 |
| 283638 | CEP170B | HTA11_7469_2000001011 | Human | Colorectum | AD | 6.30e-03 | 3.99e-01 | -0.0124 |
| 283638 | CEP170B | HTA11_99999974143_84620 | Human | Colorectum | MSS | 1.49e-02 | 1.86e-01 | 0.3005 |
| 283638 | CEP170B | LZE4T | Human | Esophagus | ESCC | 3.42e-02 | 2.61e-02 | 0.0811 |
| 283638 | CEP170B | LZE7T | Human | Esophagus | ESCC | 1.49e-02 | 1.22e-01 | 0.0667 |
| 283638 | CEP170B | LZE8T | Human | Esophagus | ESCC | 3.62e-05 | 8.23e-02 | 0.067 |
| 283638 | CEP170B | LZE20T | Human | Esophagus | ESCC | 6.16e-05 | 1.98e-01 | 0.0662 |
| 283638 | CEP170B | LZE22T | Human | Esophagus | ESCC | 2.85e-07 | 2.62e-01 | 0.068 |
| 283638 | CEP170B | LZE24T | Human | Esophagus | ESCC | 6.06e-05 | 1.46e-01 | 0.0596 |
| Page: 1 2 3 4 5 6 |
| Tissue | Expression Dynamics | Abbreviation |
| Colorectum (GSE201348) | 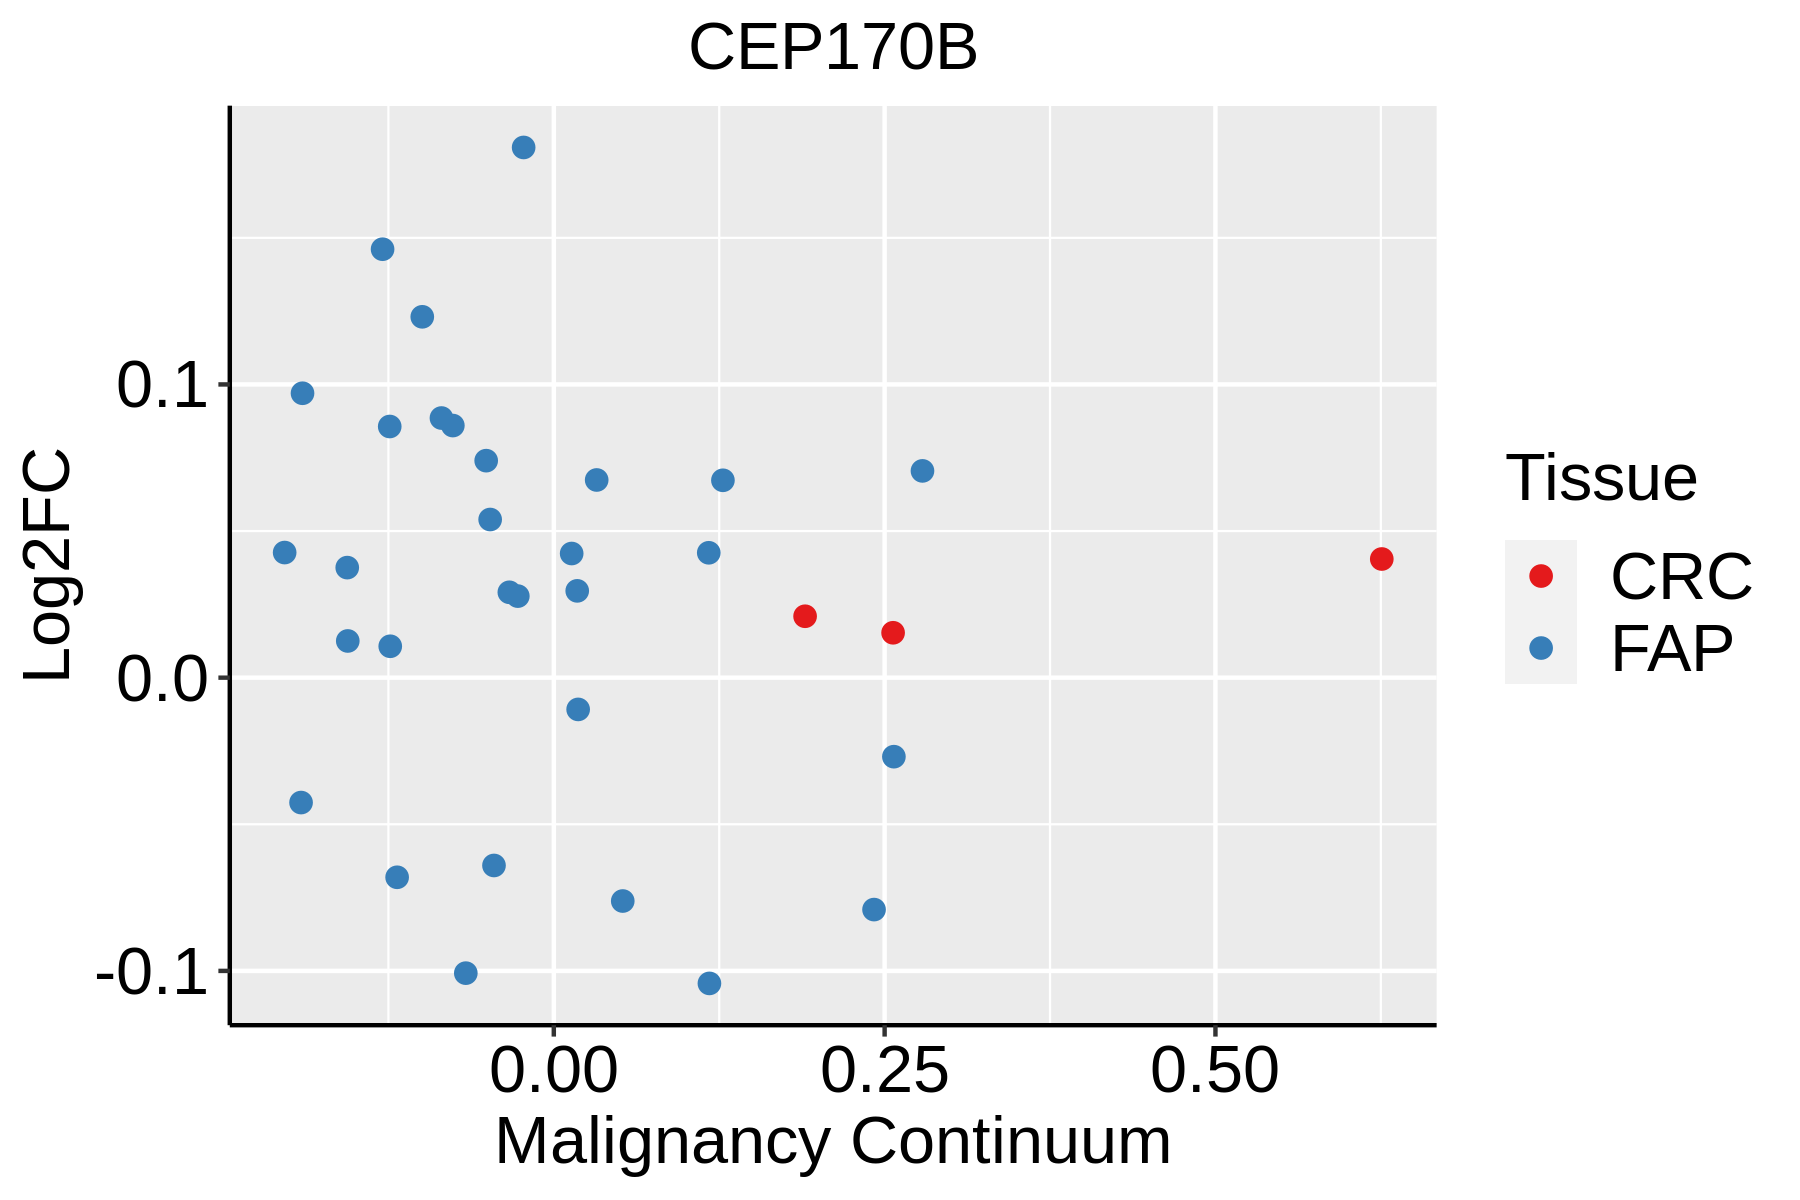 | FAP: Familial adenomatous polyposis |
| CRC: Colorectal cancer | ||
| Colorectum (HTA11) |  | AD: Adenomas |
| SER: Sessile serrated lesions | ||
| MSI-H: Microsatellite-high colorectal cancer | ||
| MSS: Microsatellite stable colorectal cancer | ||
| Esophagus | 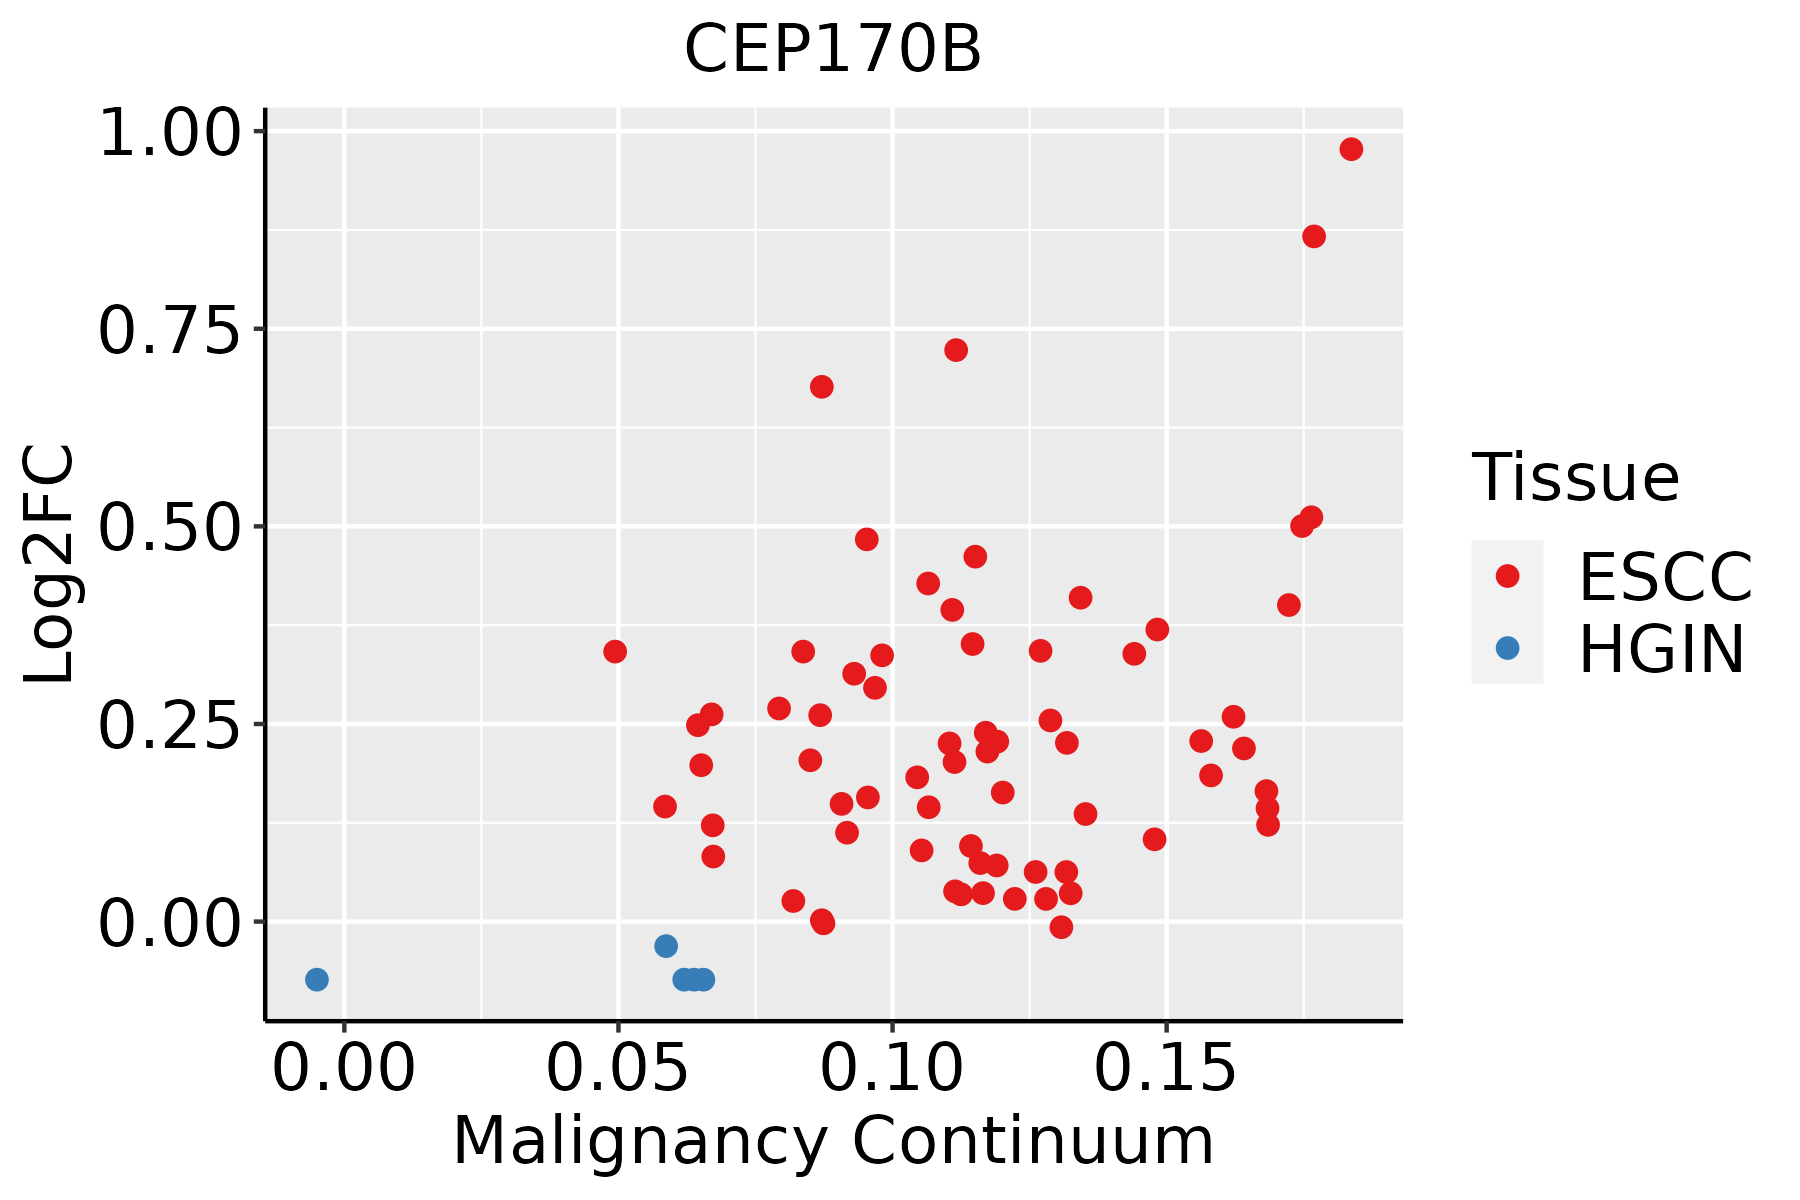 | ESCC: Esophageal squamous cell carcinoma |
| HGIN: High-grade intraepithelial neoplasias | ||
| LGIN: Low-grade intraepithelial neoplasias | ||
| Oral Cavity |  | EOLP: Erosive Oral lichen planus |
| LP: leukoplakia | ||
| NEOLP: Non-erosive oral lichen planus | ||
| OSCC: Oral squamous cell carcinoma | ||
| Thyroid | 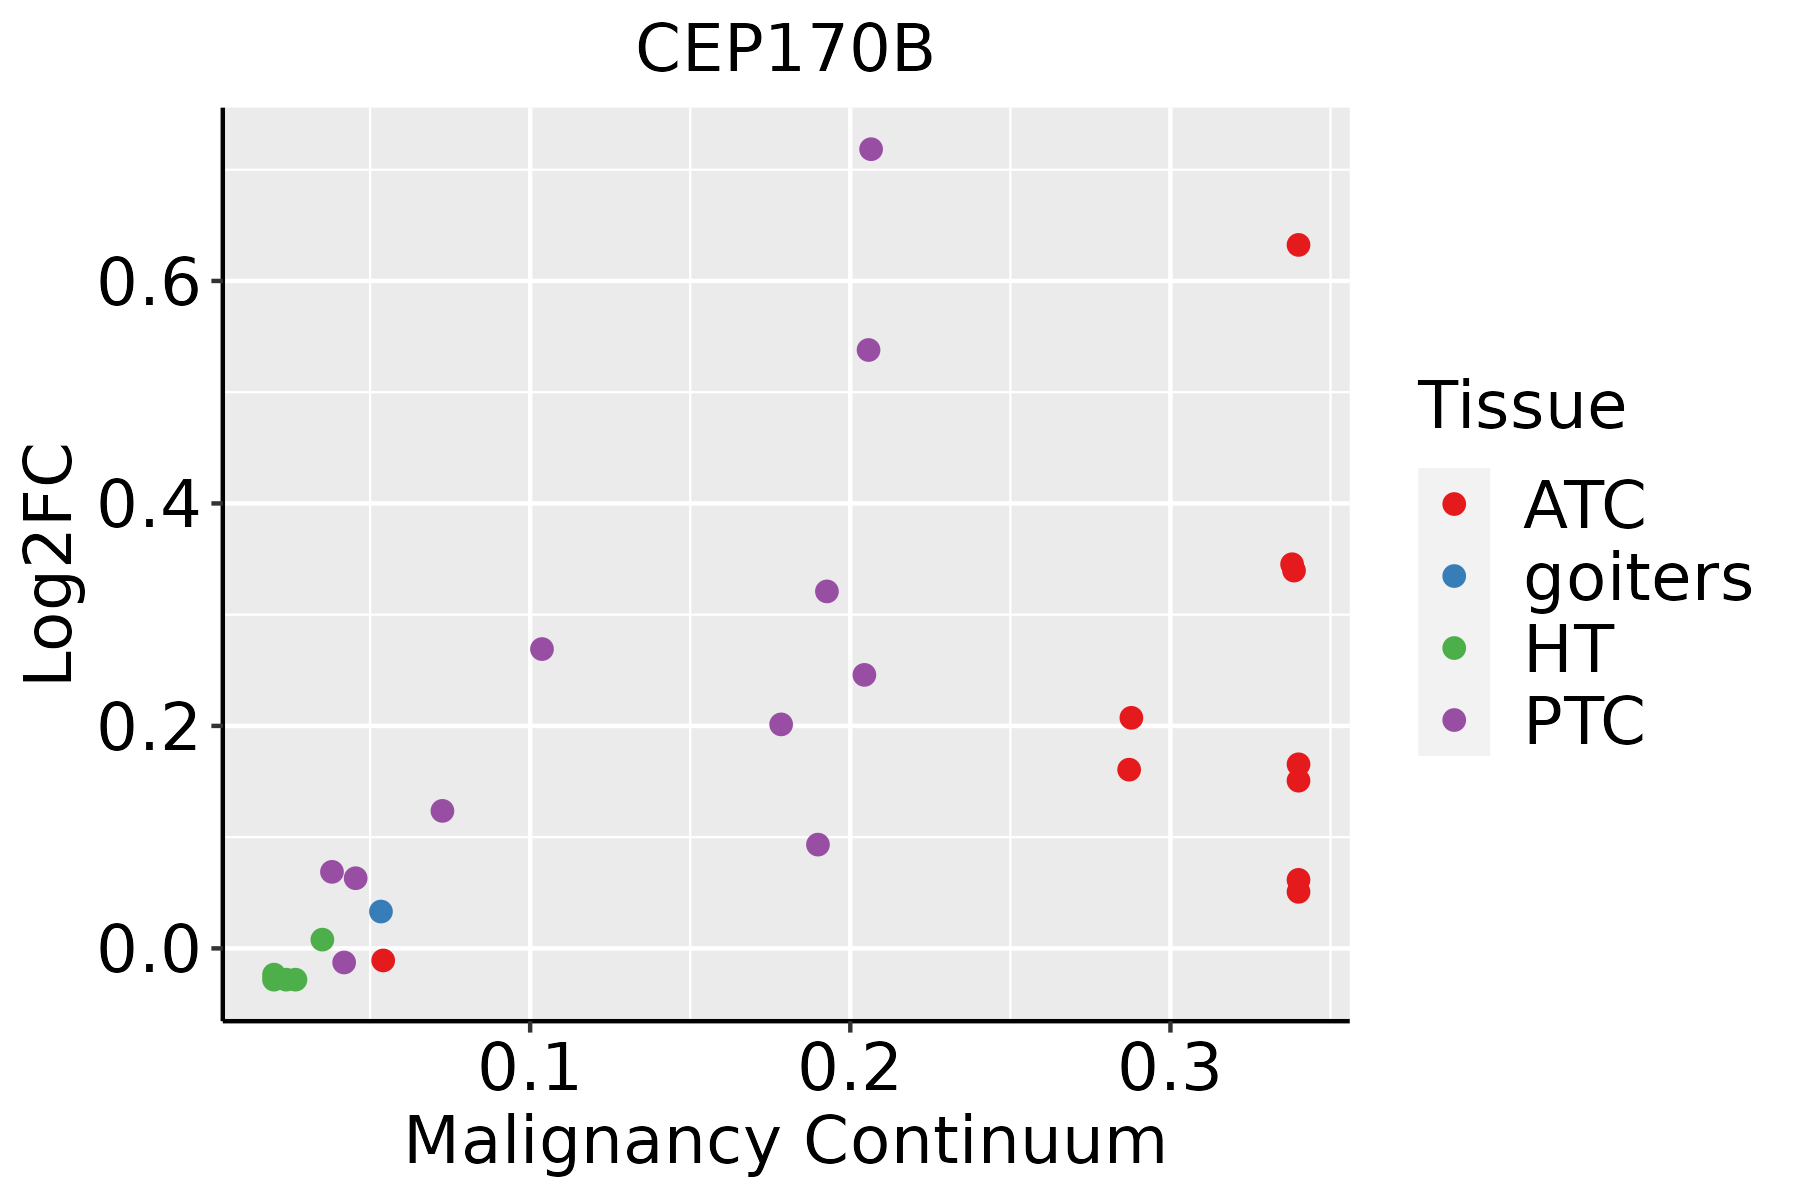 | ATC: Anaplastic thyroid cancer |
| HT: Hashimoto's thyroiditis | ||
| PTC: Papillary thyroid cancer |
| ∗log2FC in expression of this searched gene in stem-like cells from each diseased tissue sample relative to stem-like cells in normal samples in each tissue plotted against the malignancy continuum. Samples are colored based on if they are from different disease stage. |
Top |
Malignant transformation related pathway analysis |
| Find out the enriched GO biological processes and KEGG pathways involved in transition from healthy to precancer to cancer |
| Tissue | Disease Stage | Enriched GO biological Processes |
| Colorectum | AD |  |
| Colorectum | SER |  |
| Colorectum | MSS |  |
| Colorectum | MSI-H |  |
| Colorectum | FAP |  |
| ∗Top 15 enriched GO BP terms are showed in the bar plot of each disease state in each tissue. Each row represents a significant GO biological process which is colored according to the -log10(p.adjust). |
| Page: 1 2 3 4 5 6 7 8 9 |
| GO ID | Tissue | Disease Stage | Description | Gene Ratio | Bg Ratio | pvalue | p.adjust | Count |
| Page: 1 |
| Pathway ID | Tissue | Disease Stage | Description | Gene Ratio | Bg Ratio | pvalue | p.adjust | qvalue | Count |
| Page: 1 |
Top |
Cell-cell communication analysis |
| Identification of potential cell-cell interactions between two cell types and their ligand-receptor pairs for different disease states |
| Ligand | Receptor | LRpair | Pathway | Tissue | Disease Stage |
| Page: 1 |
Top |
Single-cell gene regulatory network inference analysis |
| Find out the significant the regulons (TFs) and the target genes of each regulon across cell types for different disease states |
| TF | Cell Type | Tissue | Disease Stage | Target Gene | RSS | Regulon Activity |
| ∗The dot plots of a searched regulon are shown for all cell subpopulations in each disease state of each tissue based on the regulon specific score inferred using pySCENIC and by calculating the average expression. |
| Page: 1 |
Top |
Somatic mutation of malignant transformation related genes |
| Annotation of somatic variants for genes involved in malignant transformation |
| Hugo Symbol | Variant Class | Variant Classification | dbSNP RS | HGVSc | HGVSp | HGVSp Short | SWISSPROT | BIOTYPE | SIFT | PolyPhen | Tumor Sample Barcode | Tissue | Histology | Sex | Age | Stage | Therapy Types | Drugs | Outcome |
| CEP170B | SNV | Missense_Mutation | c.4001N>T | p.Pro1334Leu | p.P1334L | Q9Y4F5 | protein_coding | deleterious(0) | possibly_damaging(0.522) | TCGA-GM-A2DH-01 | Breast | breast invasive carcinoma | Female | <65 | I/II | Chemotherapy | taxol | CR | |
| CEP170B | SNV | Missense_Mutation | novel | c.1210T>C | p.Phe404Leu | p.F404L | Q9Y4F5 | protein_coding | deleterious(0) | probably_damaging(0.999) | TCGA-PL-A8LY-01 | Breast | breast invasive carcinoma | Female | <65 | I/II | Unknown | Unknown | SD |
| CEP170B | SNV | Missense_Mutation | novel | c.58C>T | p.Arg20Trp | p.R20W | Q9Y4F5 | protein_coding | deleterious(0) | probably_damaging(0.999) | TCGA-S3-A6ZG-01 | Breast | breast invasive carcinoma | Female | >=65 | I/II | Chemotherapy | doxorubicin | CR |
| CEP170B | deletion | Frame_Shift_Del | c.3527delN | p.Ala1177ProfsTer118 | p.A1177Pfs*118 | Q9Y4F5 | protein_coding | TCGA-Z7-A8R6-01 | Breast | breast invasive carcinoma | Female | <65 | I/II | Chemotherapy | taxol | CR | |||
| CEP170B | SNV | Missense_Mutation | rs199634547 | c.380N>T | p.Ala127Val | p.A127V | Q9Y4F5 | protein_coding | tolerated(0.13) | benign(0.015) | TCGA-2W-A8YY-01 | Cervix | cervical & endocervical cancer | Female | <65 | I/II | Chemotherapy | cisplatin | CR |
| CEP170B | SNV | Missense_Mutation | novel | c.4181N>G | p.Glu1394Gly | p.E1394G | Q9Y4F5 | protein_coding | deleterious(0) | benign(0.171) | TCGA-2W-A8YY-01 | Cervix | cervical & endocervical cancer | Female | <65 | I/II | Chemotherapy | cisplatin | CR |
| CEP170B | SNV | Missense_Mutation | rs376474530 | c.3574N>T | p.Arg1192Cys | p.R1192C | Q9Y4F5 | protein_coding | deleterious(0) | probably_damaging(0.994) | TCGA-C5-A3HE-01 | Cervix | cervical & endocervical cancer | Female | <65 | I/II | Unknown | Unknown | PD |
| CEP170B | SNV | Missense_Mutation | rs375604191 | c.1141N>A | p.Gly381Arg | p.G381R | Q9Y4F5 | protein_coding | tolerated(0.37) | possibly_damaging(0.681) | TCGA-EK-A2RN-01 | Cervix | cervical & endocervical cancer | Female | <65 | I/II | Unknown | Unknown | SD |
| CEP170B | SNV | Missense_Mutation | c.1786N>C | p.Glu596Gln | p.E596Q | Q9Y4F5 | protein_coding | deleterious(0) | probably_damaging(0.969) | TCGA-UC-A7PF-01 | Cervix | cervical & endocervical cancer | Female | <65 | I/II | Unknown | Unknown | SD | |
| CEP170B | insertion | Frame_Shift_Ins | novel | c.2586_2587insT | p.Leu864SerfsTer8 | p.L864Sfs*8 | Q9Y4F5 | protein_coding | TCGA-C5-A902-01 | Cervix | cervical & endocervical cancer | Female | <65 | I/II | Chemotherapy | cisplatin | SD |
| Page: 1 2 3 4 5 6 7 8 9 |
Top |
Related drugs of malignant transformation related genes |
| Identification of chemicals and drugs interact with genes involved in malignant transfromation |
| (DGIdb 4.0) |
| Entrez ID | Symbol | Category | Interaction Types | Drug Claim Name | Drug Name | PMIDs |
| Page: 1 |

Copyright 2023-Present -The University of Texas Health Science Center at Houston |