
|
|||||
|
 | |
| |
| |
| |
| |
| |
|
Gene: CEP152 |
Gene summary for CEP152 |
| Gene information | Species | Human | Gene symbol | CEP152 | Gene ID | 22995 |
| Gene name | centrosomal protein 152 | |
| Gene Alias | MCPH4 | |
| Cytomap | 15q21.1 | |
| Gene Type | protein-coding | GO ID | GO:0000226 | UniProtAcc | O94986 |
Top |
Malignant transformation analysis |
| Identification of the aberrant gene expression in precancerous and cancerous lesions by comparing the gene expression of stem-like cells in diseased tissues with normal stem cells |
| Entrez ID | Symbol | Replicates | Species | Organ | Tissue | Adj P-value | Log2FC | Malignancy |
| 22995 | CEP152 | HCC1_Meng | Human | Liver | HCC | 1.51e-11 | 5.66e-02 | 0.0246 |
| 22995 | CEP152 | HCC2_Meng | Human | Liver | HCC | 7.69e-10 | 1.06e-01 | 0.0107 |
| 22995 | CEP152 | HCC2 | Human | Liver | HCC | 6.13e-07 | 2.48e+00 | 0.5341 |
| 22995 | CEP152 | HCC5 | Human | Liver | HCC | 4.15e-05 | 1.31e+00 | 0.4932 |
| 22995 | CEP152 | S014 | Human | Liver | HCC | 5.06e-06 | 2.30e-01 | 0.2254 |
| 22995 | CEP152 | S015 | Human | Liver | HCC | 1.05e-04 | 3.16e-01 | 0.2375 |
| 22995 | CEP152 | S016 | Human | Liver | HCC | 1.63e-08 | 2.53e-01 | 0.2243 |
| 22995 | CEP152 | PTC03 | Human | Thyroid | PTC | 1.97e-02 | 1.30e-01 | 0.1784 |
| 22995 | CEP152 | PTC06 | Human | Thyroid | PTC | 4.81e-03 | 1.41e-01 | 0.2057 |
| 22995 | CEP152 | PTC07 | Human | Thyroid | PTC | 5.64e-06 | 8.46e-02 | 0.2044 |
| 22995 | CEP152 | ATC09 | Human | Thyroid | ATC | 1.12e-02 | 1.49e-01 | 0.2871 |
| 22995 | CEP152 | ATC12 | Human | Thyroid | ATC | 5.92e-06 | 1.38e-01 | 0.34 |
| 22995 | CEP152 | ATC13 | Human | Thyroid | ATC | 1.19e-07 | 1.49e-01 | 0.34 |
| 22995 | CEP152 | ATC1 | Human | Thyroid | ATC | 4.67e-05 | 2.08e-01 | 0.2878 |
| 22995 | CEP152 | ATC2 | Human | Thyroid | ATC | 3.75e-06 | 6.48e-01 | 0.34 |
| 22995 | CEP152 | ATC4 | Human | Thyroid | ATC | 1.58e-10 | 1.72e-01 | 0.34 |
| 22995 | CEP152 | ATC5 | Human | Thyroid | ATC | 9.62e-09 | 2.04e-01 | 0.34 |
| Page: 1 |
| Tissue | Expression Dynamics | Abbreviation |
| Liver |  | HCC: Hepatocellular carcinoma |
| NAFLD: Non-alcoholic fatty liver disease | ||
| Thyroid | 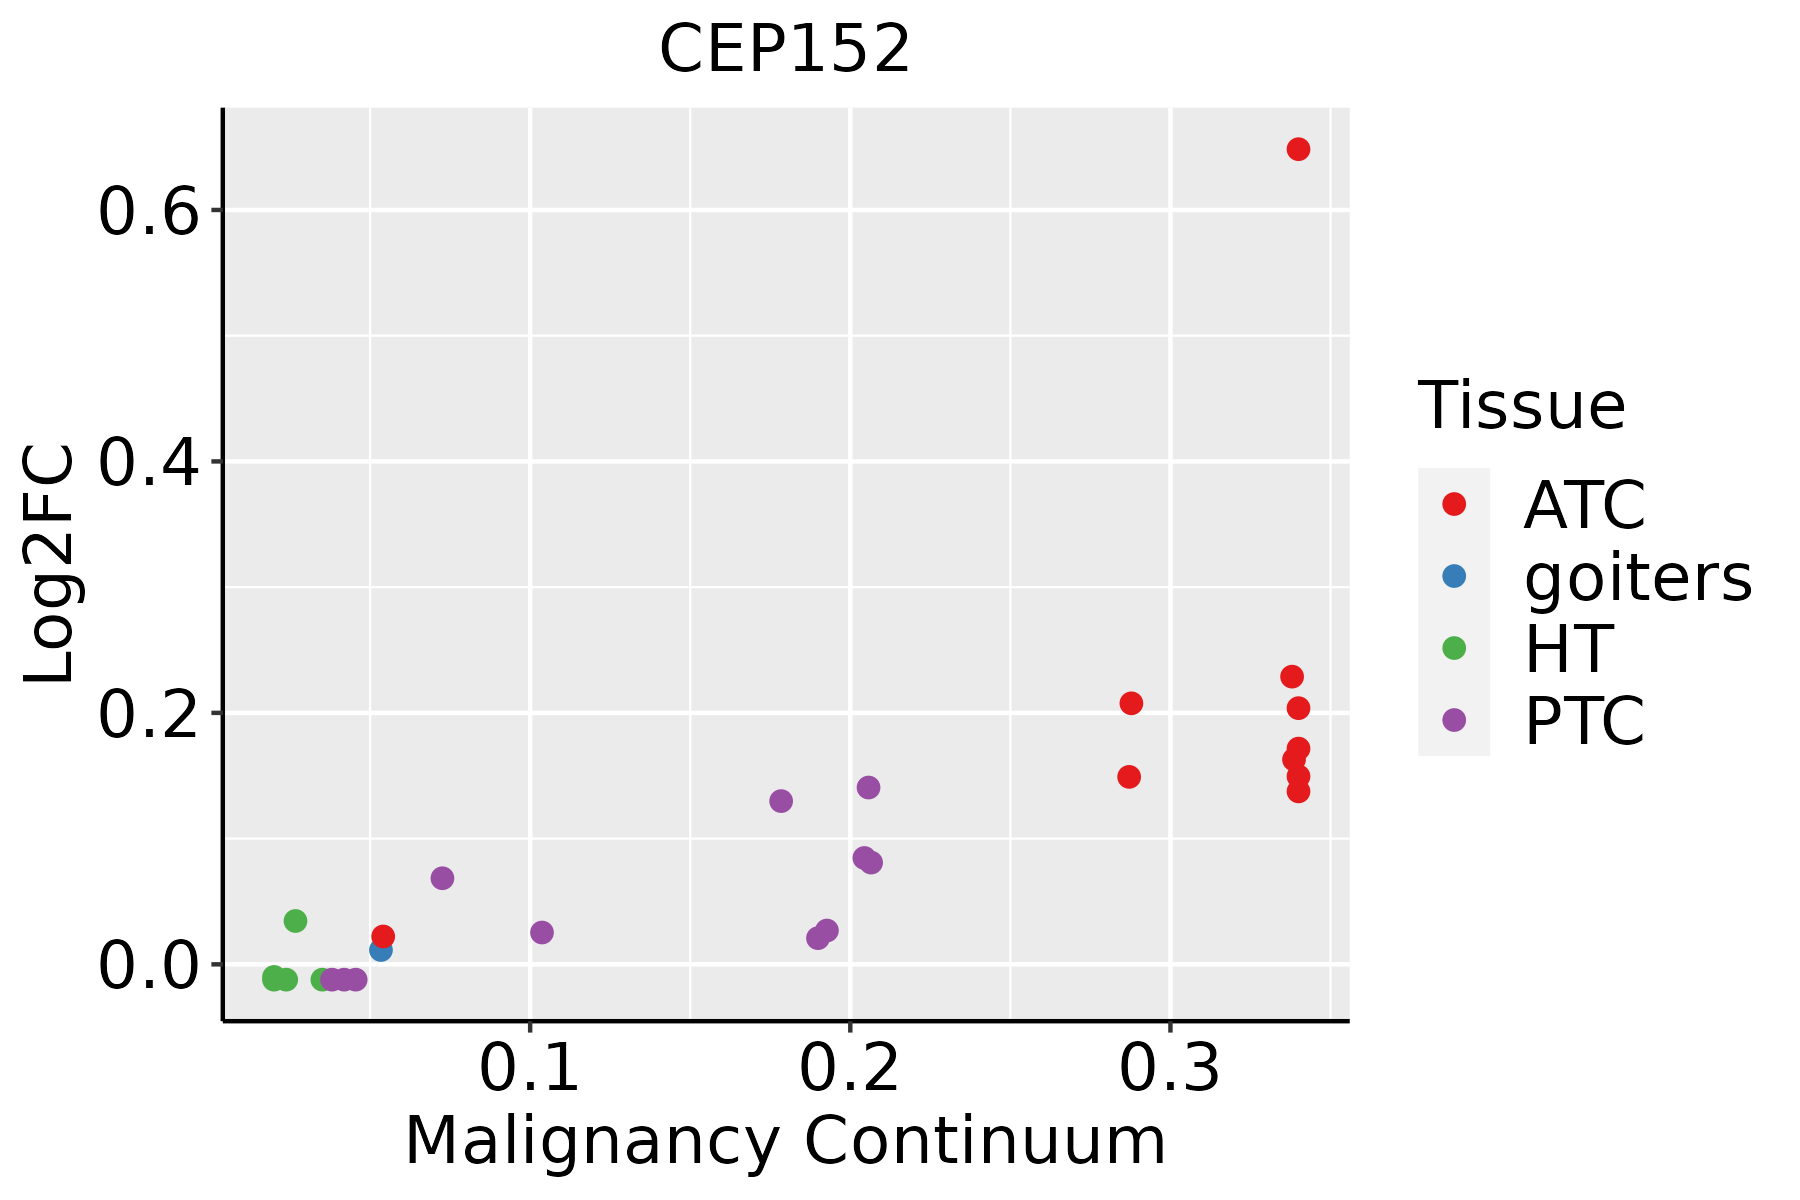 | ATC: Anaplastic thyroid cancer |
| HT: Hashimoto's thyroiditis | ||
| PTC: Papillary thyroid cancer |
| ∗log2FC in expression of this searched gene in stem-like cells from each diseased tissue sample relative to stem-like cells in normal samples in each tissue plotted against the malignancy continuum. Samples are colored based on if they are from different disease stage. |
Top |
Malignant transformation related pathway analysis |
| Find out the enriched GO biological processes and KEGG pathways involved in transition from healthy to precancer to cancer |
| Tissue | Disease Stage | Enriched GO biological Processes |
| Colorectum | AD |  |
| Colorectum | SER |  |
| Colorectum | MSS |  |
| Colorectum | MSI-H |  |
| Colorectum | FAP |  |
| ∗Top 15 enriched GO BP terms are showed in the bar plot of each disease state in each tissue. Each row represents a significant GO biological process which is colored according to the -log10(p.adjust). |
| Page: 1 2 3 4 5 6 7 8 9 |
| GO ID | Tissue | Disease Stage | Description | Gene Ratio | Bg Ratio | pvalue | p.adjust | Count |
| GO:0031023 | Liver | HCC | microtubule organizing center organization | 82/7958 | 143/18723 | 2.38e-04 | 1.79e-03 | 82 |
| GO:0007098 | Liver | HCC | centrosome cycle | 75/7958 | 130/18723 | 3.33e-04 | 2.34e-03 | 75 |
| GO:00310235 | Thyroid | PTC | microtubule organizing center organization | 65/5968 | 143/18723 | 4.48e-04 | 2.96e-03 | 65 |
| GO:00070984 | Thyroid | PTC | centrosome cycle | 59/5968 | 130/18723 | 8.39e-04 | 5.16e-03 | 59 |
| GO:0051298 | Thyroid | PTC | centrosome duplication | 36/5968 | 73/18723 | 1.41e-03 | 7.89e-03 | 36 |
| GO:003102311 | Thyroid | ATC | microtubule organizing center organization | 71/6293 | 143/18723 | 5.11e-05 | 3.99e-04 | 71 |
| GO:000709811 | Thyroid | ATC | centrosome cycle | 65/6293 | 130/18723 | 7.95e-05 | 5.97e-04 | 65 |
| GO:00512981 | Thyroid | ATC | centrosome duplication | 36/6293 | 73/18723 | 3.91e-03 | 1.70e-02 | 36 |
| Page: 1 |
| Pathway ID | Tissue | Disease Stage | Description | Gene Ratio | Bg Ratio | pvalue | p.adjust | qvalue | Count |
| Page: 1 |
Top |
Cell-cell communication analysis |
| Identification of potential cell-cell interactions between two cell types and their ligand-receptor pairs for different disease states |
| Ligand | Receptor | LRpair | Pathway | Tissue | Disease Stage |
| Page: 1 |
Top |
Single-cell gene regulatory network inference analysis |
| Find out the significant the regulons (TFs) and the target genes of each regulon across cell types for different disease states |
| TF | Cell Type | Tissue | Disease Stage | Target Gene | RSS | Regulon Activity |
| ∗The dot plots of a searched regulon are shown for all cell subpopulations in each disease state of each tissue based on the regulon specific score inferred using pySCENIC and by calculating the average expression. |
| Page: 1 |
Top |
Somatic mutation of malignant transformation related genes |
| Annotation of somatic variants for genes involved in malignant transformation |
| Hugo Symbol | Variant Class | Variant Classification | dbSNP RS | HGVSc | HGVSp | HGVSp Short | SWISSPROT | BIOTYPE | SIFT | PolyPhen | Tumor Sample Barcode | Tissue | Histology | Sex | Age | Stage | Therapy Types | Drugs | Outcome |
| CEP152 | SNV | Missense_Mutation | c.3410C>A | p.Pro1137His | p.P1137H | O94986 | protein_coding | tolerated(0.08) | possibly_damaging(0.569) | TCGA-A2-A1FW-01 | Breast | breast invasive carcinoma | Female | <65 | III/IV | Chemotherapy | cytoxan | SD | |
| CEP152 | SNV | Missense_Mutation | novel | c.2800C>T | p.Leu934Phe | p.L934F | O94986 | protein_coding | deleterious(0) | probably_damaging(1) | TCGA-A7-A4SB-01 | Breast | breast invasive carcinoma | Female | <65 | III/IV | Chemotherapy | docetaxel | CR |
| CEP152 | SNV | Missense_Mutation | novel | c.151N>T | p.Leu51Phe | p.L51F | O94986 | protein_coding | tolerated(0.19) | benign(0.104) | TCGA-A7-A4SE-01 | Breast | breast invasive carcinoma | Female | <65 | I/II | Chemotherapy | adriamycin | CR |
| CEP152 | SNV | Missense_Mutation | c.2305C>G | p.Leu769Val | p.L769V | O94986 | protein_coding | tolerated(0.31) | possibly_damaging(0.603) | TCGA-A8-A08F-01 | Breast | breast invasive carcinoma | Female | <65 | III/IV | Chemotherapy | 5-fluorouracil | CR | |
| CEP152 | SNV | Missense_Mutation | c.3285G>T | p.Gln1095His | p.Q1095H | O94986 | protein_coding | tolerated(0.07) | benign(0.162) | TCGA-AC-A23H-01 | Breast | breast invasive carcinoma | Female | >=65 | I/II | Unknown | Unknown | PD | |
| CEP152 | SNV | Missense_Mutation | c.361C>G | p.Pro121Ala | p.P121A | O94986 | protein_coding | tolerated(0.49) | benign(0.287) | TCGA-AC-A23H-01 | Breast | breast invasive carcinoma | Female | >=65 | I/II | Unknown | Unknown | PD | |
| CEP152 | SNV | Missense_Mutation | novel | c.4949G>A | p.Gly1650Glu | p.G1650E | O94986 | protein_coding | tolerated(0.17) | benign(0.113) | TCGA-AC-A5XS-01 | Breast | breast invasive carcinoma | Female | >=65 | I/II | Hormone Therapy | femara | SD |
| CEP152 | SNV | Missense_Mutation | novel | c.4061N>G | p.Ser1354Cys | p.S1354C | O94986 | protein_coding | deleterious(0.02) | probably_damaging(0.94) | TCGA-AC-A6IW-01 | Breast | breast invasive carcinoma | Female | >=65 | I/II | Unknown | Unknown | SD |
| CEP152 | SNV | Missense_Mutation | novel | c.3825A>C | p.Lys1275Asn | p.K1275N | O94986 | protein_coding | tolerated(0.23) | possibly_damaging(0.786) | TCGA-AN-A046-01 | Breast | breast invasive carcinoma | Female | >=65 | I/II | Unknown | Unknown | SD |
| CEP152 | SNV | Missense_Mutation | novel | c.3347G>T | p.Arg1116Ile | p.R1116I | O94986 | protein_coding | deleterious(0.03) | benign(0.007) | TCGA-AN-A046-01 | Breast | breast invasive carcinoma | Female | >=65 | I/II | Unknown | Unknown | SD |
| Page: 1 2 3 4 5 6 7 8 9 10 11 12 13 14 15 16 17 18 19 20 |
Top |
Related drugs of malignant transformation related genes |
| Identification of chemicals and drugs interact with genes involved in malignant transfromation |
| (DGIdb 4.0) |
| Entrez ID | Symbol | Category | Interaction Types | Drug Claim Name | Drug Name | PMIDs |
| Page: 1 |

Copyright 2023-Present -The University of Texas Health Science Center at Houston |