
|
|||||
|
 | |
| |
| |
| |
| |
| |
|
Gene: CEP135 |
Gene summary for CEP135 |
| Gene information | Species | Human | Gene symbol | CEP135 | Gene ID | 9662 |
| Gene name | centrosomal protein 135 | |
| Gene Alias | CEP4 | |
| Cytomap | 4q12 | |
| Gene Type | protein-coding | GO ID | GO:0000226 | UniProtAcc | Q66GS9 |
Top |
Malignant transformation analysis |
| Identification of the aberrant gene expression in precancerous and cancerous lesions by comparing the gene expression of stem-like cells in diseased tissues with normal stem cells |
| Entrez ID | Symbol | Replicates | Species | Organ | Tissue | Adj P-value | Log2FC | Malignancy |
| 9662 | CEP135 | LZE4T | Human | Esophagus | ESCC | 9.87e-06 | 1.27e-01 | 0.0811 |
| 9662 | CEP135 | P1T-E | Human | Esophagus | ESCC | 6.35e-04 | 2.63e-01 | 0.0875 |
| 9662 | CEP135 | P2T-E | Human | Esophagus | ESCC | 1.31e-28 | 5.83e-01 | 0.1177 |
| 9662 | CEP135 | P4T-E | Human | Esophagus | ESCC | 4.33e-09 | 2.65e-01 | 0.1323 |
| 9662 | CEP135 | P5T-E | Human | Esophagus | ESCC | 2.03e-09 | 1.76e-01 | 0.1327 |
| 9662 | CEP135 | P8T-E | Human | Esophagus | ESCC | 7.31e-14 | 2.05e-01 | 0.0889 |
| 9662 | CEP135 | P9T-E | Human | Esophagus | ESCC | 5.45e-03 | 7.95e-02 | 0.1131 |
| 9662 | CEP135 | P10T-E | Human | Esophagus | ESCC | 9.44e-07 | 1.39e-01 | 0.116 |
| 9662 | CEP135 | P11T-E | Human | Esophagus | ESCC | 1.92e-07 | 2.51e-01 | 0.1426 |
| 9662 | CEP135 | P12T-E | Human | Esophagus | ESCC | 8.40e-04 | 1.11e-01 | 0.1122 |
| 9662 | CEP135 | P15T-E | Human | Esophagus | ESCC | 5.81e-06 | 1.32e-01 | 0.1149 |
| 9662 | CEP135 | P16T-E | Human | Esophagus | ESCC | 5.79e-16 | 2.19e-01 | 0.1153 |
| 9662 | CEP135 | P17T-E | Human | Esophagus | ESCC | 4.85e-02 | 1.09e-01 | 0.1278 |
| 9662 | CEP135 | P20T-E | Human | Esophagus | ESCC | 4.08e-06 | 1.06e-01 | 0.1124 |
| 9662 | CEP135 | P21T-E | Human | Esophagus | ESCC | 3.28e-14 | 3.11e-01 | 0.1617 |
| 9662 | CEP135 | P22T-E | Human | Esophagus | ESCC | 4.40e-09 | 1.75e-01 | 0.1236 |
| 9662 | CEP135 | P24T-E | Human | Esophagus | ESCC | 2.31e-03 | 1.22e-01 | 0.1287 |
| 9662 | CEP135 | P26T-E | Human | Esophagus | ESCC | 4.41e-07 | 1.87e-01 | 0.1276 |
| 9662 | CEP135 | P27T-E | Human | Esophagus | ESCC | 9.44e-07 | 1.36e-01 | 0.1055 |
| 9662 | CEP135 | P28T-E | Human | Esophagus | ESCC | 1.00e-24 | 4.50e-01 | 0.1149 |
| Page: 1 2 3 4 |
| Tissue | Expression Dynamics | Abbreviation |
| Esophagus | 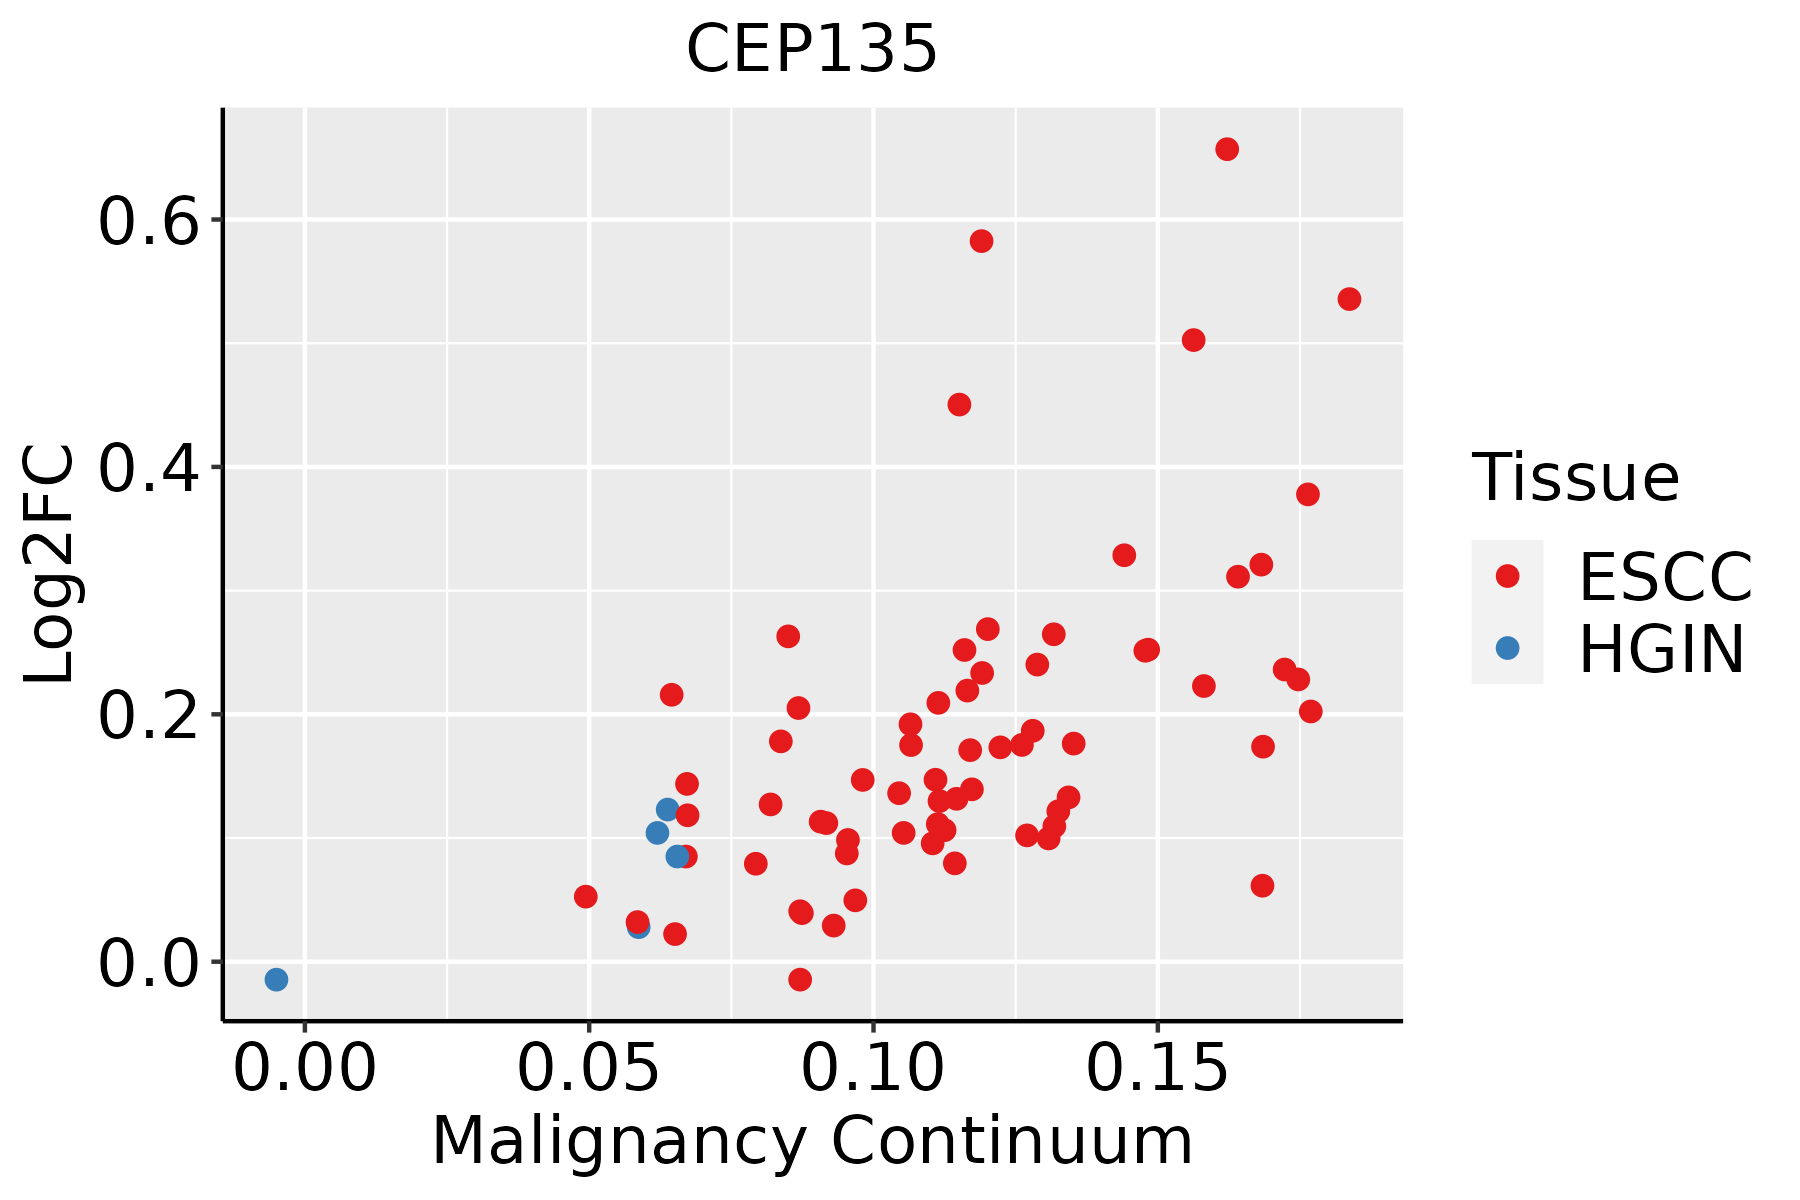 | ESCC: Esophageal squamous cell carcinoma |
| HGIN: High-grade intraepithelial neoplasias | ||
| LGIN: Low-grade intraepithelial neoplasias | ||
| Liver | 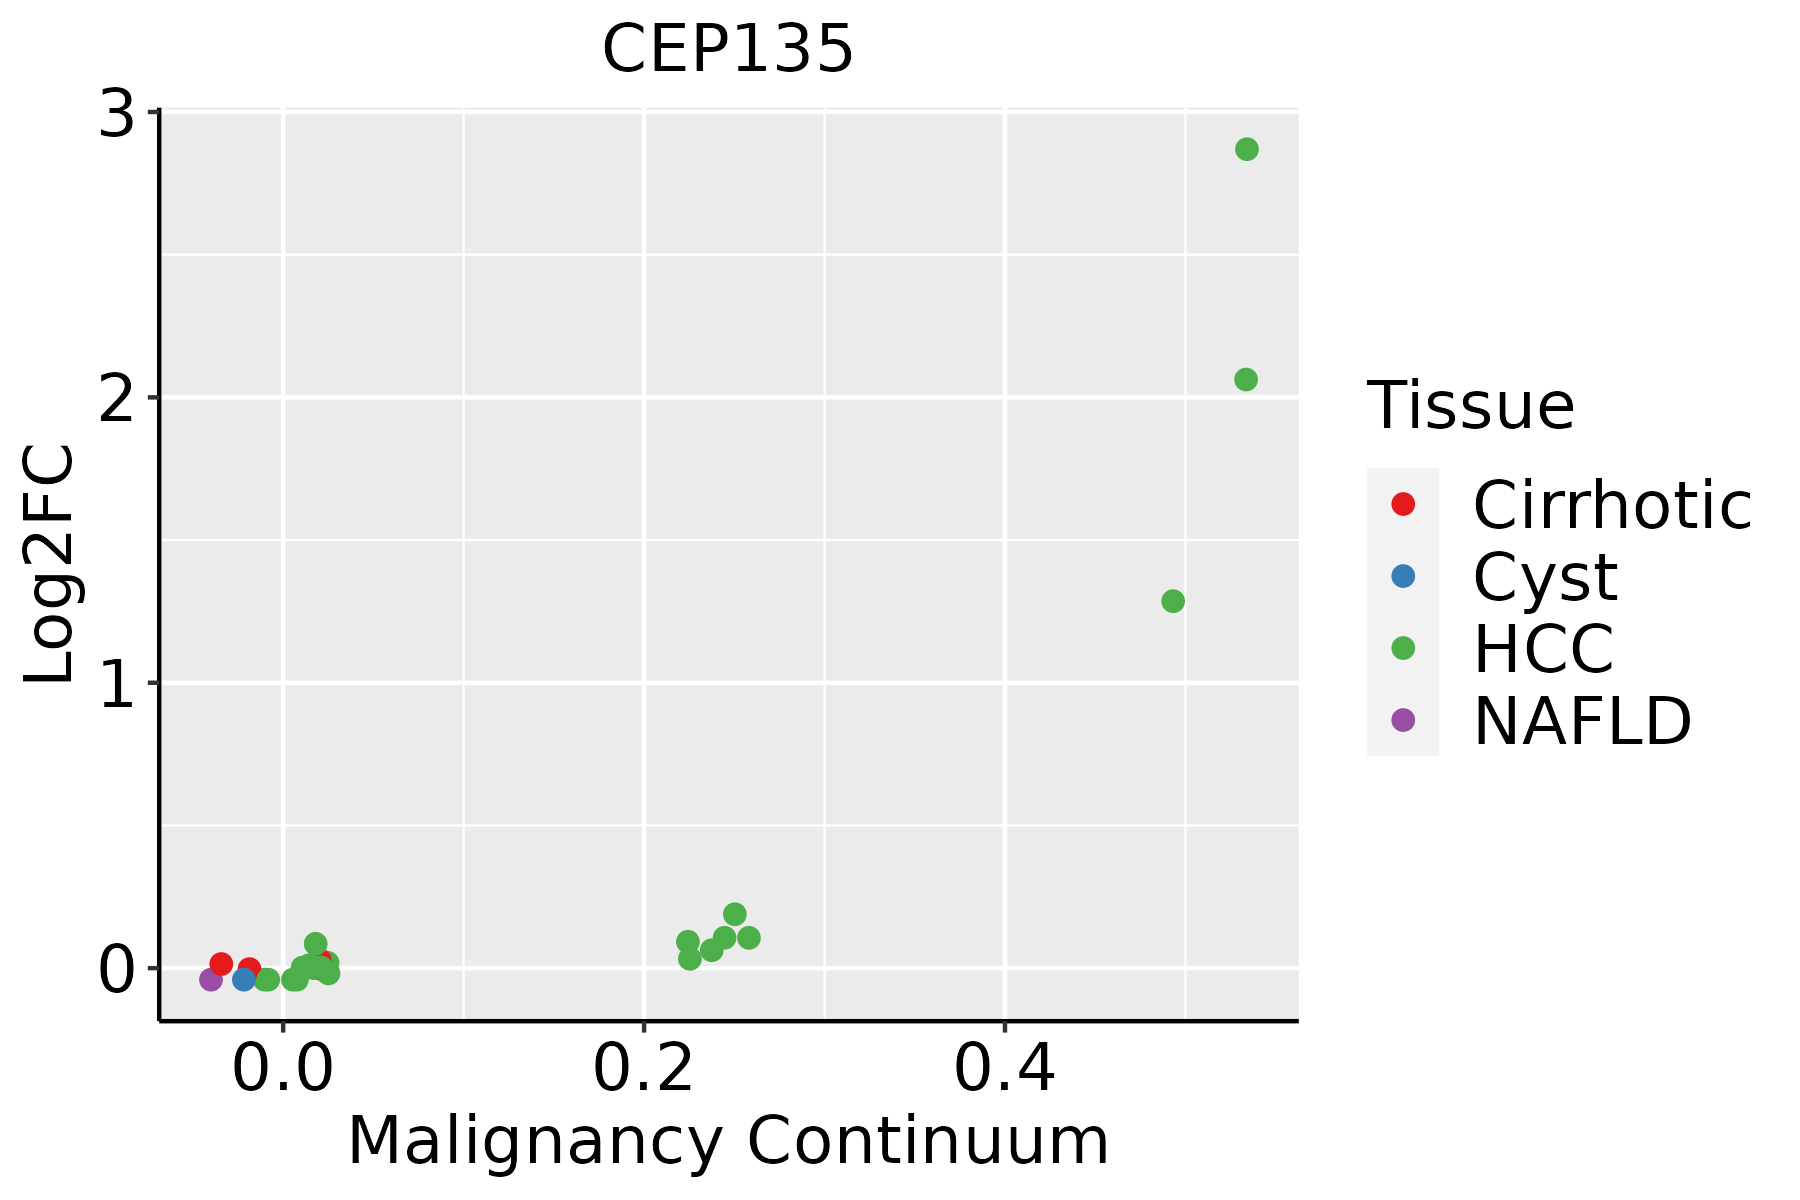 | HCC: Hepatocellular carcinoma |
| NAFLD: Non-alcoholic fatty liver disease | ||
| Thyroid |  | ATC: Anaplastic thyroid cancer |
| HT: Hashimoto's thyroiditis | ||
| PTC: Papillary thyroid cancer |
| ∗log2FC in expression of this searched gene in stem-like cells from each diseased tissue sample relative to stem-like cells in normal samples in each tissue plotted against the malignancy continuum. Samples are colored based on if they are from different disease stage. |
Top |
Malignant transformation related pathway analysis |
| Find out the enriched GO biological processes and KEGG pathways involved in transition from healthy to precancer to cancer |
| Tissue | Disease Stage | Enriched GO biological Processes |
| Colorectum | AD |  |
| Colorectum | SER |  |
| Colorectum | MSS |  |
| Colorectum | MSI-H |  |
| Colorectum | FAP |  |
| ∗Top 15 enriched GO BP terms are showed in the bar plot of each disease state in each tissue. Each row represents a significant GO biological process which is colored according to the -log10(p.adjust). |
| Page: 1 2 3 4 5 6 7 8 9 |
| GO ID | Tissue | Disease Stage | Description | Gene Ratio | Bg Ratio | pvalue | p.adjust | Count |
| GO:1904951111 | Esophagus | ESCC | positive regulation of establishment of protein localization | 216/8552 | 319/18723 | 1.01e-15 | 6.86e-14 | 216 |
| GO:190211514 | Esophagus | ESCC | regulation of organelle assembly | 116/8552 | 186/18723 | 3.15e-06 | 3.53e-05 | 116 |
| GO:00070982 | Esophagus | ESCC | centrosome cycle | 85/8552 | 130/18723 | 4.41e-06 | 4.69e-05 | 85 |
| GO:00310233 | Esophagus | ESCC | microtubule organizing center organization | 92/8552 | 143/18723 | 5.04e-06 | 5.31e-05 | 92 |
| GO:003134616 | Esophagus | ESCC | positive regulation of cell projection organization | 201/8552 | 353/18723 | 1.19e-05 | 1.11e-04 | 201 |
| GO:006049118 | Esophagus | ESCC | regulation of cell projection assembly | 110/8552 | 188/18723 | 2.60e-04 | 1.58e-03 | 110 |
| GO:012003218 | Esophagus | ESCC | regulation of plasma membrane bounded cell projection assembly | 108/8552 | 186/18723 | 4.37e-04 | 2.46e-03 | 108 |
| GO:01200347 | Esophagus | ESCC | positive regulation of plasma membrane bounded cell projection assembly | 64/8552 | 105/18723 | 1.15e-03 | 5.70e-03 | 64 |
| GO:0010457 | Esophagus | ESCC | centriole-centriole cohesion | 12/8552 | 14/18723 | 2.51e-03 | 1.08e-02 | 12 |
| GO:19055153 | Esophagus | ESCC | non-motile cilium assembly | 39/8552 | 61/18723 | 3.08e-03 | 1.28e-02 | 39 |
| GO:19021174 | Esophagus | ESCC | positive regulation of organelle assembly | 42/8552 | 67/18723 | 3.72e-03 | 1.52e-02 | 42 |
| GO:190495122 | Liver | HCC | positive regulation of establishment of protein localization | 207/7958 | 319/18723 | 3.95e-16 | 3.29e-14 | 207 |
| GO:003134611 | Liver | HCC | positive regulation of cell projection organization | 193/7958 | 353/18723 | 2.28e-06 | 3.08e-05 | 193 |
| GO:19021151 | Liver | HCC | regulation of organelle assembly | 110/7958 | 186/18723 | 3.30e-06 | 4.34e-05 | 110 |
| GO:0031023 | Liver | HCC | microtubule organizing center organization | 82/7958 | 143/18723 | 2.38e-04 | 1.79e-03 | 82 |
| GO:0007098 | Liver | HCC | centrosome cycle | 75/7958 | 130/18723 | 3.33e-04 | 2.34e-03 | 75 |
| GO:006049112 | Liver | HCC | regulation of cell projection assembly | 101/7958 | 188/18723 | 1.20e-03 | 6.69e-03 | 101 |
| GO:012003212 | Liver | HCC | regulation of plasma membrane bounded cell projection assembly | 100/7958 | 186/18723 | 1.23e-03 | 6.81e-03 | 100 |
| GO:1902117 | Liver | HCC | positive regulation of organelle assembly | 41/7958 | 67/18723 | 1.55e-03 | 8.20e-03 | 41 |
| GO:01200344 | Liver | HCC | positive regulation of plasma membrane bounded cell projection assembly | 58/7958 | 105/18723 | 5.66e-03 | 2.36e-02 | 58 |
| Page: 1 2 |
| Pathway ID | Tissue | Disease Stage | Description | Gene Ratio | Bg Ratio | pvalue | p.adjust | qvalue | Count |
| Page: 1 |
Top |
Cell-cell communication analysis |
| Identification of potential cell-cell interactions between two cell types and their ligand-receptor pairs for different disease states |
| Ligand | Receptor | LRpair | Pathway | Tissue | Disease Stage |
| Page: 1 |
Top |
Single-cell gene regulatory network inference analysis |
| Find out the significant the regulons (TFs) and the target genes of each regulon across cell types for different disease states |
| TF | Cell Type | Tissue | Disease Stage | Target Gene | RSS | Regulon Activity |
| ∗The dot plots of a searched regulon are shown for all cell subpopulations in each disease state of each tissue based on the regulon specific score inferred using pySCENIC and by calculating the average expression. |
| Page: 1 |
Top |
Somatic mutation of malignant transformation related genes |
| Annotation of somatic variants for genes involved in malignant transformation |
| Hugo Symbol | Variant Class | Variant Classification | dbSNP RS | HGVSc | HGVSp | HGVSp Short | SWISSPROT | BIOTYPE | SIFT | PolyPhen | Tumor Sample Barcode | Tissue | Histology | Sex | Age | Stage | Therapy Types | Drugs | Outcome |
| CEP135 | SNV | Missense_Mutation | rs778189963 | c.1528N>T | p.Arg510Cys | p.R510C | Q66GS9 | protein_coding | tolerated(0.33) | benign(0.001) | TCGA-A7-A26I-01 | Breast | breast invasive carcinoma | Female | >=65 | I/II | Chemotherapy | cytoxan | SD |
| CEP135 | SNV | Missense_Mutation | c.1281N>A | p.Met427Ile | p.M427I | Q66GS9 | protein_coding | tolerated(0.06) | possibly_damaging(0.667) | TCGA-AC-A23H-01 | Breast | breast invasive carcinoma | Female | >=65 | I/II | Unknown | Unknown | PD | |
| CEP135 | SNV | Missense_Mutation | c.178N>C | p.Glu60Gln | p.E60Q | Q66GS9 | protein_coding | deleterious(0) | benign(0.2) | TCGA-AN-A0AJ-01 | Breast | breast invasive carcinoma | Female | >=65 | I/II | Unknown | Unknown | SD | |
| CEP135 | SNV | Missense_Mutation | c.1895N>C | p.Leu632Ser | p.L632S | Q66GS9 | protein_coding | tolerated(0.85) | benign(0.001) | TCGA-D8-A1XQ-01 | Breast | breast invasive carcinoma | Female | >=65 | I/II | Unknown | Unknown | SD | |
| CEP135 | SNV | Missense_Mutation | c.2831C>G | p.Ser944Cys | p.S944C | Q66GS9 | protein_coding | deleterious(0.01) | possibly_damaging(0.904) | TCGA-GM-A2D9-01 | Breast | breast invasive carcinoma | Female | >=65 | I/II | Hormone Therapy | arimidex | SD | |
| CEP135 | insertion | Nonsense_Mutation | novel | c.2203_2204insTACATT | p.Glu735delinsValHisTer | p.E735delinsVH* | Q66GS9 | protein_coding | TCGA-AC-A3QQ-01 | Breast | breast invasive carcinoma | Female | <65 | I/II | Unknown | Unknown | SD | ||
| CEP135 | SNV | Missense_Mutation | novel | c.782C>T | p.Ser261Phe | p.S261F | Q66GS9 | protein_coding | deleterious(0) | possibly_damaging(0.632) | TCGA-2W-A8YY-01 | Cervix | cervical & endocervical cancer | Female | <65 | I/II | Chemotherapy | cisplatin | CR |
| CEP135 | SNV | Missense_Mutation | c.908N>G | p.Ser303Cys | p.S303C | Q66GS9 | protein_coding | deleterious(0) | possibly_damaging(0.605) | TCGA-C5-A1BF-01 | Cervix | cervical & endocervical cancer | Female | <65 | I/II | Chemotherapy | cisplatin | PD | |
| CEP135 | SNV | Missense_Mutation | rs747930985 | c.1976C>T | p.Ser659Leu | p.S659L | Q66GS9 | protein_coding | tolerated(1) | benign(0.124) | TCGA-Q1-A73O-01 | Cervix | cervical & endocervical cancer | Female | <65 | I/II | Chemotherapy | cisplatin | CR |
| CEP135 | SNV | Missense_Mutation | rs779689049 | c.3343N>T | p.Arg1115Cys | p.R1115C | Q66GS9 | protein_coding | deleterious(0) | probably_damaging(1) | TCGA-A6-2686-01 | Colorectum | colon adenocarcinoma | Female | >=65 | I/II | Unknown | Unknown | SD |
| Page: 1 2 3 4 5 6 7 8 9 10 11 |
Top |
Related drugs of malignant transformation related genes |
| Identification of chemicals and drugs interact with genes involved in malignant transfromation |
| (DGIdb 4.0) |
| Entrez ID | Symbol | Category | Interaction Types | Drug Claim Name | Drug Name | PMIDs |
| Page: 1 |

Copyright 2023-Present -The University of Texas Health Science Center at Houston |