
|
|||||
|
 | |
| |
| |
| |
| |
| |
|
Gene: CEP131 |
Gene summary for CEP131 |
| Gene information | Species | Human | Gene symbol | CEP131 | Gene ID | 22994 |
| Gene name | centrosomal protein 131 | |
| Gene Alias | AZ1 | |
| Cytomap | 17q25.3 | |
| Gene Type | protein-coding | GO ID | GO:0000003 | UniProtAcc | Q9UPN4 |
Top |
Malignant transformation analysis |
| Identification of the aberrant gene expression in precancerous and cancerous lesions by comparing the gene expression of stem-like cells in diseased tissues with normal stem cells |
| Entrez ID | Symbol | Replicates | Species | Organ | Tissue | Adj P-value | Log2FC | Malignancy |
| 22994 | CEP131 | LZE7T | Human | Esophagus | ESCC | 2.42e-05 | 2.04e-01 | 0.0667 |
| 22994 | CEP131 | LZE24T | Human | Esophagus | ESCC | 2.97e-13 | 2.82e-01 | 0.0596 |
| 22994 | CEP131 | P2T-E | Human | Esophagus | ESCC | 5.36e-12 | 1.88e-01 | 0.1177 |
| 22994 | CEP131 | P4T-E | Human | Esophagus | ESCC | 1.80e-02 | 6.38e-02 | 0.1323 |
| 22994 | CEP131 | P5T-E | Human | Esophagus | ESCC | 1.11e-02 | 6.38e-02 | 0.1327 |
| 22994 | CEP131 | P8T-E | Human | Esophagus | ESCC | 1.97e-15 | 1.19e-01 | 0.0889 |
| 22994 | CEP131 | P10T-E | Human | Esophagus | ESCC | 1.50e-07 | 1.30e-01 | 0.116 |
| 22994 | CEP131 | P11T-E | Human | Esophagus | ESCC | 4.27e-09 | 4.31e-01 | 0.1426 |
| 22994 | CEP131 | P12T-E | Human | Esophagus | ESCC | 1.73e-13 | 1.72e-01 | 0.1122 |
| 22994 | CEP131 | P15T-E | Human | Esophagus | ESCC | 1.95e-04 | 1.02e-01 | 0.1149 |
| 22994 | CEP131 | P16T-E | Human | Esophagus | ESCC | 3.40e-06 | 1.51e-01 | 0.1153 |
| 22994 | CEP131 | P17T-E | Human | Esophagus | ESCC | 5.33e-06 | 2.29e-01 | 0.1278 |
| 22994 | CEP131 | P20T-E | Human | Esophagus | ESCC | 2.34e-21 | 4.89e-01 | 0.1124 |
| 22994 | CEP131 | P21T-E | Human | Esophagus | ESCC | 5.40e-18 | 1.56e-01 | 0.1617 |
| 22994 | CEP131 | P22T-E | Human | Esophagus | ESCC | 5.58e-08 | 1.27e-01 | 0.1236 |
| 22994 | CEP131 | P23T-E | Human | Esophagus | ESCC | 2.44e-03 | 1.32e-01 | 0.108 |
| 22994 | CEP131 | P24T-E | Human | Esophagus | ESCC | 2.36e-14 | 1.60e-01 | 0.1287 |
| 22994 | CEP131 | P26T-E | Human | Esophagus | ESCC | 9.23e-12 | 1.33e-01 | 0.1276 |
| 22994 | CEP131 | P27T-E | Human | Esophagus | ESCC | 1.35e-17 | 1.48e-01 | 0.1055 |
| 22994 | CEP131 | P28T-E | Human | Esophagus | ESCC | 8.66e-08 | 1.61e-01 | 0.1149 |
| Page: 1 2 3 |
| Tissue | Expression Dynamics | Abbreviation |
| Esophagus | 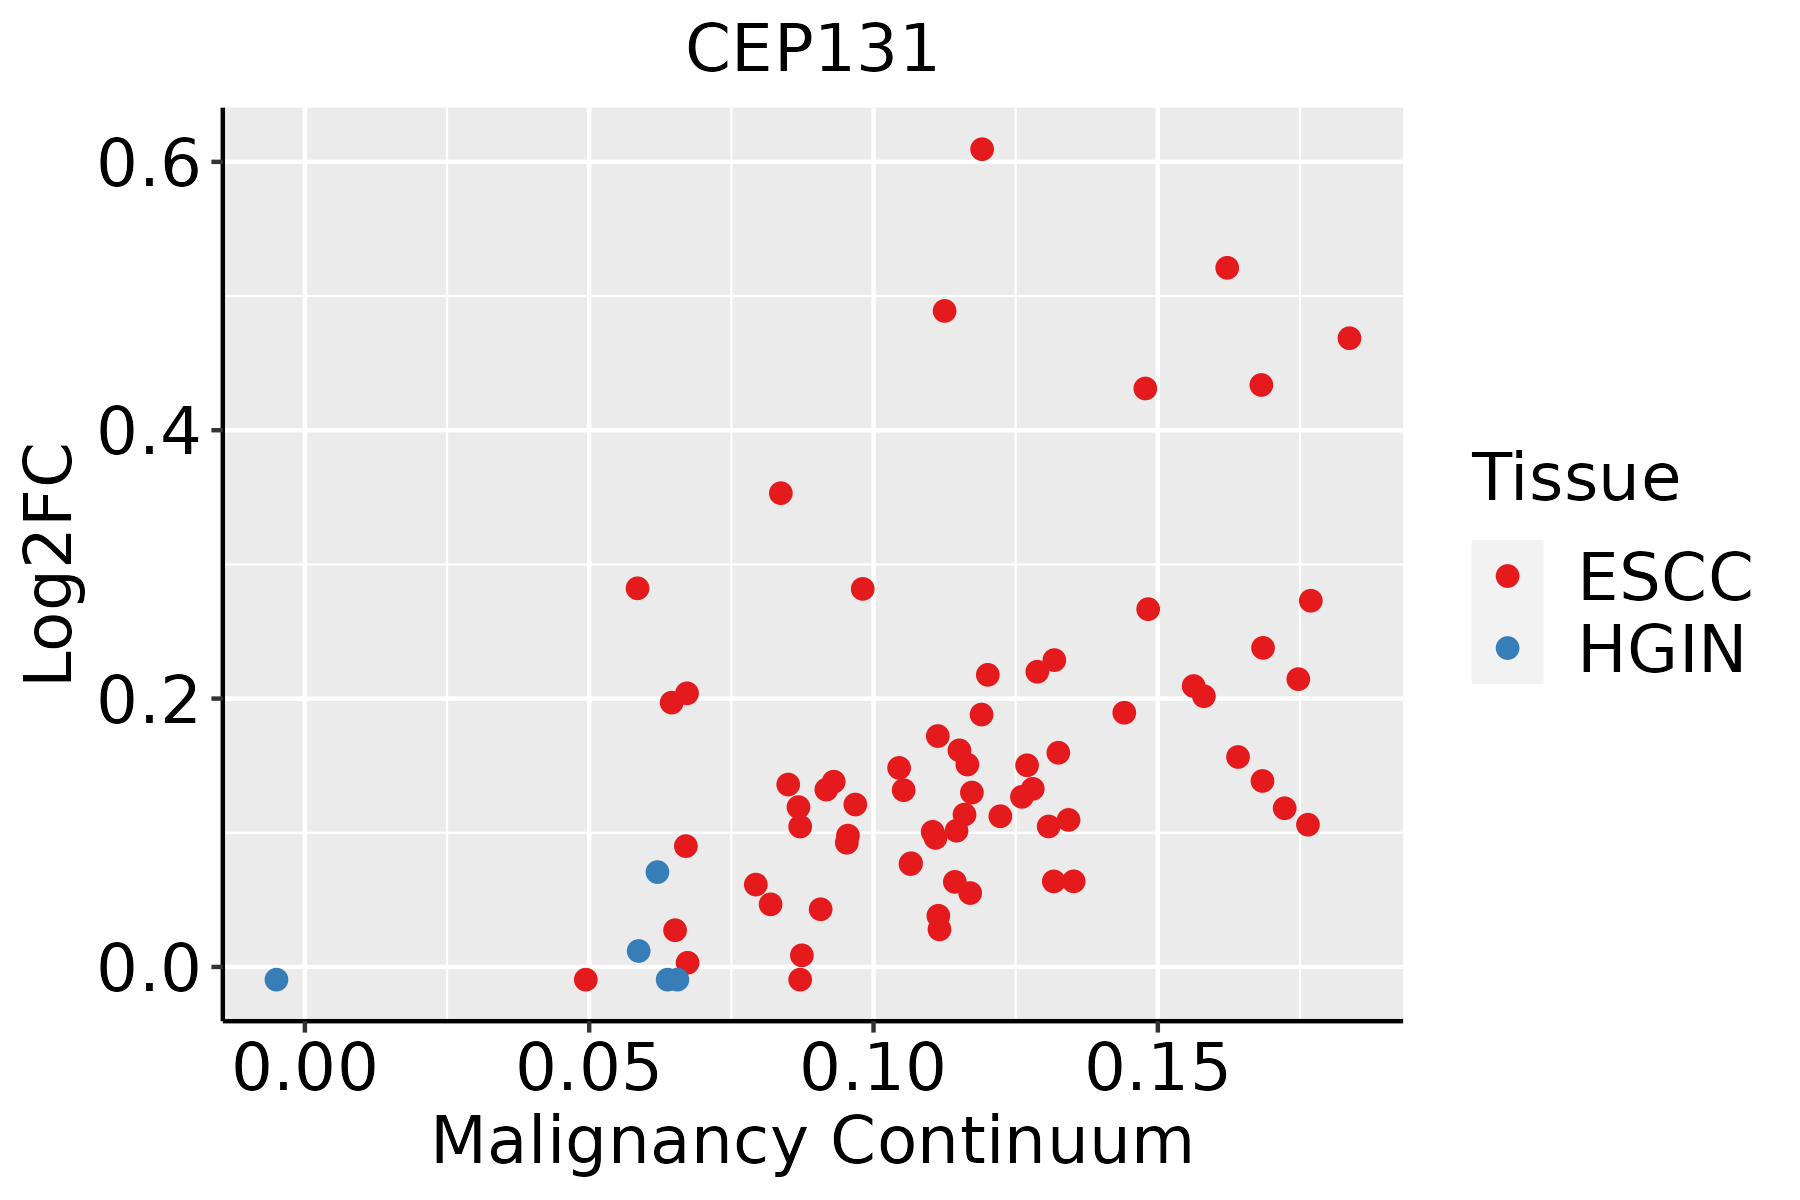 | ESCC: Esophageal squamous cell carcinoma |
| HGIN: High-grade intraepithelial neoplasias | ||
| LGIN: Low-grade intraepithelial neoplasias |
| ∗log2FC in expression of this searched gene in stem-like cells from each diseased tissue sample relative to stem-like cells in normal samples in each tissue plotted against the malignancy continuum. Samples are colored based on if they are from different disease stage. |
Top |
Malignant transformation related pathway analysis |
| Find out the enriched GO biological processes and KEGG pathways involved in transition from healthy to precancer to cancer |
| Tissue | Disease Stage | Enriched GO biological Processes |
| Colorectum | AD |  |
| Colorectum | SER |  |
| Colorectum | MSS |  |
| Colorectum | MSI-H |  |
| Colorectum | FAP |  |
| ∗Top 15 enriched GO BP terms are showed in the bar plot of each disease state in each tissue. Each row represents a significant GO biological process which is colored according to the -log10(p.adjust). |
| Page: 1 2 3 4 5 6 7 8 9 |
| GO ID | Tissue | Disease Stage | Description | Gene Ratio | Bg Ratio | pvalue | p.adjust | Count |
| GO:003238618 | Esophagus | ESCC | regulation of intracellular transport | 243/8552 | 337/18723 | 3.20e-23 | 7.25e-21 | 243 |
| GO:0033157110 | Esophagus | ESCC | regulation of intracellular protein transport | 169/8552 | 229/18723 | 3.31e-18 | 3.23e-16 | 169 |
| GO:0032388110 | Esophagus | ESCC | positive regulation of intracellular transport | 152/8552 | 202/18723 | 7.89e-18 | 7.36e-16 | 152 |
| GO:1904951111 | Esophagus | ESCC | positive regulation of establishment of protein localization | 216/8552 | 319/18723 | 1.01e-15 | 6.86e-14 | 216 |
| GO:009031617 | Esophagus | ESCC | positive regulation of intracellular protein transport | 122/8552 | 160/18723 | 2.45e-15 | 1.49e-13 | 122 |
| GO:0051222111 | Esophagus | ESCC | positive regulation of protein transport | 204/8552 | 303/18723 | 1.56e-14 | 8.38e-13 | 204 |
| GO:003070518 | Esophagus | ESCC | cytoskeleton-dependent intracellular transport | 133/8552 | 195/18723 | 1.48e-10 | 4.27e-09 | 133 |
| GO:001097013 | Esophagus | ESCC | transport along microtubule | 107/8552 | 155/18723 | 3.17e-09 | 6.80e-08 | 107 |
| GO:003150314 | Esophagus | ESCC | protein-containing complex localization | 139/8552 | 220/18723 | 1.14e-07 | 1.85e-06 | 139 |
| GO:00726985 | Esophagus | ESCC | protein localization to microtubule cytoskeleton | 43/8552 | 54/18723 | 3.28e-07 | 4.61e-06 | 43 |
| GO:00443804 | Esophagus | ESCC | protein localization to cytoskeleton | 45/8552 | 58/18723 | 6.89e-07 | 8.99e-06 | 45 |
| GO:00070982 | Esophagus | ESCC | centrosome cycle | 85/8552 | 130/18723 | 4.41e-06 | 4.69e-05 | 85 |
| GO:00310233 | Esophagus | ESCC | microtubule organizing center organization | 92/8552 | 143/18723 | 5.04e-06 | 5.31e-05 | 92 |
| GO:00991114 | Esophagus | ESCC | microtubule-based transport | 115/8552 | 190/18723 | 2.54e-05 | 2.15e-04 | 115 |
| GO:19055086 | Esophagus | ESCC | protein localization to microtubule organizing center | 28/8552 | 35/18723 | 3.40e-05 | 2.78e-04 | 28 |
| GO:00715396 | Esophagus | ESCC | protein localization to centrosome | 26/8552 | 33/18723 | 1.06e-04 | 7.43e-04 | 26 |
| GO:00328864 | Esophagus | ESCC | regulation of microtubule-based process | 134/8552 | 240/18723 | 9.44e-04 | 4.80e-03 | 134 |
| GO:19055153 | Esophagus | ESCC | non-motile cilium assembly | 39/8552 | 61/18723 | 3.08e-03 | 1.28e-02 | 39 |
| Page: 1 |
| Pathway ID | Tissue | Disease Stage | Description | Gene Ratio | Bg Ratio | pvalue | p.adjust | qvalue | Count |
| Page: 1 |
Top |
Cell-cell communication analysis |
| Identification of potential cell-cell interactions between two cell types and their ligand-receptor pairs for different disease states |
| Ligand | Receptor | LRpair | Pathway | Tissue | Disease Stage |
| Page: 1 |
Top |
Single-cell gene regulatory network inference analysis |
| Find out the significant the regulons (TFs) and the target genes of each regulon across cell types for different disease states |
| TF | Cell Type | Tissue | Disease Stage | Target Gene | RSS | Regulon Activity |
| ∗The dot plots of a searched regulon are shown for all cell subpopulations in each disease state of each tissue based on the regulon specific score inferred using pySCENIC and by calculating the average expression. |
| Page: 1 |
Top |
Somatic mutation of malignant transformation related genes |
| Annotation of somatic variants for genes involved in malignant transformation |
| Hugo Symbol | Variant Class | Variant Classification | dbSNP RS | HGVSc | HGVSp | HGVSp Short | SWISSPROT | BIOTYPE | SIFT | PolyPhen | Tumor Sample Barcode | Tissue | Histology | Sex | Age | Stage | Therapy Types | Drugs | Outcome |
| CEP131 | SNV | Missense_Mutation | c.2028G>C | p.Glu676Asp | p.E676D | Q9UPN4 | protein_coding | tolerated(0.05) | possibly_damaging(0.547) | TCGA-BH-A0AW-01 | Breast | breast invasive carcinoma | Female | <65 | I/II | Chemotherapy | carboplatin | SD | |
| CEP131 | SNV | Missense_Mutation | rs573786538 | c.1673N>T | p.Ala558Val | p.A558V | Q9UPN4 | protein_coding | tolerated(0.26) | benign(0.011) | TCGA-BH-A18G-01 | Breast | breast invasive carcinoma | Female | >=65 | I/II | Unknown | Unknown | SD |
| CEP131 | SNV | Missense_Mutation | novel | c.2723N>G | p.Glu908Gly | p.E908G | Q9UPN4 | protein_coding | deleterious(0) | probably_damaging(0.999) | TCGA-D8-A1XO-01 | Breast | breast invasive carcinoma | Female | <65 | I/II | Hormone Therapy | tamoxiphen | SD |
| CEP131 | SNV | Missense_Mutation | c.2048N>C | p.Leu683Ser | p.L683S | Q9UPN4 | protein_coding | deleterious(0) | benign(0.044) | TCGA-D8-A1XQ-01 | Breast | breast invasive carcinoma | Female | >=65 | I/II | Unknown | Unknown | SD | |
| CEP131 | SNV | Missense_Mutation | novel | c.2723N>G | p.Glu908Gly | p.E908G | Q9UPN4 | protein_coding | deleterious(0) | probably_damaging(0.999) | TCGA-E2-A1LB-01 | Breast | breast invasive carcinoma | Female | <65 | I/II | Chemotherapy | cytoxan | SD |
| CEP131 | SNV | Missense_Mutation | novel | c.1213N>A | p.Gly405Ser | p.G405S | Q9UPN4 | protein_coding | tolerated(0.24) | benign(0.027) | TCGA-OL-A5RW-01 | Breast | breast invasive carcinoma | Female | <65 | I/II | Chemotherapy | adriamycin | CR |
| CEP131 | insertion | Frame_Shift_Ins | novel | c.153_154insG | p.Ser52GlufsTer23 | p.S52Efs*23 | Q9UPN4 | protein_coding | TCGA-A2-A0CP-01 | Breast | breast invasive carcinoma | Female | <65 | I/II | Chemotherapy | cytoxan | SD | ||
| CEP131 | insertion | Nonsense_Mutation | novel | c.152_153insAGATTTGCTCGAACCCAGGAGGCAGAGGTTGCGGTGAGC | p.Gly51_Ser52insAspLeuLeuGluProArgArgGlnArgLeuArgTerAla | p.G51_S52insDLLEPRRQRLR*A | Q9UPN4 | protein_coding | TCGA-A2-A0CP-01 | Breast | breast invasive carcinoma | Female | <65 | I/II | Chemotherapy | cytoxan | SD | ||
| CEP131 | deletion | Frame_Shift_Del | novel | c.696delN | p.Asn232LysfsTer25 | p.N232Kfs*25 | Q9UPN4 | protein_coding | TCGA-D8-A27V-01 | Breast | breast invasive carcinoma | Female | <65 | I/II | Hormone Therapy | tamoxiphen | SD | ||
| CEP131 | deletion | Frame_Shift_Del | novel | c.244delG | p.Val82SerfsTer18 | p.V82Sfs*18 | Q9UPN4 | protein_coding | TCGA-EW-A2FV-01 | Breast | breast invasive carcinoma | Female | <65 | III/IV | Chemotherapy | docetaxel | SD |
| Page: 1 2 3 4 5 6 7 8 |
Top |
Related drugs of malignant transformation related genes |
| Identification of chemicals and drugs interact with genes involved in malignant transfromation |
| (DGIdb 4.0) |
| Entrez ID | Symbol | Category | Interaction Types | Drug Claim Name | Drug Name | PMIDs |
| Page: 1 |

Copyright 2023-Present -The University of Texas Health Science Center at Houston |