
|
|||||
|
 | |
| |
| |
| |
| |
| |
|
Gene: CEP126 |
Gene summary for CEP126 |
| Gene information | Species | Human | Gene symbol | CEP126 | Gene ID | 57562 |
| Gene name | centrosomal protein 126 | |
| Gene Alias | KIAA1377 | |
| Cytomap | 11q22.1 | |
| Gene Type | protein-coding | GO ID | GO:0000226 | UniProtAcc | Q9P2H0 |
Top |
Malignant transformation analysis |
| Identification of the aberrant gene expression in precancerous and cancerous lesions by comparing the gene expression of stem-like cells in diseased tissues with normal stem cells |
| Entrez ID | Symbol | Replicates | Species | Organ | Tissue | Adj P-value | Log2FC | Malignancy |
| 57562 | CEP126 | LZE24T | Human | Esophagus | ESCC | 5.27e-06 | 3.42e-01 | 0.0596 |
| 57562 | CEP126 | P2T-E | Human | Esophagus | ESCC | 1.02e-04 | 1.74e-01 | 0.1177 |
| 57562 | CEP126 | P4T-E | Human | Esophagus | ESCC | 3.08e-04 | 9.68e-02 | 0.1323 |
| 57562 | CEP126 | P8T-E | Human | Esophagus | ESCC | 6.69e-24 | 4.21e-01 | 0.0889 |
| 57562 | CEP126 | P10T-E | Human | Esophagus | ESCC | 6.32e-04 | 8.16e-02 | 0.116 |
| 57562 | CEP126 | P15T-E | Human | Esophagus | ESCC | 8.19e-08 | 2.06e-01 | 0.1149 |
| 57562 | CEP126 | P22T-E | Human | Esophagus | ESCC | 2.17e-03 | 4.45e-02 | 0.1236 |
| 57562 | CEP126 | P26T-E | Human | Esophagus | ESCC | 7.92e-08 | 2.02e-01 | 0.1276 |
| 57562 | CEP126 | P61T-E | Human | Esophagus | ESCC | 1.71e-03 | 7.92e-02 | 0.099 |
| 57562 | CEP126 | P62T-E | Human | Esophagus | ESCC | 3.43e-08 | 2.15e-01 | 0.1302 |
| 57562 | CEP126 | P74T-E | Human | Esophagus | ESCC | 6.79e-07 | 2.48e-01 | 0.1479 |
| 57562 | CEP126 | P75T-E | Human | Esophagus | ESCC | 8.76e-04 | 1.19e-01 | 0.1125 |
| 57562 | CEP126 | P76T-E | Human | Esophagus | ESCC | 1.63e-11 | 2.65e-01 | 0.1207 |
| 57562 | CEP126 | P80T-E | Human | Esophagus | ESCC | 3.86e-06 | 2.21e-01 | 0.155 |
| 57562 | CEP126 | P82T-E | Human | Esophagus | ESCC | 2.54e-05 | 3.51e-01 | 0.1072 |
| 57562 | CEP126 | P89T-E | Human | Esophagus | ESCC | 1.32e-02 | 2.29e-01 | 0.1752 |
| 57562 | CEP126 | P107T-E | Human | Esophagus | ESCC | 9.45e-33 | 7.62e-01 | 0.171 |
| 57562 | CEP126 | P130T-E | Human | Esophagus | ESCC | 3.21e-23 | 5.31e-01 | 0.1676 |
| 57562 | CEP126 | HCC1_Meng | Human | Liver | HCC | 1.13e-04 | -2.15e-02 | 0.0246 |
| 57562 | CEP126 | HCC2_Meng | Human | Liver | HCC | 1.63e-05 | 8.62e-02 | 0.0107 |
| Page: 1 2 3 |
| Tissue | Expression Dynamics | Abbreviation |
| Esophagus |  | ESCC: Esophageal squamous cell carcinoma |
| HGIN: High-grade intraepithelial neoplasias | ||
| LGIN: Low-grade intraepithelial neoplasias | ||
| Liver | 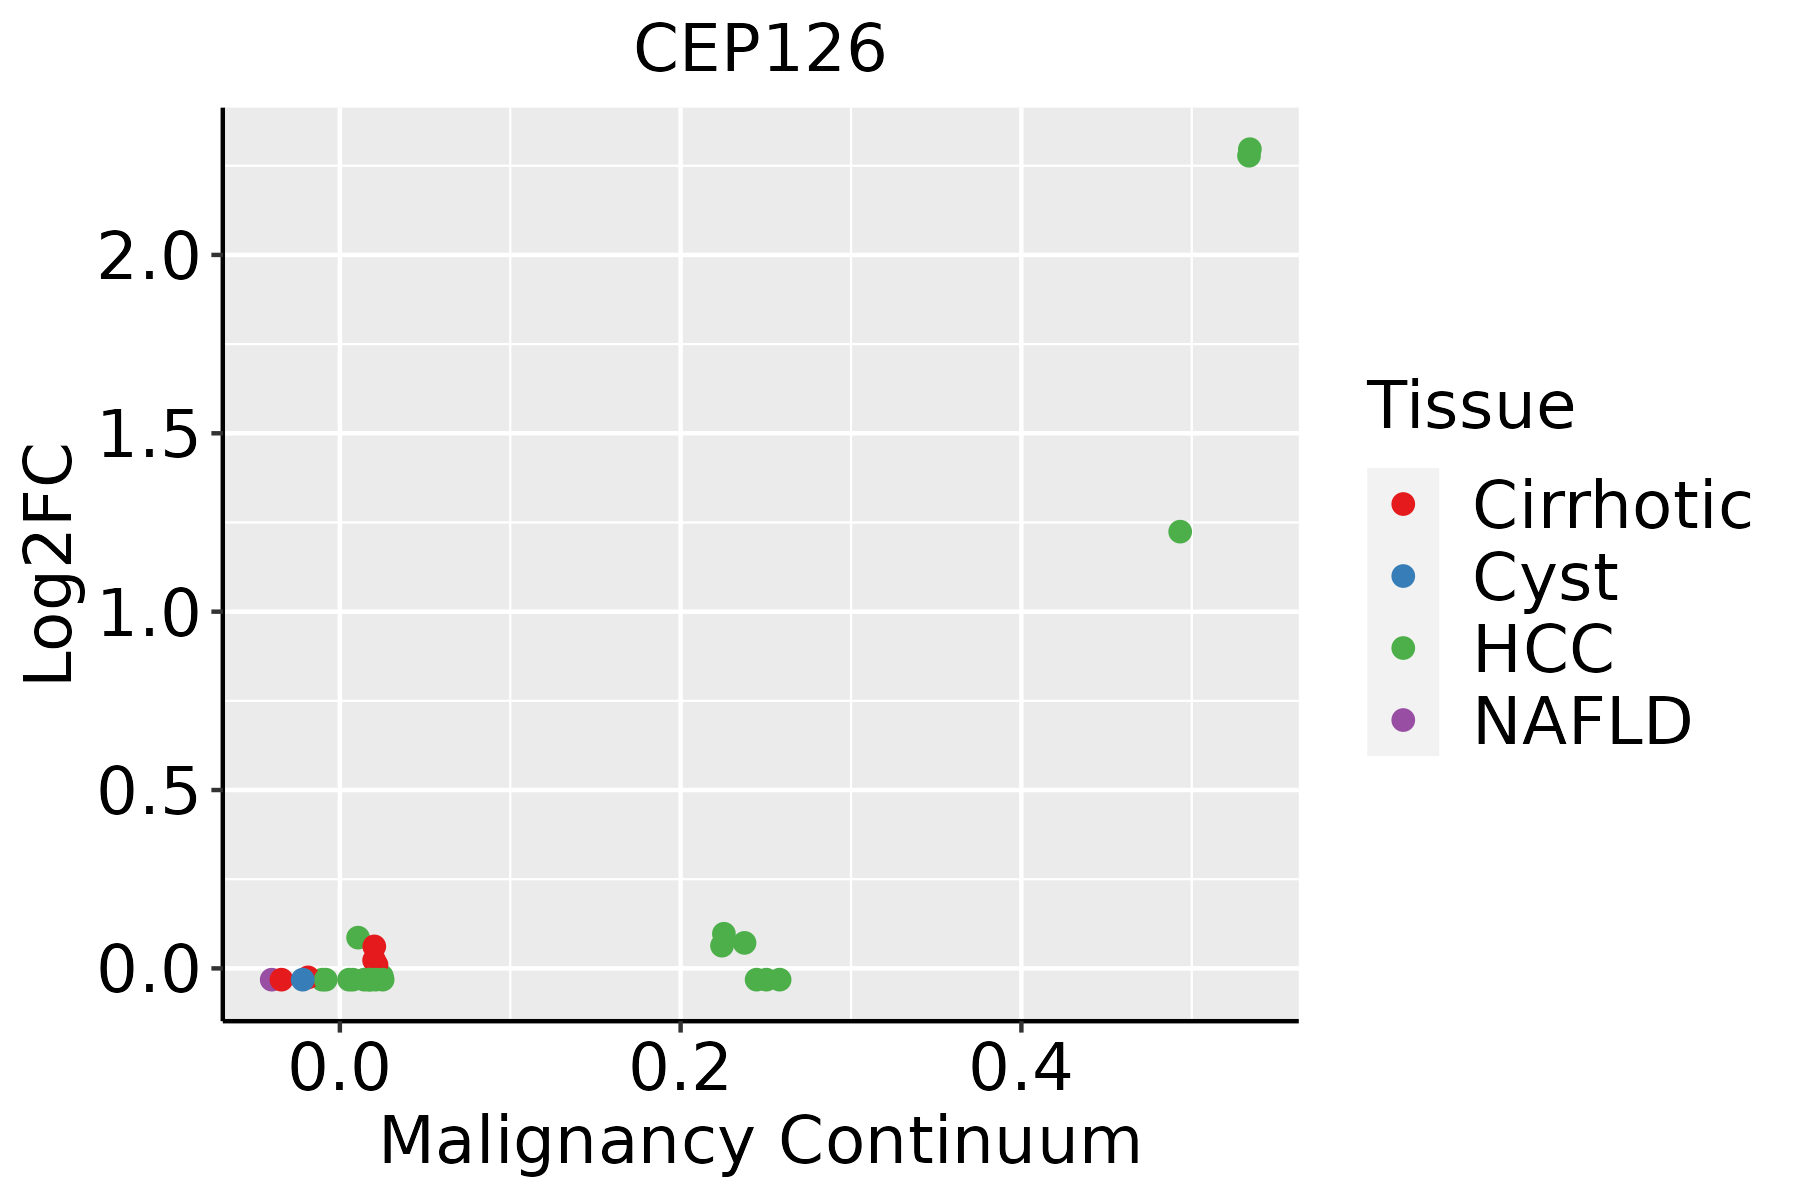 | HCC: Hepatocellular carcinoma |
| NAFLD: Non-alcoholic fatty liver disease | ||
| Thyroid |  | ATC: Anaplastic thyroid cancer |
| HT: Hashimoto's thyroiditis | ||
| PTC: Papillary thyroid cancer |
| ∗log2FC in expression of this searched gene in stem-like cells from each diseased tissue sample relative to stem-like cells in normal samples in each tissue plotted against the malignancy continuum. Samples are colored based on if they are from different disease stage. |
Top |
Malignant transformation related pathway analysis |
| Find out the enriched GO biological processes and KEGG pathways involved in transition from healthy to precancer to cancer |
| Tissue | Disease Stage | Enriched GO biological Processes |
| Colorectum | AD |  |
| Colorectum | SER |  |
| Colorectum | MSS |  |
| Colorectum | MSI-H |  |
| Colorectum | FAP |  |
| ∗Top 15 enriched GO BP terms are showed in the bar plot of each disease state in each tissue. Each row represents a significant GO biological process which is colored according to the -log10(p.adjust). |
| Page: 1 2 3 4 5 6 7 8 9 |
| GO ID | Tissue | Disease Stage | Description | Gene Ratio | Bg Ratio | pvalue | p.adjust | Count |
| GO:190285015 | Esophagus | ESCC | microtubule cytoskeleton organization involved in mitosis | 116/8552 | 147/18723 | 1.25e-16 | 9.91e-15 | 116 |
| GO:000705214 | Esophagus | ESCC | mitotic spindle organization | 97/8552 | 120/18723 | 2.17e-15 | 1.33e-13 | 97 |
| GO:000705114 | Esophagus | ESCC | spindle organization | 134/8552 | 184/18723 | 5.70e-14 | 2.87e-12 | 134 |
| GO:00311227 | Esophagus | ESCC | cytoplasmic microtubule organization | 38/8552 | 56/18723 | 6.60e-04 | 3.50e-03 | 38 |
| GO:19055153 | Esophagus | ESCC | non-motile cilium assembly | 39/8552 | 61/18723 | 3.08e-03 | 1.28e-02 | 39 |
| GO:000705111 | Liver | HCC | spindle organization | 116/7958 | 184/18723 | 1.40e-08 | 3.40e-07 | 116 |
| GO:000705211 | Liver | HCC | mitotic spindle organization | 80/7958 | 120/18723 | 7.43e-08 | 1.50e-06 | 80 |
| GO:190285011 | Liver | HCC | microtubule cytoskeleton organization involved in mitosis | 93/7958 | 147/18723 | 2.91e-07 | 5.09e-06 | 93 |
| GO:00311222 | Liver | HCC | cytoplasmic microtubule organization | 35/7958 | 56/18723 | 2.00e-03 | 1.01e-02 | 35 |
| GO:000705116 | Thyroid | PTC | spindle organization | 92/5968 | 184/18723 | 2.21e-07 | 3.92e-06 | 92 |
| GO:19028509 | Thyroid | PTC | microtubule cytoskeleton organization involved in mitosis | 76/5968 | 147/18723 | 4.49e-07 | 7.38e-06 | 76 |
| GO:000705216 | Thyroid | PTC | mitotic spindle organization | 64/5968 | 120/18723 | 8.69e-07 | 1.32e-05 | 64 |
| GO:00311229 | Thyroid | PTC | cytoplasmic microtubule organization | 34/5968 | 56/18723 | 8.20e-06 | 9.42e-05 | 34 |
| GO:190285017 | Thyroid | ATC | microtubule cytoskeleton organization involved in mitosis | 95/6293 | 147/18723 | 1.29e-14 | 7.62e-13 | 95 |
| GO:000705222 | Thyroid | ATC | mitotic spindle organization | 80/6293 | 120/18723 | 1.27e-13 | 6.46e-12 | 80 |
| GO:000705122 | Thyroid | ATC | spindle organization | 109/6293 | 184/18723 | 7.99e-13 | 3.46e-11 | 109 |
| GO:003112215 | Thyroid | ATC | cytoplasmic microtubule organization | 34/6293 | 56/18723 | 2.92e-05 | 2.45e-04 | 34 |
| Page: 1 |
| Pathway ID | Tissue | Disease Stage | Description | Gene Ratio | Bg Ratio | pvalue | p.adjust | qvalue | Count |
| Page: 1 |
Top |
Cell-cell communication analysis |
| Identification of potential cell-cell interactions between two cell types and their ligand-receptor pairs for different disease states |
| Ligand | Receptor | LRpair | Pathway | Tissue | Disease Stage |
| Page: 1 |
Top |
Single-cell gene regulatory network inference analysis |
| Find out the significant the regulons (TFs) and the target genes of each regulon across cell types for different disease states |
| TF | Cell Type | Tissue | Disease Stage | Target Gene | RSS | Regulon Activity |
| ∗The dot plots of a searched regulon are shown for all cell subpopulations in each disease state of each tissue based on the regulon specific score inferred using pySCENIC and by calculating the average expression. |
| Page: 1 |
Top |
Somatic mutation of malignant transformation related genes |
| Annotation of somatic variants for genes involved in malignant transformation |
| Hugo Symbol | Variant Class | Variant Classification | dbSNP RS | HGVSc | HGVSp | HGVSp Short | SWISSPROT | BIOTYPE | SIFT | PolyPhen | Tumor Sample Barcode | Tissue | Histology | Sex | Age | Stage | Therapy Types | Drugs | Outcome |
| CEP126 | SNV | Missense_Mutation | c.1640N>G | p.Ser547Cys | p.S547C | Q9P2H0 | protein_coding | tolerated(0.17) | benign(0.067) | TCGA-A2-A04T-01 | Breast | breast invasive carcinoma | Female | <65 | I/II | Chemotherapy | cyclophosphamide | SD | |
| CEP126 | SNV | Missense_Mutation | c.673N>A | p.Leu225Ile | p.L225I | Q9P2H0 | protein_coding | deleterious(0.01) | possibly_damaging(0.603) | TCGA-A8-A06U-01 | Breast | breast invasive carcinoma | Female | >=65 | I/II | Unknown | Unknown | SD | |
| CEP126 | SNV | Missense_Mutation | c.1314N>T | p.Glu438Asp | p.E438D | Q9P2H0 | protein_coding | tolerated(0.24) | benign(0.022) | TCGA-AN-A046-01 | Breast | breast invasive carcinoma | Female | >=65 | I/II | Unknown | Unknown | SD | |
| CEP126 | SNV | Missense_Mutation | novel | c.1555N>C | p.Ser519Pro | p.S519P | Q9P2H0 | protein_coding | tolerated(0.1) | benign(0.315) | TCGA-AN-A046-01 | Breast | breast invasive carcinoma | Female | >=65 | I/II | Unknown | Unknown | SD |
| CEP126 | SNV | Missense_Mutation | c.2078N>A | p.Ser693Tyr | p.S693Y | Q9P2H0 | protein_coding | tolerated(0.73) | benign(0.029) | TCGA-AN-A046-01 | Breast | breast invasive carcinoma | Female | >=65 | I/II | Unknown | Unknown | SD | |
| CEP126 | SNV | Missense_Mutation | novel | c.2595N>G | p.Cys865Trp | p.C865W | Q9P2H0 | protein_coding | deleterious(0.02) | possibly_damaging(0.689) | TCGA-AN-A046-01 | Breast | breast invasive carcinoma | Female | >=65 | I/II | Unknown | Unknown | SD |
| CEP126 | SNV | Missense_Mutation | novel | c.3266N>T | p.Lys1089Ile | p.K1089I | Q9P2H0 | protein_coding | deleterious(0) | probably_damaging(0.991) | TCGA-AN-A046-01 | Breast | breast invasive carcinoma | Female | >=65 | I/II | Unknown | Unknown | SD |
| CEP126 | SNV | Missense_Mutation | c.499N>C | p.Asn167His | p.N167H | Q9P2H0 | protein_coding | deleterious(0.02) | benign(0.152) | TCGA-AO-A12F-01 | Breast | breast invasive carcinoma | Female | <65 | I/II | Chemotherapy | paclitaxel | SD | |
| CEP126 | SNV | Missense_Mutation | novel | c.1217N>T | p.Arg406Ile | p.R406I | Q9P2H0 | protein_coding | deleterious(0.01) | possibly_damaging(0.718) | TCGA-BH-A0DL-01 | Breast | breast invasive carcinoma | Female | <65 | I/II | Chemotherapy | cytoxan | CR |
| CEP126 | SNV | Missense_Mutation | novel | c.1870N>G | p.Pro624Ala | p.P624A | Q9P2H0 | protein_coding | tolerated(0.21) | benign(0.121) | TCGA-BH-A2L8-01 | Breast | breast invasive carcinoma | Female | <65 | I/II | Chemotherapy | cytoxan | CR |
| Page: 1 2 3 4 5 6 7 8 9 10 11 12 13 14 |
Top |
Related drugs of malignant transformation related genes |
| Identification of chemicals and drugs interact with genes involved in malignant transfromation |
| (DGIdb 4.0) |
| Entrez ID | Symbol | Category | Interaction Types | Drug Claim Name | Drug Name | PMIDs |
| Page: 1 |

Copyright 2023-Present -The University of Texas Health Science Center at Houston |