
|
|||||
|
 | |
| |
| |
| |
| |
| |
|
Gene: CEP112 |
Gene summary for CEP112 |
| Gene information | Species | Human | Gene symbol | CEP112 | Gene ID | 201134 |
| Gene name | centrosomal protein 112 | |
| Gene Alias | CCDC46 | |
| Cytomap | 17q24.1 | |
| Gene Type | protein-coding | GO ID | GO:0008150 | UniProtAcc | Q8N8E3 |
Top |
Malignant transformation analysis |
| Identification of the aberrant gene expression in precancerous and cancerous lesions by comparing the gene expression of stem-like cells in diseased tissues with normal stem cells |
| Entrez ID | Symbol | Replicates | Species | Organ | Tissue | Adj P-value | Log2FC | Malignancy |
| 201134 | CEP112 | HCC1_Meng | Human | Liver | HCC | 8.11e-05 | -5.17e-02 | 0.0246 |
| 201134 | CEP112 | HCC2 | Human | Liver | HCC | 1.51e-03 | 3.14e+00 | 0.5341 |
| 201134 | CEP112 | S014 | Human | Liver | HCC | 1.43e-10 | 7.49e-01 | 0.2254 |
| 201134 | CEP112 | S015 | Human | Liver | HCC | 3.79e-04 | 3.59e-01 | 0.2375 |
| 201134 | CEP112 | S016 | Human | Liver | HCC | 7.81e-24 | 1.13e+00 | 0.2243 |
| 201134 | CEP112 | RNA-P23T2-P23T2-4 | Human | Lung | MIAC | 4.26e-02 | 8.01e-01 | -0.0272 |
| 201134 | CEP112 | RNA-P25T1-P25T1-1 | Human | Lung | AIS | 1.03e-18 | 8.47e-01 | -0.2116 |
| 201134 | CEP112 | RNA-P25T1-P25T1-2 | Human | Lung | AIS | 2.67e-04 | 6.43e-01 | -0.1941 |
| 201134 | CEP112 | RNA-P25T1-P25T1-3 | Human | Lung | AIS | 2.72e-12 | 8.21e-01 | -0.2107 |
| 201134 | CEP112 | RNA-P25T1-P25T1-4 | Human | Lung | AIS | 2.07e-09 | 6.18e-01 | -0.2119 |
| 201134 | CEP112 | RNA-P3T-P3T-1 | Human | Lung | IAC | 1.59e-05 | 5.90e-01 | 0.1829 |
| 201134 | CEP112 | RNA-P3T-P3T-2 | Human | Lung | IAC | 1.51e-02 | 4.38e-01 | 0.1835 |
| 201134 | CEP112 | RNA-P3T-P3T-4 | Human | Lung | IAC | 2.21e-03 | 4.00e-01 | 0.1859 |
| 201134 | CEP112 | RNA-P6T2-P6T2-1 | Human | Lung | IAC | 6.39e-30 | 8.39e-01 | -0.0166 |
| 201134 | CEP112 | RNA-P6T2-P6T2-2 | Human | Lung | IAC | 1.18e-31 | 8.68e-01 | -0.0132 |
| 201134 | CEP112 | RNA-P6T2-P6T2-3 | Human | Lung | IAC | 1.04e-33 | 8.25e-01 | -0.013 |
| 201134 | CEP112 | RNA-P6T2-P6T2-4 | Human | Lung | IAC | 1.52e-31 | 8.67e-01 | -0.0121 |
| 201134 | CEP112 | RNA-P7T1-P7T1-1 | Human | Lung | AIS | 1.92e-04 | 4.93e-01 | -0.0961 |
| 201134 | CEP112 | RNA-P7T1-P7T1-2 | Human | Lung | AIS | 1.42e-08 | 6.59e-01 | -0.0876 |
| 201134 | CEP112 | RNA-P7T1-P7T1-3 | Human | Lung | AIS | 9.26e-07 | 6.25e-01 | -0.0822 |
| Page: 1 2 |
| Tissue | Expression Dynamics | Abbreviation |
| Liver | 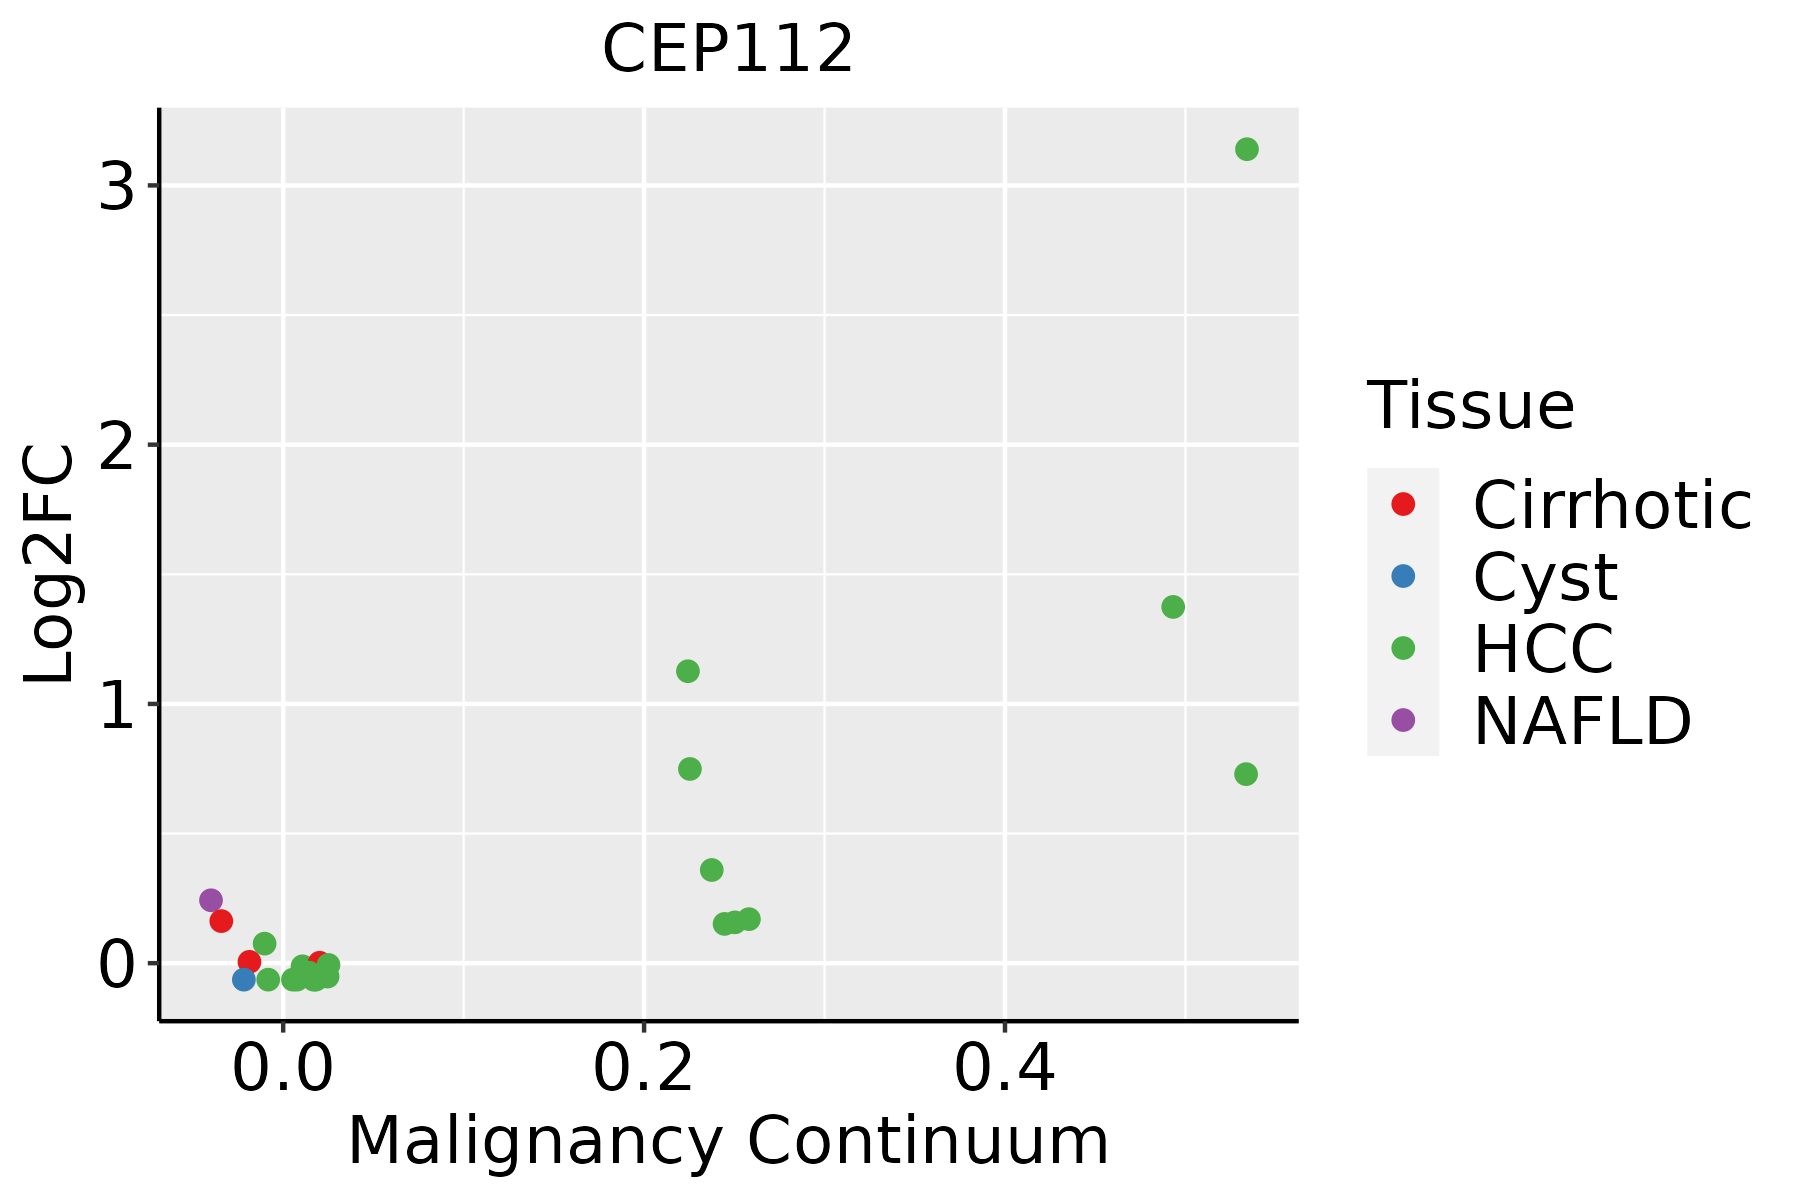 | HCC: Hepatocellular carcinoma |
| NAFLD: Non-alcoholic fatty liver disease | ||
| Lung |  | AAH: Atypical adenomatous hyperplasia |
| AIS: Adenocarcinoma in situ | ||
| IAC: Invasive lung adenocarcinoma | ||
| MIA: Minimally invasive adenocarcinoma | ||
| Thyroid | 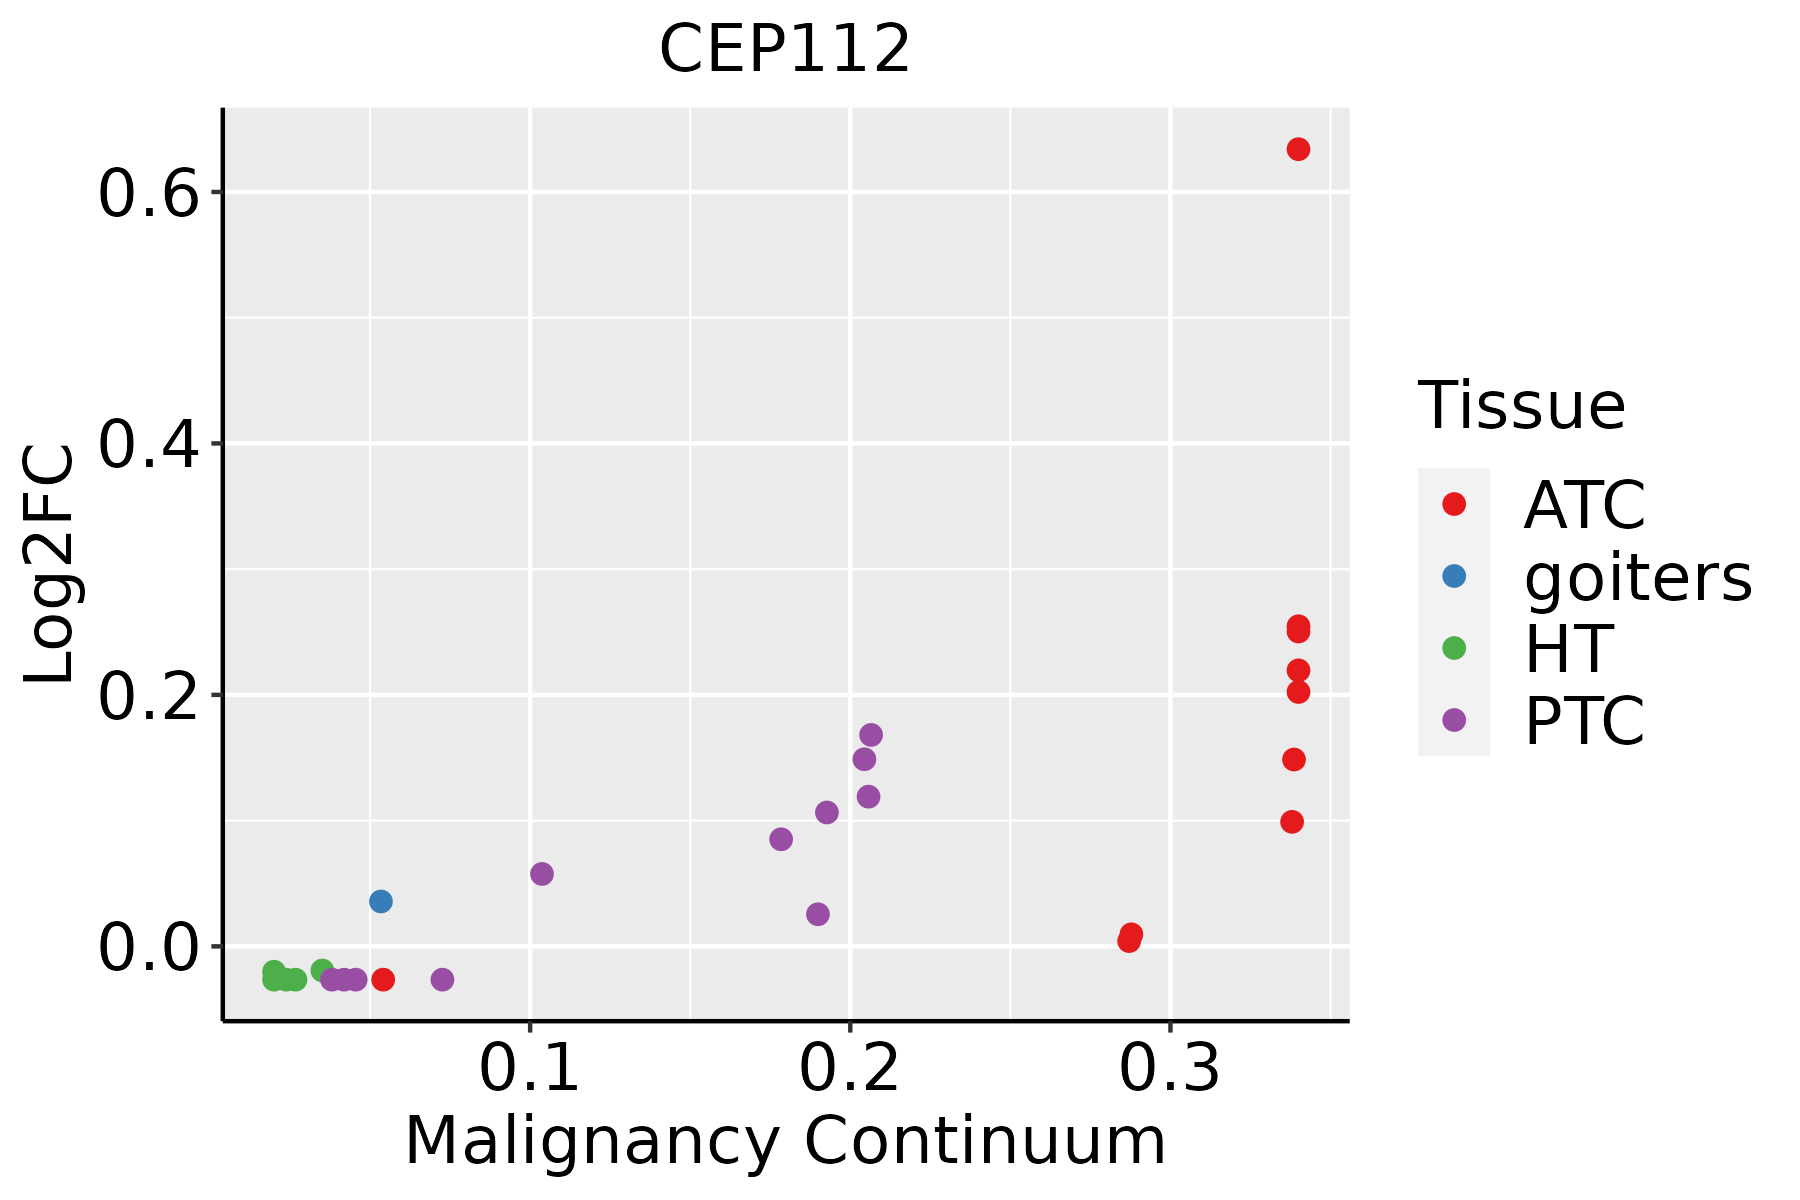 | ATC: Anaplastic thyroid cancer |
| HT: Hashimoto's thyroiditis | ||
| PTC: Papillary thyroid cancer |
| ∗log2FC in expression of this searched gene in stem-like cells from each diseased tissue sample relative to stem-like cells in normal samples in each tissue plotted against the malignancy continuum. Samples are colored based on if they are from different disease stage. |
Top |
Malignant transformation related pathway analysis |
| Find out the enriched GO biological processes and KEGG pathways involved in transition from healthy to precancer to cancer |
| Tissue | Disease Stage | Enriched GO biological Processes |
| Colorectum | AD |  |
| Colorectum | SER |  |
| Colorectum | MSS |  |
| Colorectum | MSI-H |  |
| Colorectum | FAP |  |
| ∗Top 15 enriched GO BP terms are showed in the bar plot of each disease state in each tissue. Each row represents a significant GO biological process which is colored according to the -log10(p.adjust). |
| Page: 1 2 3 4 5 6 7 8 9 |
| GO ID | Tissue | Disease Stage | Description | Gene Ratio | Bg Ratio | pvalue | p.adjust | Count |
| GO:00315031 | Liver | HCC | protein-containing complex localization | 129/7958 | 220/18723 | 9.38e-07 | 1.42e-05 | 129 |
| GO:00315032 | Lung | IAC | protein-containing complex localization | 42/2061 | 220/18723 | 2.60e-04 | 4.32e-03 | 42 |
| GO:003150311 | Lung | AIS | protein-containing complex localization | 39/1849 | 220/18723 | 2.24e-04 | 4.51e-03 | 39 |
| GO:00315037 | Thyroid | PTC | protein-containing complex localization | 107/5968 | 220/18723 | 1.47e-07 | 2.82e-06 | 107 |
| GO:003150316 | Thyroid | ATC | protein-containing complex localization | 108/6293 | 220/18723 | 1.33e-06 | 1.69e-05 | 108 |
| Page: 1 |
| Pathway ID | Tissue | Disease Stage | Description | Gene Ratio | Bg Ratio | pvalue | p.adjust | qvalue | Count |
| Page: 1 |
Top |
Cell-cell communication analysis |
| Identification of potential cell-cell interactions between two cell types and their ligand-receptor pairs for different disease states |
| Ligand | Receptor | LRpair | Pathway | Tissue | Disease Stage |
| Page: 1 |
Top |
Single-cell gene regulatory network inference analysis |
| Find out the significant the regulons (TFs) and the target genes of each regulon across cell types for different disease states |
| TF | Cell Type | Tissue | Disease Stage | Target Gene | RSS | Regulon Activity |
| ∗The dot plots of a searched regulon are shown for all cell subpopulations in each disease state of each tissue based on the regulon specific score inferred using pySCENIC and by calculating the average expression. |
| Page: 1 |
Top |
Somatic mutation of malignant transformation related genes |
| Annotation of somatic variants for genes involved in malignant transformation |
| Hugo Symbol | Variant Class | Variant Classification | dbSNP RS | HGVSc | HGVSp | HGVSp Short | SWISSPROT | BIOTYPE | SIFT | PolyPhen | Tumor Sample Barcode | Tissue | Histology | Sex | Age | Stage | Therapy Types | Drugs | Outcome |
| CEP112 | SNV | Missense_Mutation | novel | c.2309N>G | p.Val770Gly | p.V770G | Q8N8E3 | protein_coding | deleterious(0) | benign(0.264) | TCGA-A2-A0T2-01 | Breast | breast invasive carcinoma | Female | >=65 | III/IV | Chemotherapy | xeloda | PD |
| CEP112 | SNV | Missense_Mutation | novel | c.2309T>G | p.Val770Gly | p.V770G | Q8N8E3 | protein_coding | deleterious(0) | benign(0.264) | TCGA-A8-A07G-01 | Breast | breast invasive carcinoma | Female | >=65 | I/II | Chemotherapy | 5-fluorouracil | CR |
| CEP112 | SNV | Missense_Mutation | c.1453N>C | p.Asp485His | p.D485H | Q8N8E3 | protein_coding | deleterious(0) | possibly_damaging(0.673) | TCGA-A8-A08R-01 | Breast | breast invasive carcinoma | Female | <65 | I/II | Unknown | Unknown | SD | |
| CEP112 | SNV | Missense_Mutation | c.721N>G | p.Ser241Gly | p.S241G | Q8N8E3 | protein_coding | tolerated(0.09) | benign(0) | TCGA-A8-A094-01 | Breast | breast invasive carcinoma | Female | >=65 | I/II | Unknown | Unknown | SD | |
| CEP112 | SNV | Missense_Mutation | rs374657590 | c.2164N>T | p.Val722Phe | p.V722F | Q8N8E3 | protein_coding | deleterious(0.01) | possibly_damaging(0.595) | TCGA-A8-A0AD-01 | Breast | breast invasive carcinoma | Female | >=65 | I/II | Hormone Therapy | tamoxiphen | SD |
| CEP112 | SNV | Missense_Mutation | c.229N>A | p.Gly77Ser | p.G77S | Q8N8E3 | protein_coding | tolerated(0.09) | possibly_damaging(0.713) | TCGA-AC-A2FB-01 | Breast | breast invasive carcinoma | Female | >=65 | I/II | Chemotherapy | taxotere | CR | |
| CEP112 | SNV | Missense_Mutation | novel | c.1845N>T | p.Glu615Asp | p.E615D | Q8N8E3 | protein_coding | deleterious(0.04) | probably_damaging(0.996) | TCGA-AN-A046-01 | Breast | breast invasive carcinoma | Female | >=65 | I/II | Unknown | Unknown | SD |
| CEP112 | SNV | Missense_Mutation | c.1171N>T | p.Arg391Cys | p.R391C | Q8N8E3 | protein_coding | deleterious(0.01) | probably_damaging(0.999) | TCGA-AN-A046-01 | Breast | breast invasive carcinoma | Female | >=65 | I/II | Unknown | Unknown | SD | |
| CEP112 | SNV | Missense_Mutation | novel | c.653N>A | p.Pro218His | p.P218H | Q8N8E3 | protein_coding | deleterious(0) | probably_damaging(0.999) | TCGA-AN-A046-01 | Breast | breast invasive carcinoma | Female | >=65 | I/II | Unknown | Unknown | SD |
| CEP112 | SNV | Missense_Mutation | c.1324N>C | p.Glu442Gln | p.E442Q | Q8N8E3 | protein_coding | deleterious(0.04) | probably_damaging(0.975) | TCGA-BH-A18U-01 | Breast | breast invasive carcinoma | Female | >=65 | III/IV | Unknown | Unknown | SD |
| Page: 1 2 3 4 5 6 7 8 9 10 11 |
Top |
Related drugs of malignant transformation related genes |
| Identification of chemicals and drugs interact with genes involved in malignant transfromation |
| (DGIdb 4.0) |
| Entrez ID | Symbol | Category | Interaction Types | Drug Claim Name | Drug Name | PMIDs |
| Page: 1 |

Copyright 2023-Present -The University of Texas Health Science Center at Houston |