
|
|||||
|
 | |
| |
| |
| |
| |
| |
|
Gene: CEP104 |
Gene summary for CEP104 |
| Gene information | Species | Human | Gene symbol | CEP104 | Gene ID | 9731 |
| Gene name | centrosomal protein 104 | |
| Gene Alias | CFAP256 | |
| Cytomap | 1p36.32 | |
| Gene Type | protein-coding | GO ID | GO:0000922 | UniProtAcc | O60308 |
Top |
Malignant transformation analysis |
| Identification of the aberrant gene expression in precancerous and cancerous lesions by comparing the gene expression of stem-like cells in diseased tissues with normal stem cells |
| Entrez ID | Symbol | Replicates | Species | Organ | Tissue | Adj P-value | Log2FC | Malignancy |
| 9731 | CEP104 | LZE2T | Human | Esophagus | ESCC | 4.93e-06 | 4.18e-01 | 0.082 |
| 9731 | CEP104 | LZE4T | Human | Esophagus | ESCC | 2.81e-06 | 1.84e-01 | 0.0811 |
| 9731 | CEP104 | LZE7T | Human | Esophagus | ESCC | 3.70e-04 | 1.84e-01 | 0.0667 |
| 9731 | CEP104 | LZE20T | Human | Esophagus | ESCC | 1.68e-05 | 2.03e-01 | 0.0662 |
| 9731 | CEP104 | LZE22T | Human | Esophagus | ESCC | 5.36e-04 | 3.15e-01 | 0.068 |
| 9731 | CEP104 | LZE24T | Human | Esophagus | ESCC | 9.95e-16 | 4.20e-01 | 0.0596 |
| 9731 | CEP104 | P1T-E | Human | Esophagus | ESCC | 1.23e-03 | 3.17e-01 | 0.0875 |
| 9731 | CEP104 | P2T-E | Human | Esophagus | ESCC | 3.28e-31 | 5.46e-01 | 0.1177 |
| 9731 | CEP104 | P4T-E | Human | Esophagus | ESCC | 1.31e-27 | 6.20e-01 | 0.1323 |
| 9731 | CEP104 | P5T-E | Human | Esophagus | ESCC | 1.19e-12 | 2.22e-01 | 0.1327 |
| 9731 | CEP104 | P8T-E | Human | Esophagus | ESCC | 5.40e-25 | 4.79e-01 | 0.0889 |
| 9731 | CEP104 | P9T-E | Human | Esophagus | ESCC | 1.91e-08 | 2.05e-01 | 0.1131 |
| 9731 | CEP104 | P10T-E | Human | Esophagus | ESCC | 3.15e-23 | 4.85e-01 | 0.116 |
| 9731 | CEP104 | P11T-E | Human | Esophagus | ESCC | 5.20e-08 | 3.93e-01 | 0.1426 |
| 9731 | CEP104 | P12T-E | Human | Esophagus | ESCC | 2.40e-16 | 3.08e-01 | 0.1122 |
| 9731 | CEP104 | P15T-E | Human | Esophagus | ESCC | 1.65e-17 | 3.43e-01 | 0.1149 |
| 9731 | CEP104 | P16T-E | Human | Esophagus | ESCC | 3.39e-25 | 2.90e-01 | 0.1153 |
| 9731 | CEP104 | P17T-E | Human | Esophagus | ESCC | 2.19e-06 | 2.82e-01 | 0.1278 |
| 9731 | CEP104 | P19T-E | Human | Esophagus | ESCC | 1.38e-05 | 5.50e-01 | 0.1662 |
| 9731 | CEP104 | P20T-E | Human | Esophagus | ESCC | 2.63e-22 | 4.41e-01 | 0.1124 |
| Page: 1 2 3 4 5 |
| Tissue | Expression Dynamics | Abbreviation |
| Esophagus | 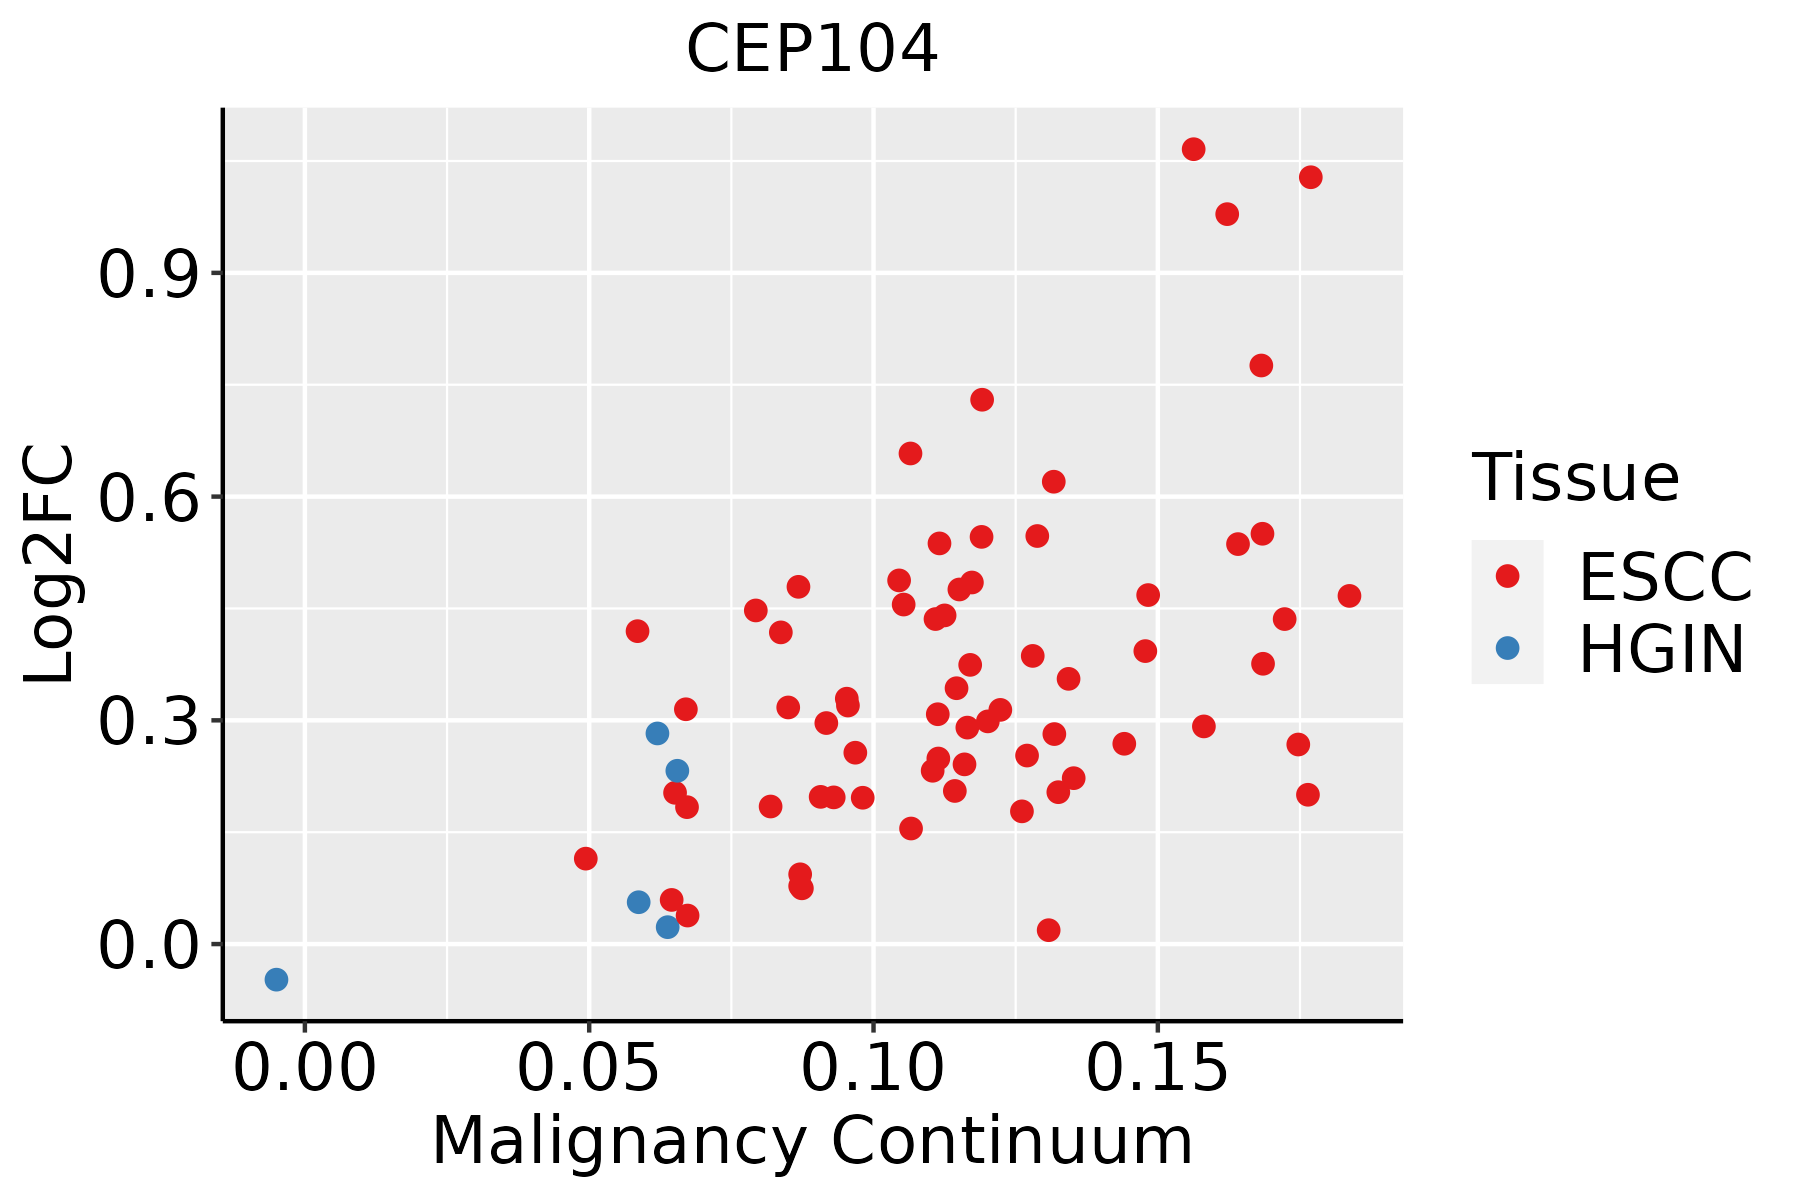 | ESCC: Esophageal squamous cell carcinoma |
| HGIN: High-grade intraepithelial neoplasias | ||
| LGIN: Low-grade intraepithelial neoplasias | ||
| Liver | 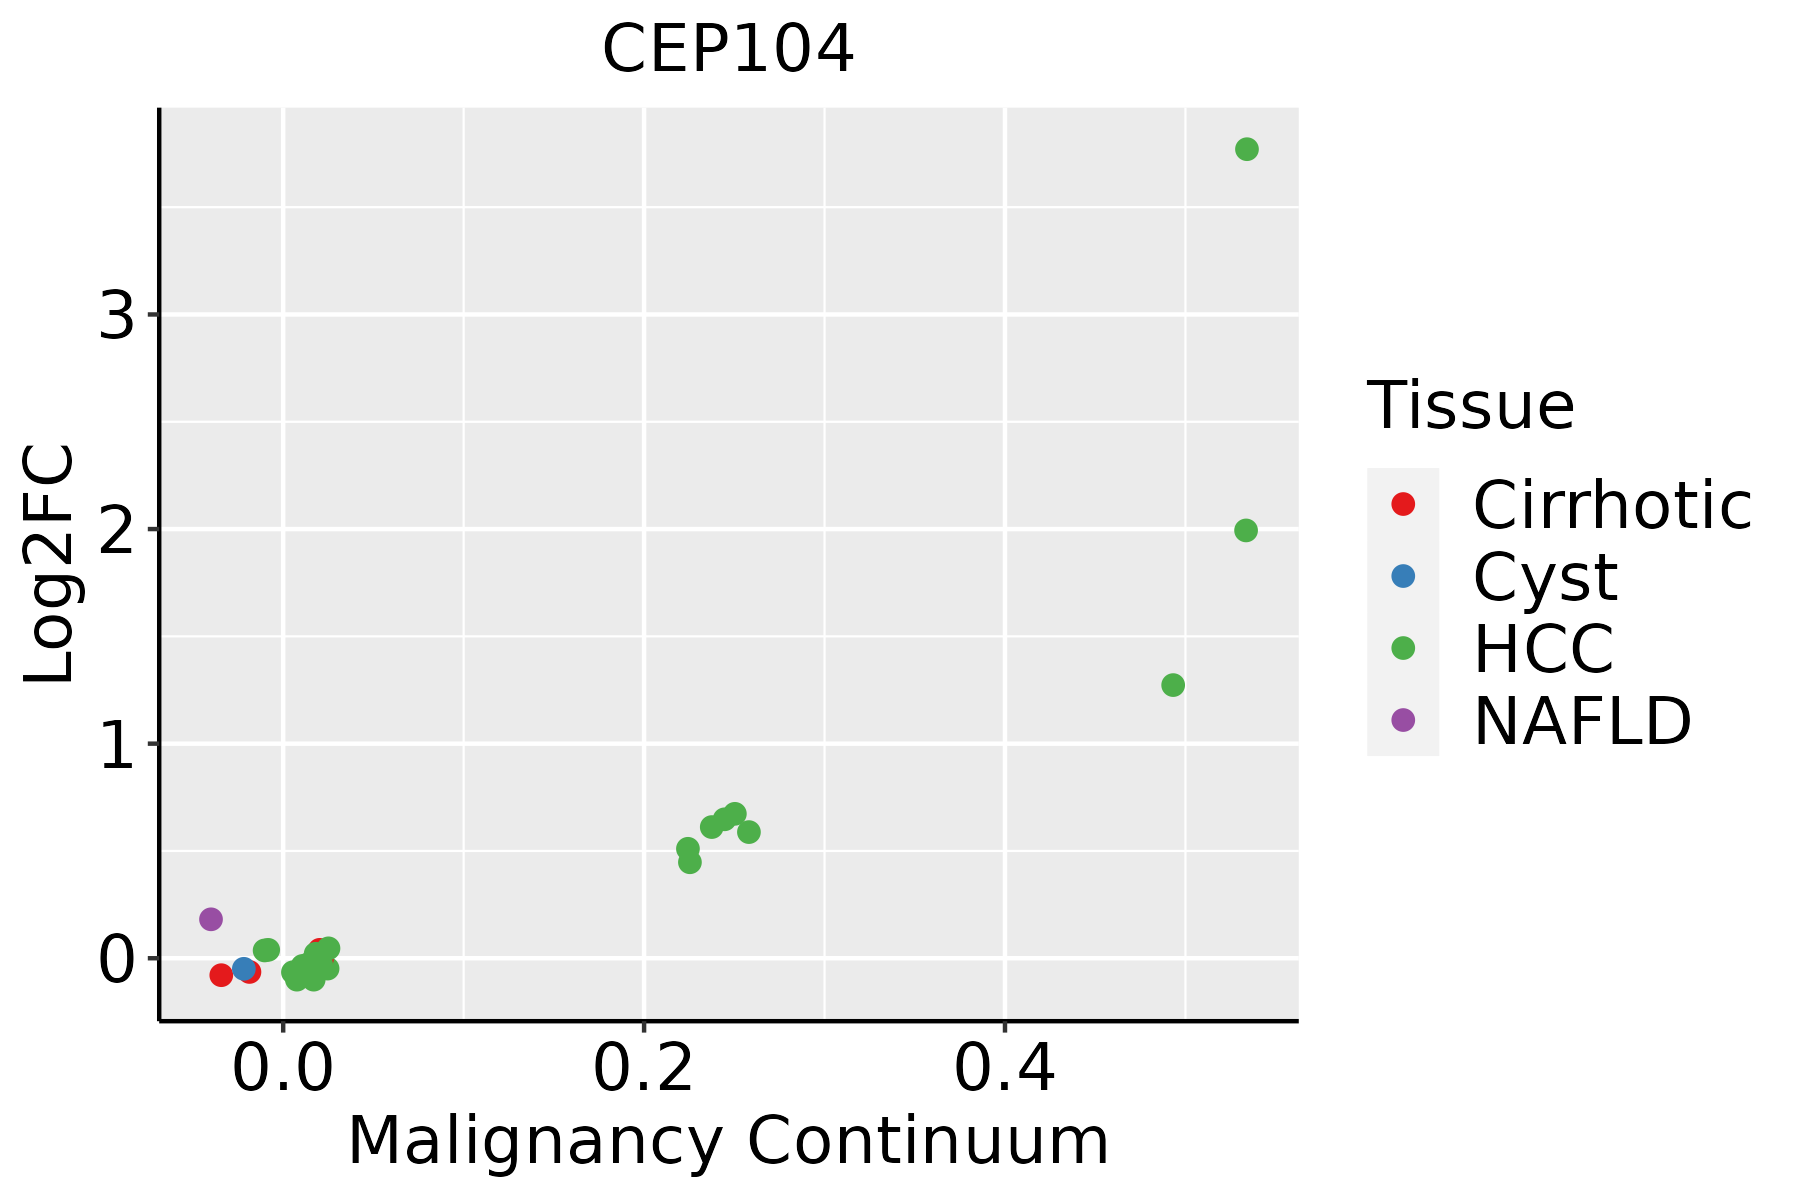 | HCC: Hepatocellular carcinoma |
| NAFLD: Non-alcoholic fatty liver disease | ||
| Oral Cavity | 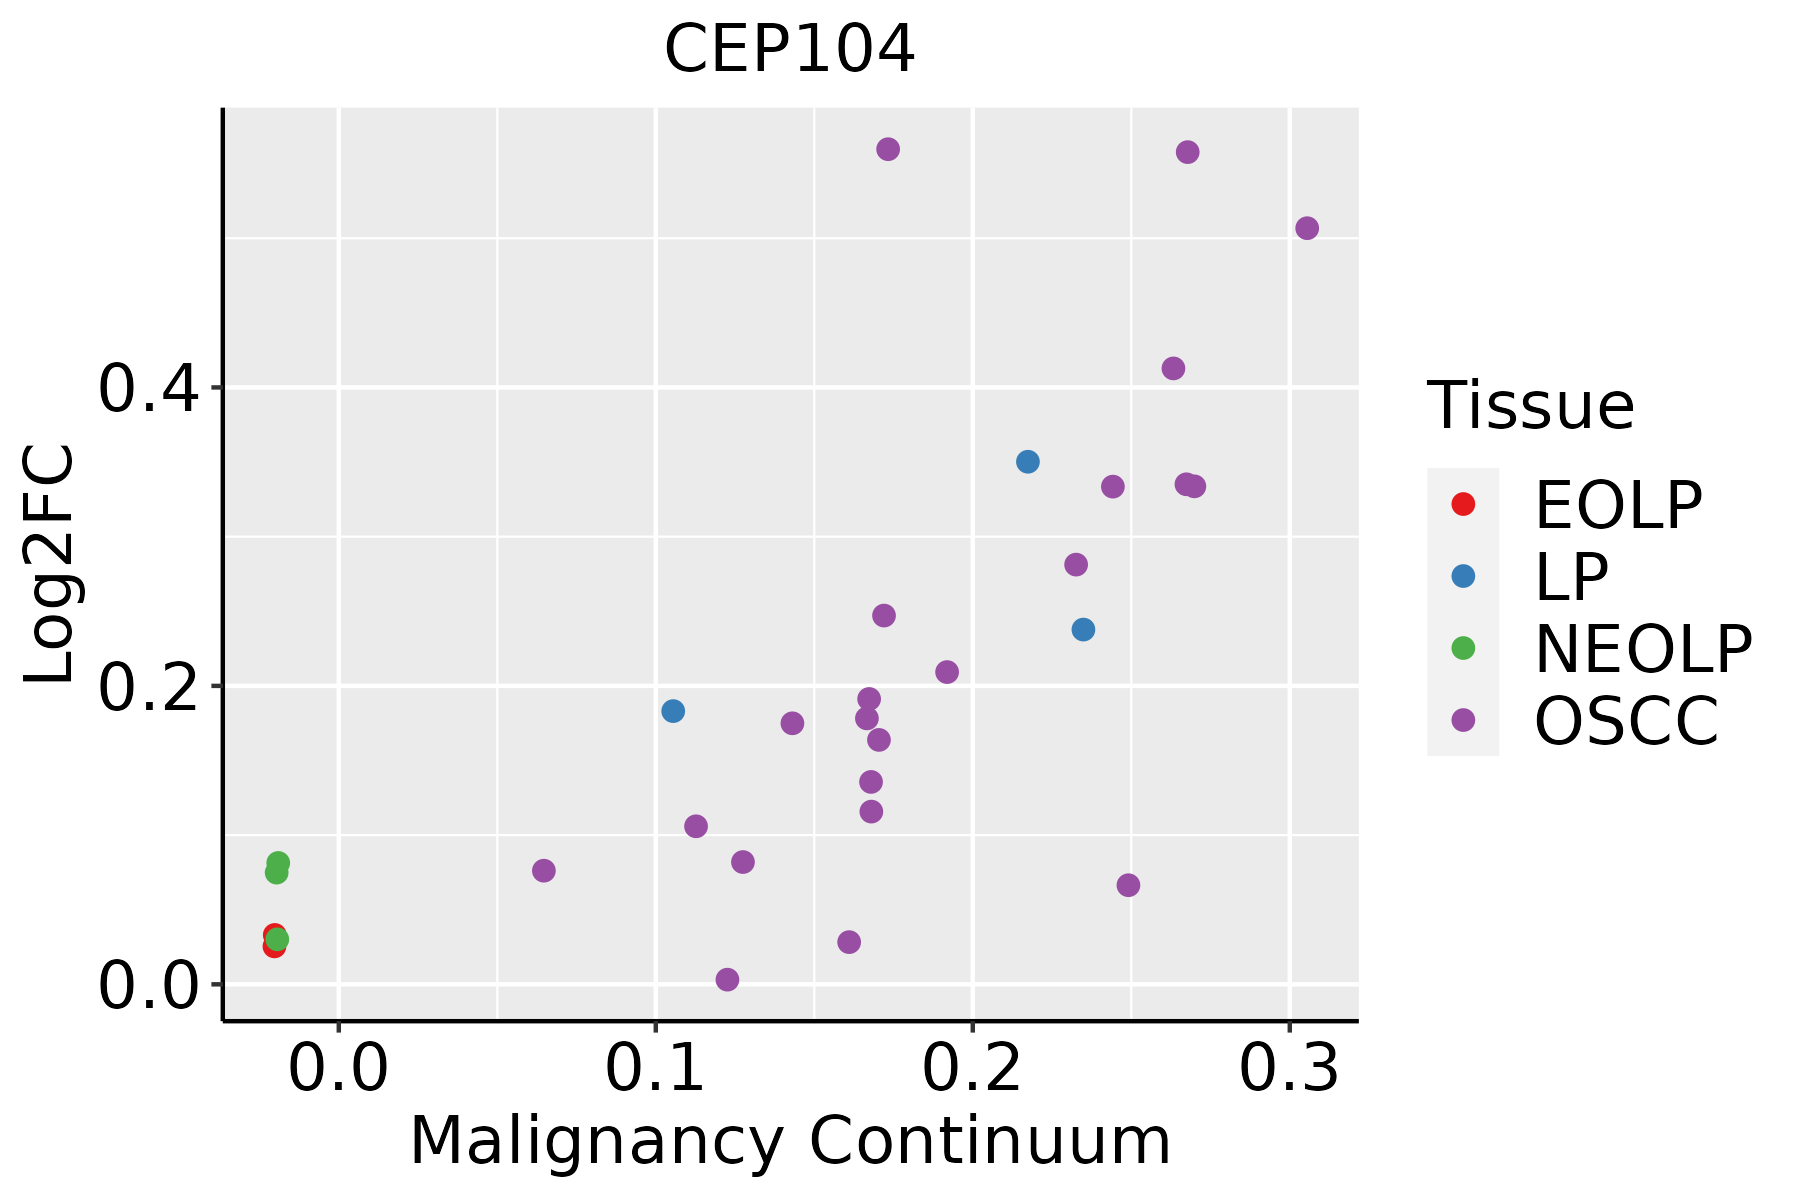 | EOLP: Erosive Oral lichen planus |
| LP: leukoplakia | ||
| NEOLP: Non-erosive oral lichen planus | ||
| OSCC: Oral squamous cell carcinoma | ||
| Skin | 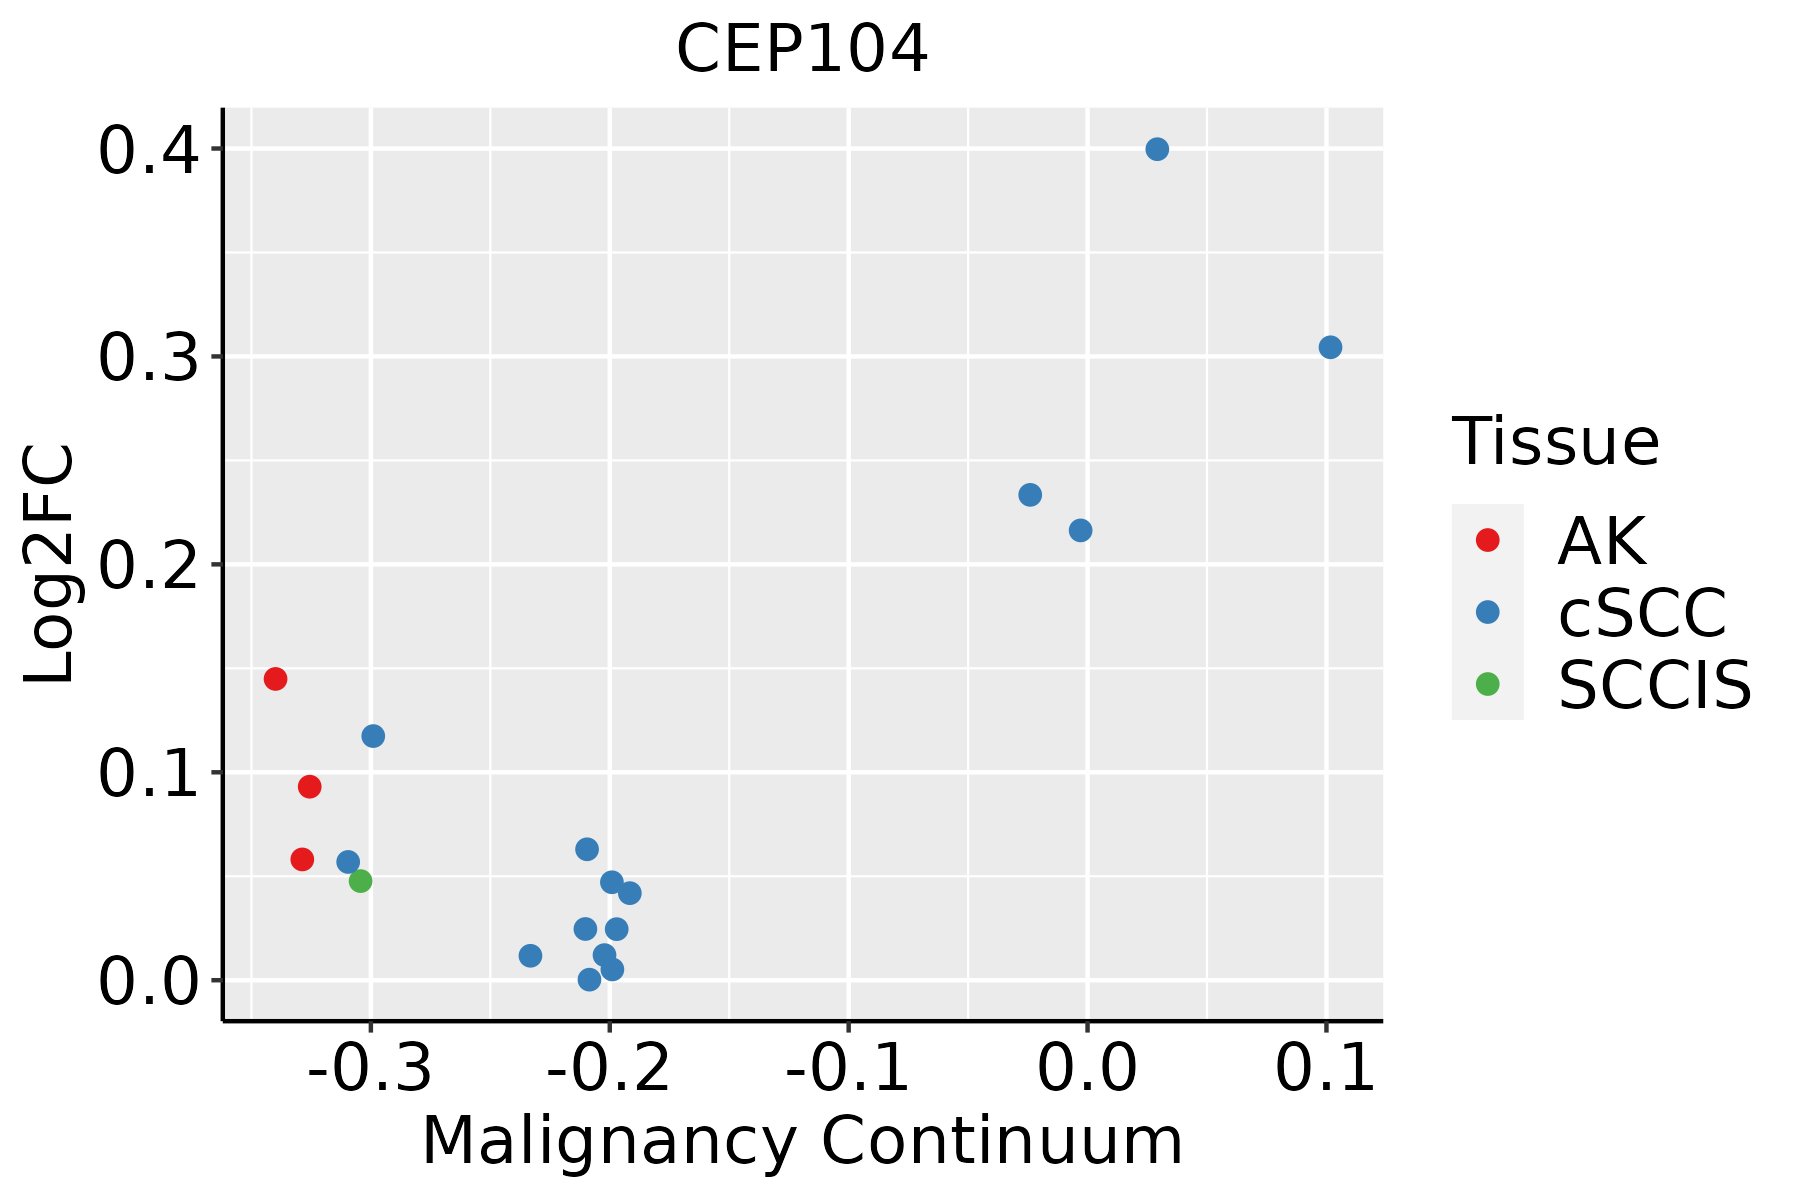 | AK: Actinic keratosis |
| cSCC: Cutaneous squamous cell carcinoma | ||
| SCCIS:squamous cell carcinoma in situ |
| ∗log2FC in expression of this searched gene in stem-like cells from each diseased tissue sample relative to stem-like cells in normal samples in each tissue plotted against the malignancy continuum. Samples are colored based on if they are from different disease stage. |
Top |
Malignant transformation related pathway analysis |
| Find out the enriched GO biological processes and KEGG pathways involved in transition from healthy to precancer to cancer |
| Tissue | Disease Stage | Enriched GO biological Processes |
| Colorectum | AD |  |
| Colorectum | SER |  |
| Colorectum | MSS |  |
| Colorectum | MSI-H |  |
| Colorectum | FAP |  |
| ∗Top 15 enriched GO BP terms are showed in the bar plot of each disease state in each tissue. Each row represents a significant GO biological process which is colored according to the -log10(p.adjust). |
| Page: 1 2 3 4 5 6 7 8 9 |
| GO ID | Tissue | Disease Stage | Description | Gene Ratio | Bg Ratio | pvalue | p.adjust | Count |
| Page: 1 |
| Pathway ID | Tissue | Disease Stage | Description | Gene Ratio | Bg Ratio | pvalue | p.adjust | qvalue | Count |
| Page: 1 |
Top |
Cell-cell communication analysis |
| Identification of potential cell-cell interactions between two cell types and their ligand-receptor pairs for different disease states |
| Ligand | Receptor | LRpair | Pathway | Tissue | Disease Stage |
| Page: 1 |
Top |
Single-cell gene regulatory network inference analysis |
| Find out the significant the regulons (TFs) and the target genes of each regulon across cell types for different disease states |
| TF | Cell Type | Tissue | Disease Stage | Target Gene | RSS | Regulon Activity |
| ∗The dot plots of a searched regulon are shown for all cell subpopulations in each disease state of each tissue based on the regulon specific score inferred using pySCENIC and by calculating the average expression. |
| Page: 1 |
Top |
Somatic mutation of malignant transformation related genes |
| Annotation of somatic variants for genes involved in malignant transformation |
| Hugo Symbol | Variant Class | Variant Classification | dbSNP RS | HGVSc | HGVSp | HGVSp Short | SWISSPROT | BIOTYPE | SIFT | PolyPhen | Tumor Sample Barcode | Tissue | Histology | Sex | Age | Stage | Therapy Types | Drugs | Outcome |
| CEP104 | SNV | Missense_Mutation | rs769805340 | c.1633N>T | p.Arg545Cys | p.R545C | O60308 | protein_coding | deleterious(0) | probably_damaging(0.998) | TCGA-A2-A0EN-01 | Breast | breast invasive carcinoma | Female | >=65 | I/II | Hormone Therapy | tamoxiphen | SD |
| CEP104 | SNV | Missense_Mutation | novel | c.2460N>G | p.Phe820Leu | p.F820L | O60308 | protein_coding | tolerated(0.96) | benign(0) | TCGA-AR-A2LE-01 | Breast | breast invasive carcinoma | Female | >=65 | I/II | Hormone Therapy | tamoxiphen | PD |
| CEP104 | SNV | Missense_Mutation | novel | c.2711N>A | p.Gly904Glu | p.G904E | O60308 | protein_coding | deleterious(0.01) | possibly_damaging(0.88) | TCGA-BH-A0B6-01 | Breast | breast invasive carcinoma | Female | <65 | I/II | Unknown | Unknown | SD |
| CEP104 | insertion | In_Frame_Ins | novel | c.3_4insAGG | p.Met1_Pro2insArg | p.M1_P2insR | O60308 | protein_coding | TCGA-A8-A085-01 | Breast | breast invasive carcinoma | Male | <65 | I/II | Hormone Therapy | tamoxiphen | SD | ||
| CEP104 | insertion | Frame_Shift_Ins | novel | c.1_2insGATGTGCAAATGTGGAGGAGAAGGAAGAGAAA | p.Met1? | p.M1? | O60308 | protein_coding | TCGA-A8-A085-01 | Breast | breast invasive carcinoma | Male | <65 | I/II | Hormone Therapy | tamoxiphen | SD | ||
| CEP104 | insertion | Nonsense_Mutation | novel | c.24_25insACTGTCTAACCATACTCCCTGATCACATGCTGGGCTGC | p.Val9ThrfsTer3 | p.V9Tfs*3 | O60308 | protein_coding | TCGA-BH-A0HL-01 | Breast | breast invasive carcinoma | Female | <65 | I/II | Chemotherapy | cyclophosphamide | SD | ||
| CEP104 | insertion | Frame_Shift_Ins | novel | c.2695_2696insGGACGGGGCGGGGCTTGGGC | p.Leu899TrpfsTer23 | p.L899Wfs*23 | O60308 | protein_coding | TCGA-LL-A5YP-01 | Breast | breast invasive carcinoma | Female | <65 | I/II | Chemotherapy | cytoxan | SD | ||
| CEP104 | SNV | Missense_Mutation | novel | c.557C>T | p.Thr186Met | p.T186M | O60308 | protein_coding | deleterious(0) | possibly_damaging(0.8) | TCGA-2W-A8YY-01 | Cervix | cervical & endocervical cancer | Female | <65 | I/II | Chemotherapy | cisplatin | CR |
| CEP104 | SNV | Missense_Mutation | c.1908G>T | p.Met636Ile | p.M636I | O60308 | protein_coding | deleterious(0.02) | benign(0.033) | TCGA-C5-A2LX-01 | Cervix | cervical & endocervical cancer | Female | <65 | I/II | Chemotherapy | cisplatin | SD | |
| CEP104 | SNV | Missense_Mutation | c.2131N>C | p.Glu711Gln | p.E711Q | O60308 | protein_coding | tolerated(0.14) | benign(0.117) | TCGA-DR-A0ZM-01 | Cervix | cervical & endocervical cancer | Female | <65 | III/IV | Unspecific | Cisplatin | SD |
| Page: 1 2 3 4 5 6 7 8 9 10 |
Top |
Related drugs of malignant transformation related genes |
| Identification of chemicals and drugs interact with genes involved in malignant transfromation |
| (DGIdb 4.0) |
| Entrez ID | Symbol | Category | Interaction Types | Drug Claim Name | Drug Name | PMIDs |
| Page: 1 |

Copyright 2023-Present -The University of Texas Health Science Center at Houston |