
|
|||||
|
 | |
| |
| |
| |
| |
| |
|
Gene: CENPX |
Gene summary for CENPX |
| Gene information | Species | Human | Gene symbol | CENPX | Gene ID | 201254 |
| Gene name | centromere protein X | |
| Gene Alias | CENP-X | |
| Cytomap | 17q25.3 | |
| Gene Type | protein-coding | GO ID | GO:0000003 | UniProtAcc | A8MT69 |
Top |
Malignant transformation analysis |
| Identification of the aberrant gene expression in precancerous and cancerous lesions by comparing the gene expression of stem-like cells in diseased tissues with normal stem cells |
| Entrez ID | Symbol | Replicates | Species | Organ | Tissue | Adj P-value | Log2FC | Malignancy |
| 201254 | CENPX | GSM4909281 | Human | Breast | IDC | 7.16e-12 | 4.37e-01 | 0.21 |
| 201254 | CENPX | GSM4909282 | Human | Breast | IDC | 2.87e-23 | 6.29e-01 | -0.0288 |
| 201254 | CENPX | GSM4909286 | Human | Breast | IDC | 2.22e-20 | 4.09e-01 | 0.1081 |
| 201254 | CENPX | GSM4909287 | Human | Breast | IDC | 7.80e-07 | 3.98e-01 | 0.2057 |
| 201254 | CENPX | GSM4909289 | Human | Breast | IDC | 2.95e-11 | 8.48e-01 | 0.1064 |
| 201254 | CENPX | GSM4909290 | Human | Breast | IDC | 3.36e-39 | 8.90e-01 | 0.2096 |
| 201254 | CENPX | GSM4909293 | Human | Breast | IDC | 3.73e-23 | 5.46e-01 | 0.1581 |
| 201254 | CENPX | GSM4909294 | Human | Breast | IDC | 3.93e-04 | 3.43e-01 | 0.2022 |
| 201254 | CENPX | GSM4909297 | Human | Breast | IDC | 7.47e-03 | -1.77e-02 | 0.1517 |
| 201254 | CENPX | GSM4909298 | Human | Breast | IDC | 6.11e-19 | 4.67e-01 | 0.1551 |
| 201254 | CENPX | GSM4909302 | Human | Breast | IDC | 3.36e-02 | 2.90e-01 | 0.1545 |
| 201254 | CENPX | GSM4909304 | Human | Breast | IDC | 1.09e-05 | 2.18e-01 | 0.1636 |
| 201254 | CENPX | GSM4909306 | Human | Breast | IDC | 1.11e-09 | 3.89e-01 | 0.1564 |
| 201254 | CENPX | GSM4909308 | Human | Breast | IDC | 5.94e-17 | 4.64e-01 | 0.158 |
| 201254 | CENPX | GSM4909311 | Human | Breast | IDC | 4.31e-14 | 2.05e-02 | 0.1534 |
| 201254 | CENPX | GSM4909312 | Human | Breast | IDC | 1.50e-04 | 1.96e-01 | 0.1552 |
| 201254 | CENPX | GSM4909317 | Human | Breast | IDC | 1.87e-16 | 5.03e-01 | 0.1355 |
| 201254 | CENPX | GSM4909318 | Human | Breast | IDC | 2.06e-05 | 6.66e-01 | 0.2031 |
| 201254 | CENPX | GSM4909319 | Human | Breast | IDC | 7.58e-34 | 5.73e-01 | 0.1563 |
| 201254 | CENPX | GSM4909320 | Human | Breast | IDC | 2.46e-25 | 9.78e-01 | 0.1575 |
| Page: 1 2 3 4 5 6 |
| Tissue | Expression Dynamics | Abbreviation |
| Breast | 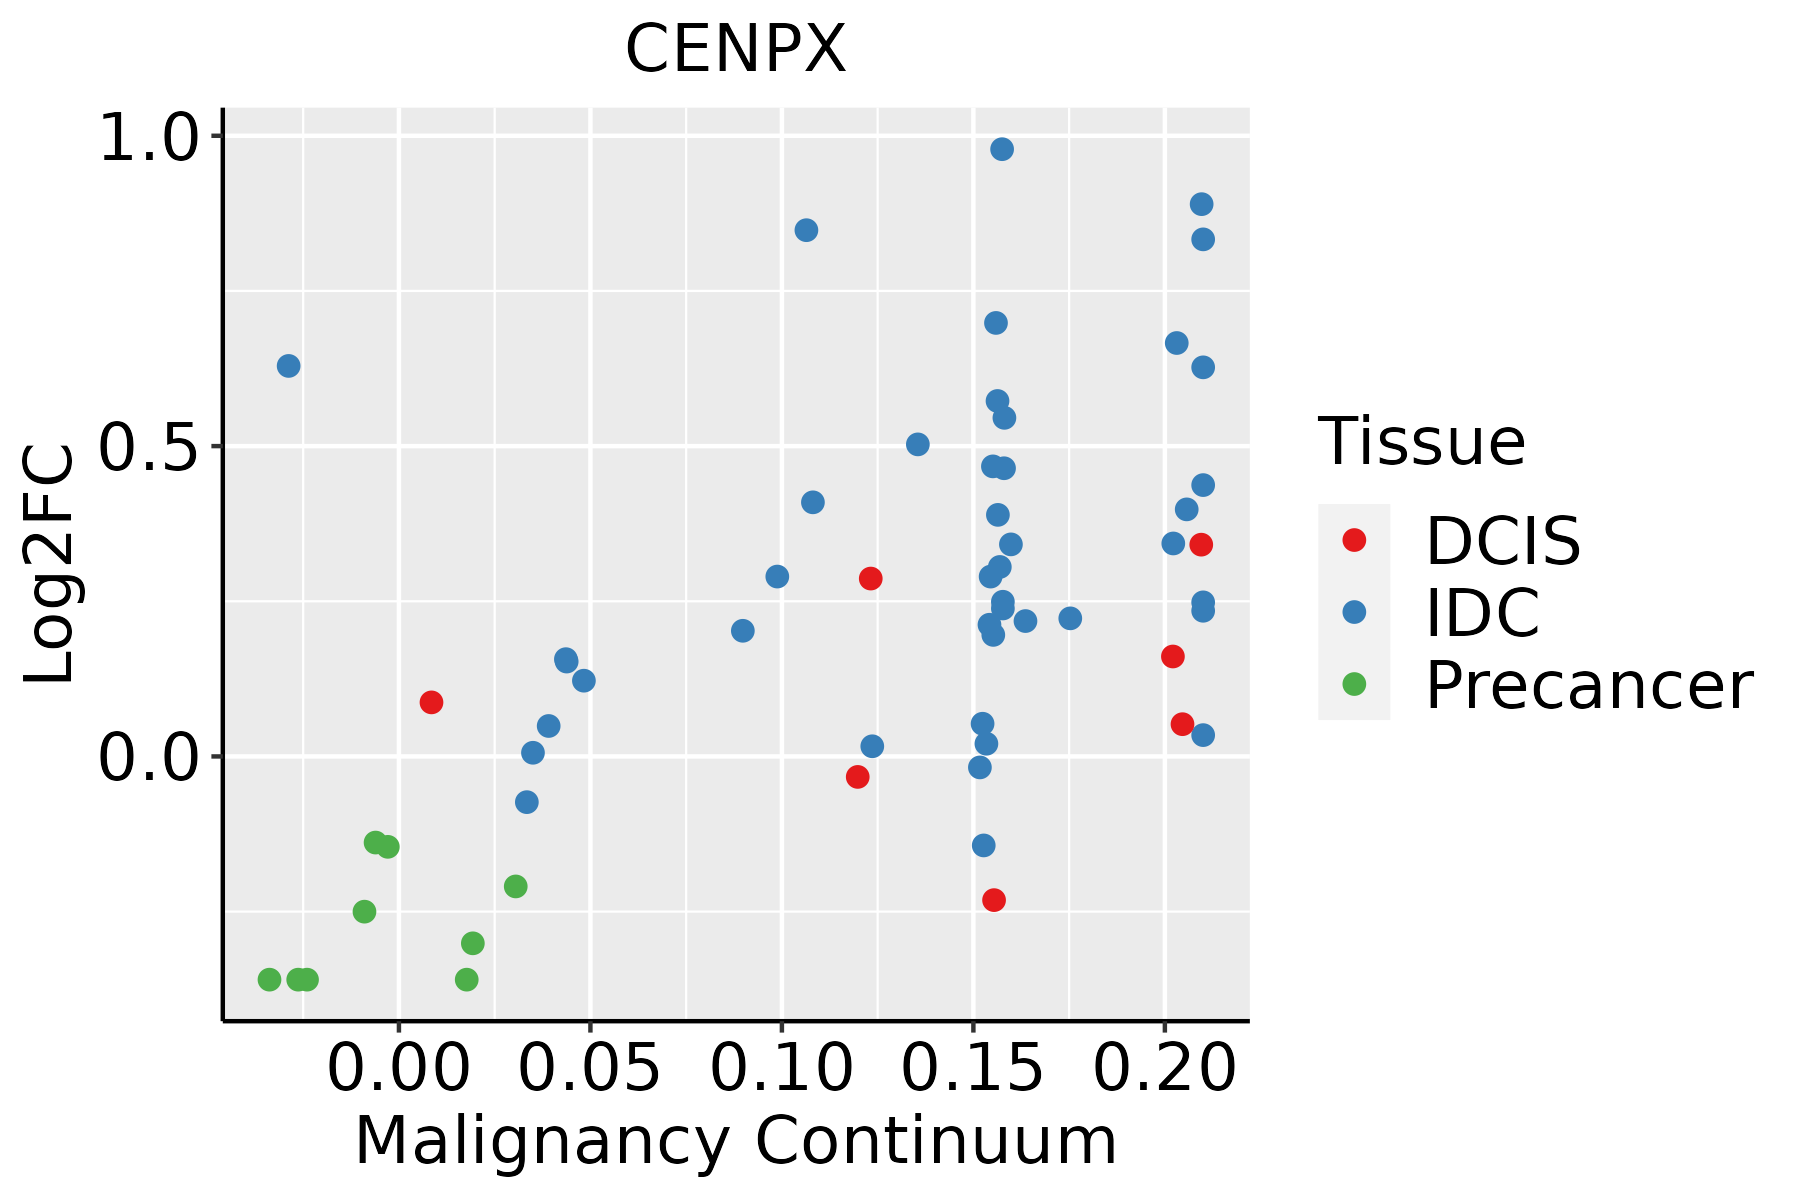 | IDC: Invasive ductal carcinoma |
| DCIS: Ductal carcinoma in situ | ||
| Precancer(BRCA1-mut): Precancerous lesion from BRCA1 mutation carriers | ||
| Colorectum (GSE201348) |  | FAP: Familial adenomatous polyposis |
| CRC: Colorectal cancer | ||
| Colorectum (HTA11) |  | AD: Adenomas |
| SER: Sessile serrated lesions | ||
| MSI-H: Microsatellite-high colorectal cancer | ||
| MSS: Microsatellite stable colorectal cancer | ||
| Esophagus | 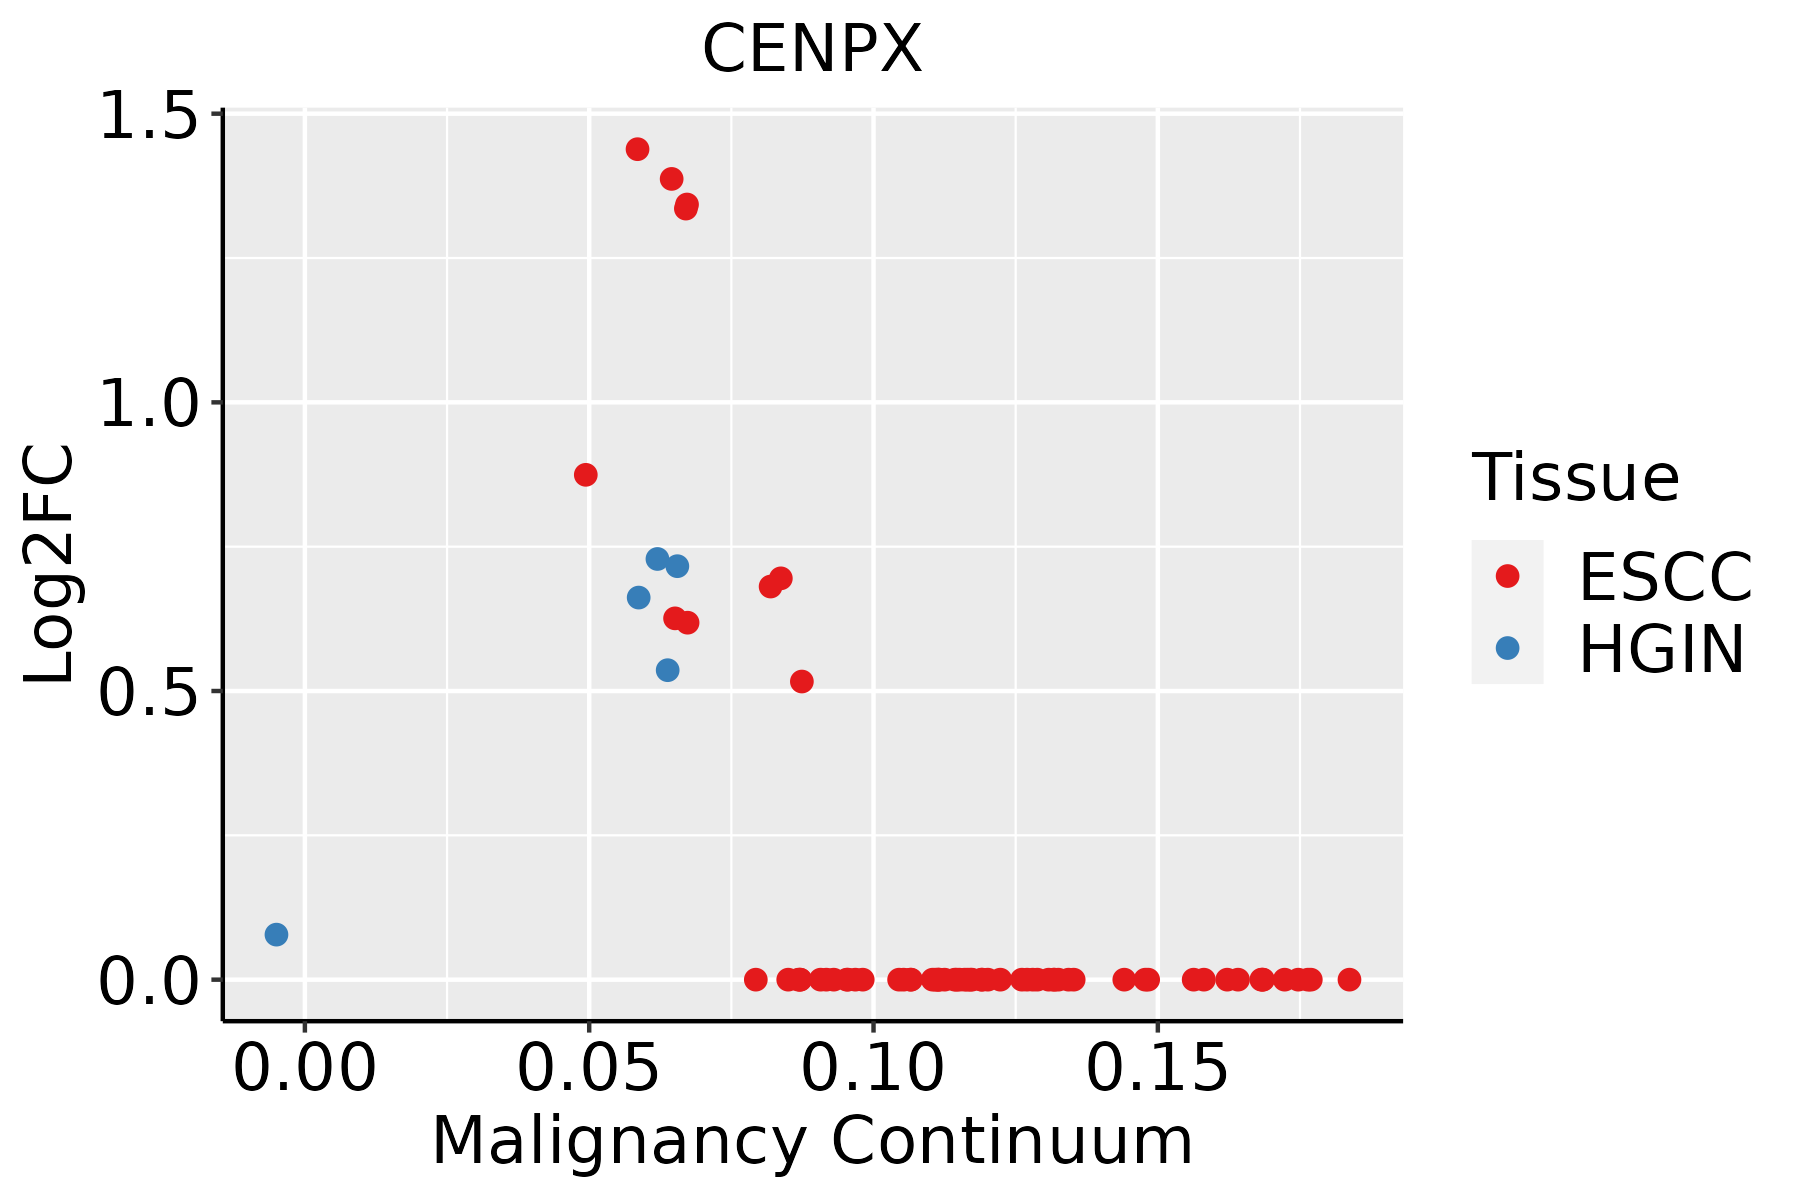 | ESCC: Esophageal squamous cell carcinoma |
| HGIN: High-grade intraepithelial neoplasias | ||
| LGIN: Low-grade intraepithelial neoplasias | ||
| GC |  | CAG: Chronic atrophic gastritis |
| CAG with IM: Chronic atrophic gastritis with intestinal metaplasia | ||
| CSG: Chronic superficial gastritis | ||
| GC: Gastric cancer | ||
| SIM: Severe intestinal metaplasia | ||
| WIM: Wild intestinal metaplasia | ||
| Liver |  | HCC: Hepatocellular carcinoma |
| NAFLD: Non-alcoholic fatty liver disease | ||
| Thyroid |  | ATC: Anaplastic thyroid cancer |
| HT: Hashimoto's thyroiditis | ||
| PTC: Papillary thyroid cancer |
| ∗log2FC in expression of this searched gene in stem-like cells from each diseased tissue sample relative to stem-like cells in normal samples in each tissue plotted against the malignancy continuum. Samples are colored based on if they are from different disease stage. |
Top |
Malignant transformation related pathway analysis |
| Find out the enriched GO biological processes and KEGG pathways involved in transition from healthy to precancer to cancer |
| Tissue | Disease Stage | Enriched GO biological Processes |
| Colorectum | AD |  |
| Colorectum | SER |  |
| Colorectum | MSS |  |
| Colorectum | MSI-H |  |
| Colorectum | FAP |  |
| ∗Top 15 enriched GO BP terms are showed in the bar plot of each disease state in each tissue. Each row represents a significant GO biological process which is colored according to the -log10(p.adjust). |
| Page: 1 2 3 4 5 6 7 8 9 |
| GO ID | Tissue | Disease Stage | Description | Gene Ratio | Bg Ratio | pvalue | p.adjust | Count |
| GO:19033209 | Breast | Precancer | regulation of protein modification by small protein conjugation or removal | 38/1080 | 242/18723 | 1.71e-08 | 1.17e-06 | 38 |
| GO:00313969 | Breast | Precancer | regulation of protein ubiquitination | 33/1080 | 210/18723 | 1.45e-07 | 7.82e-06 | 33 |
| GO:190332014 | Breast | IDC | regulation of protein modification by small protein conjugation or removal | 43/1434 | 242/18723 | 1.71e-07 | 9.16e-06 | 43 |
| GO:003139614 | Breast | IDC | regulation of protein ubiquitination | 37/1434 | 210/18723 | 1.50e-06 | 6.36e-05 | 37 |
| GO:190332024 | Breast | DCIS | regulation of protein modification by small protein conjugation or removal | 43/1390 | 242/18723 | 7.16e-08 | 4.22e-06 | 43 |
| GO:003139624 | Breast | DCIS | regulation of protein ubiquitination | 37/1390 | 210/18723 | 7.12e-07 | 3.01e-05 | 37 |
| GO:1903320 | Colorectum | AD | regulation of protein modification by small protein conjugation or removal | 86/3918 | 242/18723 | 9.43e-08 | 4.65e-06 | 86 |
| GO:0031396 | Colorectum | AD | regulation of protein ubiquitination | 72/3918 | 210/18723 | 4.50e-06 | 1.21e-04 | 72 |
| GO:19033201 | Colorectum | SER | regulation of protein modification by small protein conjugation or removal | 70/2897 | 242/18723 | 6.84e-08 | 4.42e-06 | 70 |
| GO:00313961 | Colorectum | SER | regulation of protein ubiquitination | 62/2897 | 210/18723 | 1.69e-07 | 9.71e-06 | 62 |
| GO:1903322 | Colorectum | SER | positive regulation of protein modification by small protein conjugation or removal | 34/2897 | 138/18723 | 3.30e-03 | 2.83e-02 | 34 |
| GO:190332027 | Esophagus | HGIN | regulation of protein modification by small protein conjugation or removal | 78/2587 | 242/18723 | 1.40e-13 | 2.26e-11 | 78 |
| GO:003139627 | Esophagus | HGIN | regulation of protein ubiquitination | 64/2587 | 210/18723 | 3.02e-10 | 2.71e-08 | 64 |
| GO:19033228 | Esophagus | HGIN | positive regulation of protein modification by small protein conjugation or removal | 35/2587 | 138/18723 | 2.11e-04 | 3.88e-03 | 35 |
| GO:00070593 | Esophagus | HGIN | chromosome segregation | 71/2587 | 346/18723 | 3.47e-04 | 5.62e-03 | 71 |
| GO:00313987 | Esophagus | HGIN | positive regulation of protein ubiquitination | 28/2587 | 119/18723 | 2.89e-03 | 2.81e-02 | 28 |
| GO:1903320111 | Esophagus | ESCC | regulation of protein modification by small protein conjugation or removal | 181/8552 | 242/18723 | 1.80e-20 | 2.60e-18 | 181 |
| GO:000705911 | Esophagus | ESCC | chromosome segregation | 238/8552 | 346/18723 | 1.72e-18 | 1.82e-16 | 238 |
| GO:0031396111 | Esophagus | ESCC | regulation of protein ubiquitination | 154/8552 | 210/18723 | 2.70e-16 | 2.04e-14 | 154 |
| GO:00062604 | Esophagus | ESCC | DNA replication | 181/8552 | 260/18723 | 3.55e-15 | 2.05e-13 | 181 |
| Page: 1 2 3 4 |
| Pathway ID | Tissue | Disease Stage | Description | Gene Ratio | Bg Ratio | pvalue | p.adjust | qvalue | Count |
| Page: 1 |
Top |
Cell-cell communication analysis |
| Identification of potential cell-cell interactions between two cell types and their ligand-receptor pairs for different disease states |
| Ligand | Receptor | LRpair | Pathway | Tissue | Disease Stage |
| Page: 1 |
Top |
Single-cell gene regulatory network inference analysis |
| Find out the significant the regulons (TFs) and the target genes of each regulon across cell types for different disease states |
| TF | Cell Type | Tissue | Disease Stage | Target Gene | RSS | Regulon Activity |
| ∗The dot plots of a searched regulon are shown for all cell subpopulations in each disease state of each tissue based on the regulon specific score inferred using pySCENIC and by calculating the average expression. |
| Page: 1 |
Top |
Somatic mutation of malignant transformation related genes |
| Annotation of somatic variants for genes involved in malignant transformation |
| Hugo Symbol | Variant Class | Variant Classification | dbSNP RS | HGVSc | HGVSp | HGVSp Short | SWISSPROT | BIOTYPE | SIFT | PolyPhen | Tumor Sample Barcode | Tissue | Histology | Sex | Age | Stage | Therapy Types | Drugs | Outcome |
| CENPX | SNV | Missense_Mutation | novel | c.202C>T | p.Arg68Trp | p.R68W | protein_coding | deleterious_low_confidence(0.01) | benign(0.09) | TCGA-G5-6233-01 | Colorectum | rectum adenocarcinoma | Male | >=65 | III/IV | Chemotherapy | 5-fluorouracil | PD | |
| CENPX | SNV | Missense_Mutation | c.41N>G | p.Leu14Arg | p.L14R | protein_coding | deleterious_low_confidence(0) | probably_damaging(0.919) | TCGA-D1-A167-01 | Endometrium | uterine corpus endometrioid carcinoma | Female | >=65 | I/II | Unknown | Unknown | SD | ||
| CENPX | deletion | Frame_Shift_Del | novel | c.197delN | p.Phe66SerfsTer168 | p.F66Sfs*168 | protein_coding | TCGA-AX-A2HA-01 | Endometrium | uterine corpus endometrioid carcinoma | Female | <65 | I/II | Unknown | Unknown | SD |
| Page: 1 |
Top |
Related drugs of malignant transformation related genes |
| Identification of chemicals and drugs interact with genes involved in malignant transfromation |
| (DGIdb 4.0) |
| Entrez ID | Symbol | Category | Interaction Types | Drug Claim Name | Drug Name | PMIDs |
| Page: 1 |

Copyright 2023-Present -The University of Texas Health Science Center at Houston |