
|
|||||
|
 | |
| |
| |
| |
| |
| |
|
Gene: CENPV |
Gene summary for CENPV |
| Gene information | Species | Human | Gene symbol | CENPV | Gene ID | 201161 |
| Gene name | centromere protein V | |
| Gene Alias | 3110013H01Rik | |
| Cytomap | 17p11.2 | |
| Gene Type | protein-coding | GO ID | GO:0000910 | UniProtAcc | Q7Z7K6 |
Top |
Malignant transformation analysis |
| Identification of the aberrant gene expression in precancerous and cancerous lesions by comparing the gene expression of stem-like cells in diseased tissues with normal stem cells |
| Entrez ID | Symbol | Replicates | Species | Organ | Tissue | Adj P-value | Log2FC | Malignancy |
| 201161 | CENPV | LZE7T | Human | Esophagus | ESCC | 3.90e-02 | 1.60e-01 | 0.0667 |
| 201161 | CENPV | LZE24T | Human | Esophagus | ESCC | 8.28e-18 | 4.62e-01 | 0.0596 |
| 201161 | CENPV | P1T-E | Human | Esophagus | ESCC | 2.44e-06 | 2.60e-01 | 0.0875 |
| 201161 | CENPV | P2T-E | Human | Esophagus | ESCC | 1.85e-53 | 1.03e+00 | 0.1177 |
| 201161 | CENPV | P4T-E | Human | Esophagus | ESCC | 1.07e-48 | 1.08e+00 | 0.1323 |
| 201161 | CENPV | P5T-E | Human | Esophagus | ESCC | 1.53e-19 | 3.59e-01 | 0.1327 |
| 201161 | CENPV | P8T-E | Human | Esophagus | ESCC | 1.11e-24 | 4.82e-01 | 0.0889 |
| 201161 | CENPV | P9T-E | Human | Esophagus | ESCC | 1.34e-08 | 2.04e-01 | 0.1131 |
| 201161 | CENPV | P10T-E | Human | Esophagus | ESCC | 1.00e-24 | 4.53e-01 | 0.116 |
| 201161 | CENPV | P11T-E | Human | Esophagus | ESCC | 6.08e-06 | 2.63e-01 | 0.1426 |
| 201161 | CENPV | P12T-E | Human | Esophagus | ESCC | 2.06e-58 | 1.01e+00 | 0.1122 |
| 201161 | CENPV | P15T-E | Human | Esophagus | ESCC | 5.37e-05 | 1.63e-01 | 0.1149 |
| 201161 | CENPV | P16T-E | Human | Esophagus | ESCC | 6.76e-78 | 1.41e+00 | 0.1153 |
| 201161 | CENPV | P17T-E | Human | Esophagus | ESCC | 1.49e-02 | 1.24e-01 | 0.1278 |
| 201161 | CENPV | P19T-E | Human | Esophagus | ESCC | 7.48e-03 | 2.33e-01 | 0.1662 |
| 201161 | CENPV | P21T-E | Human | Esophagus | ESCC | 6.62e-20 | 4.27e-01 | 0.1617 |
| 201161 | CENPV | P22T-E | Human | Esophagus | ESCC | 1.79e-70 | 1.09e+00 | 0.1236 |
| 201161 | CENPV | P23T-E | Human | Esophagus | ESCC | 1.96e-17 | 4.20e-01 | 0.108 |
| 201161 | CENPV | P24T-E | Human | Esophagus | ESCC | 3.75e-03 | 8.88e-02 | 0.1287 |
| 201161 | CENPV | P26T-E | Human | Esophagus | ESCC | 2.81e-25 | 4.79e-01 | 0.1276 |
| Page: 1 2 3 4 |
| Tissue | Expression Dynamics | Abbreviation |
| Esophagus | 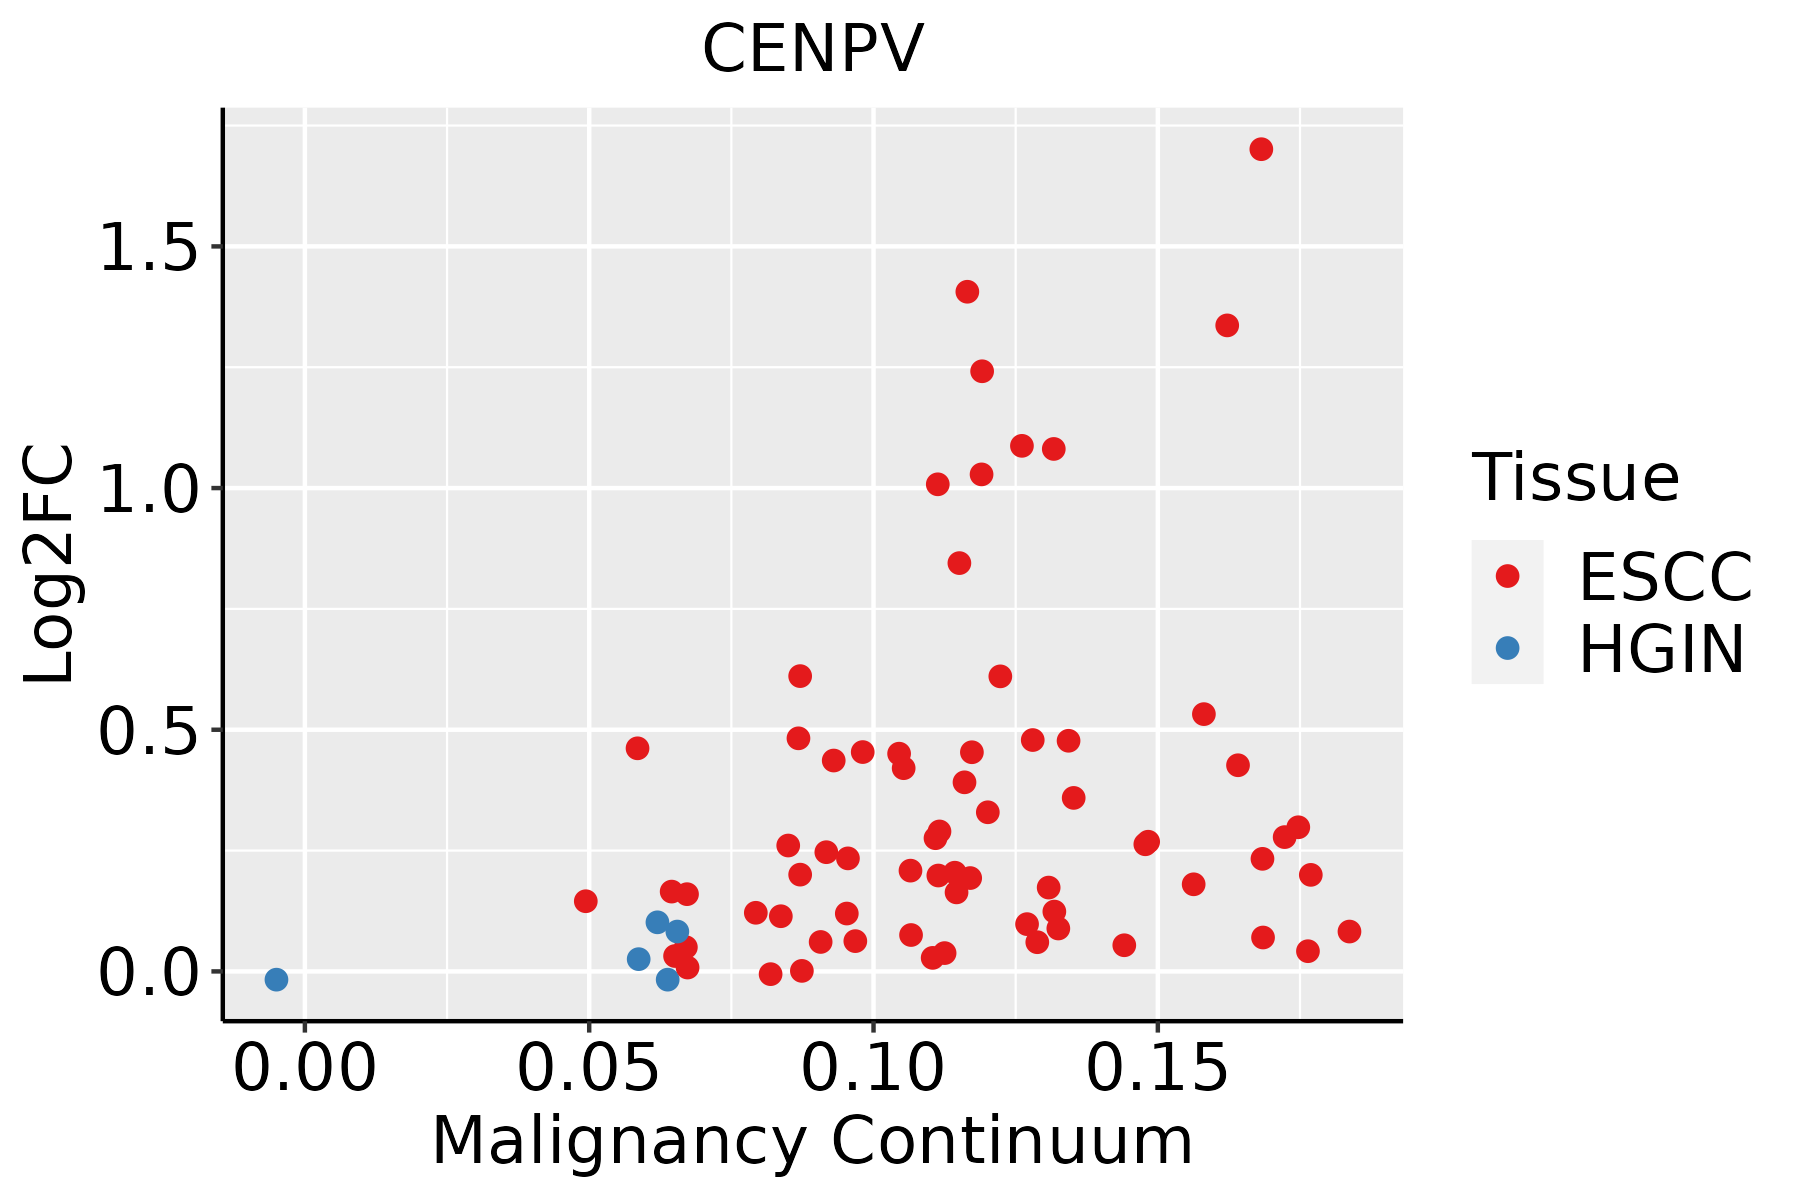 | ESCC: Esophageal squamous cell carcinoma |
| HGIN: High-grade intraepithelial neoplasias | ||
| LGIN: Low-grade intraepithelial neoplasias | ||
| Liver |  | HCC: Hepatocellular carcinoma |
| NAFLD: Non-alcoholic fatty liver disease | ||
| Oral Cavity | 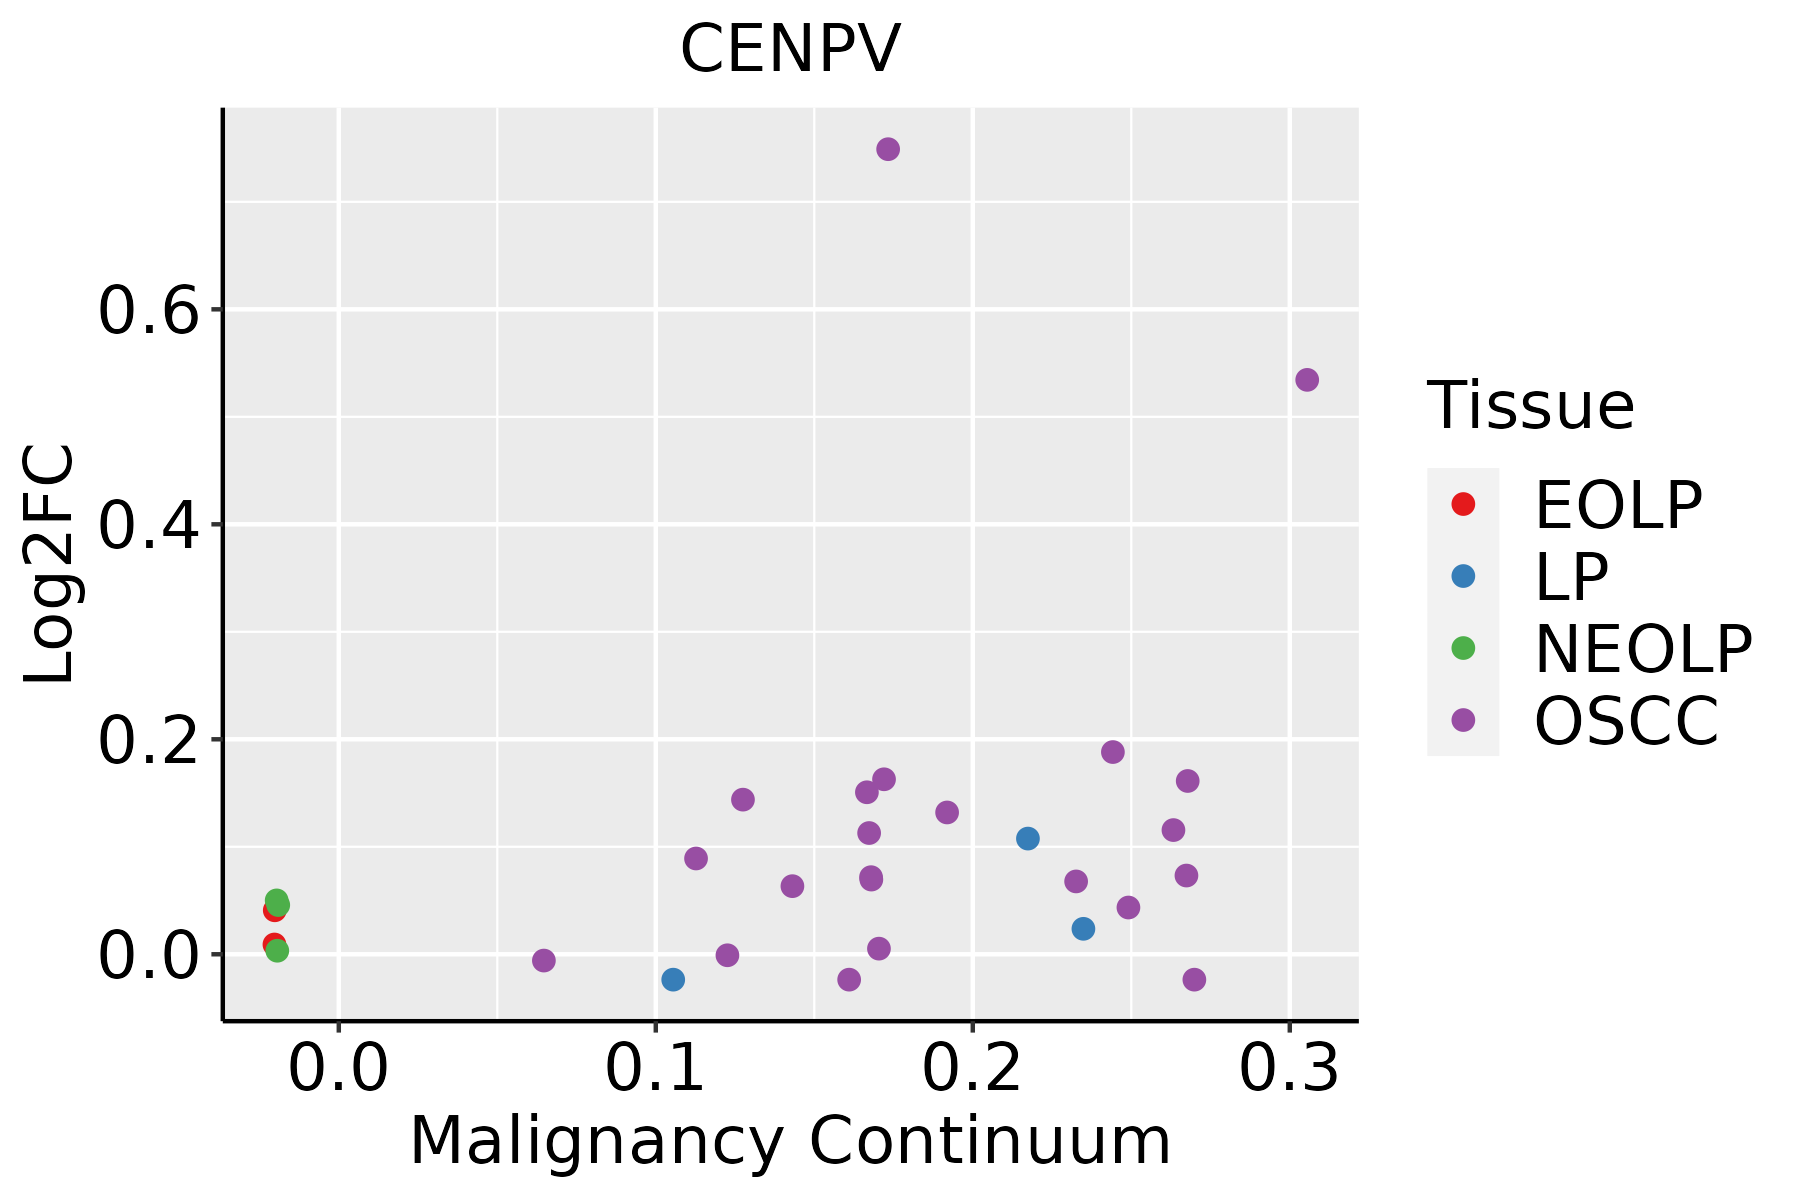 | EOLP: Erosive Oral lichen planus |
| LP: leukoplakia | ||
| NEOLP: Non-erosive oral lichen planus | ||
| OSCC: Oral squamous cell carcinoma | ||
| Thyroid |  | ATC: Anaplastic thyroid cancer |
| HT: Hashimoto's thyroiditis | ||
| PTC: Papillary thyroid cancer |
| ∗log2FC in expression of this searched gene in stem-like cells from each diseased tissue sample relative to stem-like cells in normal samples in each tissue plotted against the malignancy continuum. Samples are colored based on if they are from different disease stage. |
Top |
Malignant transformation related pathway analysis |
| Find out the enriched GO biological processes and KEGG pathways involved in transition from healthy to precancer to cancer |
| Tissue | Disease Stage | Enriched GO biological Processes |
| Colorectum | AD |  |
| Colorectum | SER |  |
| Colorectum | MSS |  |
| Colorectum | MSI-H |  |
| Colorectum | FAP |  |
| ∗Top 15 enriched GO BP terms are showed in the bar plot of each disease state in each tissue. Each row represents a significant GO biological process which is colored according to the -log10(p.adjust). |
| Page: 1 2 3 4 5 6 7 8 9 |
| GO ID | Tissue | Disease Stage | Description | Gene Ratio | Bg Ratio | pvalue | p.adjust | Count |
| GO:003304416 | Esophagus | ESCC | regulation of chromosome organization | 145/8552 | 187/18723 | 3.80e-19 | 4.31e-17 | 145 |
| GO:004578710 | Esophagus | ESCC | positive regulation of cell cycle | 196/8552 | 313/18723 | 9.27e-10 | 2.24e-08 | 196 |
| GO:000091016 | Esophagus | ESCC | cytokinesis | 115/8552 | 173/18723 | 2.48e-08 | 4.68e-07 | 115 |
| GO:000632517 | Esophagus | ESCC | chromatin organization | 240/8552 | 409/18723 | 6.52e-08 | 1.14e-06 | 240 |
| GO:00900689 | Esophagus | ESCC | positive regulation of cell cycle process | 142/8552 | 236/18723 | 4.79e-06 | 5.08e-05 | 142 |
| GO:00345081 | Esophagus | ESCC | centromere complex assembly | 25/8552 | 30/18723 | 2.45e-05 | 2.09e-04 | 25 |
| GO:00324653 | Esophagus | ESCC | regulation of cytokinesis | 57/8552 | 92/18723 | 1.20e-03 | 5.88e-03 | 57 |
| GO:000166720 | Esophagus | ESCC | ameboidal-type cell migration | 250/8552 | 475/18723 | 1.22e-03 | 5.97e-03 | 250 |
| GO:00708281 | Esophagus | ESCC | heterochromatin organization | 31/8552 | 46/18723 | 2.42e-03 | 1.06e-02 | 31 |
| GO:0031055 | Esophagus | ESCC | chromatin remodeling at centromere | 9/8552 | 10/18723 | 5.09e-03 | 1.92e-02 | 9 |
| GO:00513025 | Esophagus | ESCC | regulation of cell division | 97/8552 | 177/18723 | 8.93e-03 | 3.12e-02 | 97 |
| GO:003304411 | Liver | Cirrhotic | regulation of chromosome organization | 74/4634 | 187/18723 | 5.00e-06 | 8.18e-05 | 74 |
| GO:00009105 | Liver | Cirrhotic | cytokinesis | 62/4634 | 173/18723 | 7.13e-04 | 5.33e-03 | 62 |
| GO:000166712 | Liver | Cirrhotic | ameboidal-type cell migration | 145/4634 | 475/18723 | 2.23e-03 | 1.36e-02 | 145 |
| GO:00457874 | Liver | Cirrhotic | positive regulation of cell cycle | 97/4634 | 313/18723 | 6.88e-03 | 3.38e-02 | 97 |
| GO:003304421 | Liver | HCC | regulation of chromosome organization | 125/7958 | 187/18723 | 1.35e-11 | 5.40e-10 | 125 |
| GO:004578711 | Liver | HCC | positive regulation of cell cycle | 172/7958 | 313/18723 | 5.29e-06 | 6.58e-05 | 172 |
| GO:000091011 | Liver | HCC | cytokinesis | 100/7958 | 173/18723 | 3.38e-05 | 3.39e-04 | 100 |
| GO:00900683 | Liver | HCC | positive regulation of cell cycle process | 125/7958 | 236/18723 | 7.21e-04 | 4.40e-03 | 125 |
| GO:000632511 | Liver | HCC | chromatin organization | 206/7958 | 409/18723 | 7.23e-04 | 4.41e-03 | 206 |
| Page: 1 2 3 |
| Pathway ID | Tissue | Disease Stage | Description | Gene Ratio | Bg Ratio | pvalue | p.adjust | qvalue | Count |
| Page: 1 |
Top |
Cell-cell communication analysis |
| Identification of potential cell-cell interactions between two cell types and their ligand-receptor pairs for different disease states |
| Ligand | Receptor | LRpair | Pathway | Tissue | Disease Stage |
| Page: 1 |
Top |
Single-cell gene regulatory network inference analysis |
| Find out the significant the regulons (TFs) and the target genes of each regulon across cell types for different disease states |
| TF | Cell Type | Tissue | Disease Stage | Target Gene | RSS | Regulon Activity |
| ∗The dot plots of a searched regulon are shown for all cell subpopulations in each disease state of each tissue based on the regulon specific score inferred using pySCENIC and by calculating the average expression. |
| Page: 1 |
Top |
Somatic mutation of malignant transformation related genes |
| Annotation of somatic variants for genes involved in malignant transformation |
| Hugo Symbol | Variant Class | Variant Classification | dbSNP RS | HGVSc | HGVSp | HGVSp Short | SWISSPROT | BIOTYPE | SIFT | PolyPhen | Tumor Sample Barcode | Tissue | Histology | Sex | Age | Stage | Therapy Types | Drugs | Outcome |
| CENPV | SNV | Missense_Mutation | rs778078087 | c.652N>A | p.Val218Ile | p.V218I | Q7Z7K6 | protein_coding | tolerated(0.27) | possibly_damaging(0.464) | TCGA-A6-2686-01 | Colorectum | colon adenocarcinoma | Female | >=65 | I/II | Unknown | Unknown | SD |
| CENPV | SNV | Missense_Mutation | c.563N>A | p.Arg188His | p.R188H | Q7Z7K6 | protein_coding | tolerated(0.11) | benign(0.224) | TCGA-AA-A022-01 | Colorectum | colon adenocarcinoma | Female | >=65 | I/II | Unknown | Unknown | SD | |
| CENPV | SNV | Missense_Mutation | c.589C>T | p.His197Tyr | p.H197Y | Q7Z7K6 | protein_coding | tolerated(0.33) | benign(0.005) | TCGA-CM-5864-01 | Colorectum | colon adenocarcinoma | Male | <65 | I/II | Unknown | Unknown | SD | |
| CENPV | SNV | Missense_Mutation | c.494N>G | p.His165Arg | p.H165R | Q7Z7K6 | protein_coding | tolerated(0.25) | benign(0.031) | TCGA-F4-6805-01 | Colorectum | colon adenocarcinoma | Female | <65 | I/II | Chemotherapy | xeloda | CR | |
| CENPV | SNV | Missense_Mutation | novel | c.758N>T | p.Gly253Val | p.G253V | Q7Z7K6 | protein_coding | deleterious(0) | probably_damaging(0.999) | TCGA-A5-A0G1-01 | Endometrium | uterine corpus endometrioid carcinoma | Female | >=65 | I/II | Unknown | Unknown | SD |
| CENPV | SNV | Missense_Mutation | novel | c.420N>T | p.Gln140His | p.Q140H | Q7Z7K6 | protein_coding | deleterious(0.01) | probably_damaging(0.93) | TCGA-AP-A059-01 | Endometrium | uterine corpus endometrioid carcinoma | Female | >=65 | I/II | Unknown | Unknown | SD |
| CENPV | SNV | Missense_Mutation | c.509A>G | p.Asn170Ser | p.N170S | Q7Z7K6 | protein_coding | tolerated(0.16) | possibly_damaging(0.833) | TCGA-AP-A0LM-01 | Endometrium | uterine corpus endometrioid carcinoma | Female | <65 | III/IV | Chemotherapy | cisplatin | SD | |
| CENPV | SNV | Missense_Mutation | novel | c.481N>A | p.Ser161Thr | p.S161T | Q7Z7K6 | protein_coding | tolerated(0.16) | benign(0.171) | TCGA-DF-A2KN-01 | Endometrium | uterine corpus endometrioid carcinoma | Female | Unknown | I/II | Unknown | Unknown | SD |
| CENPV | SNV | Missense_Mutation | rs747169529 | c.605C>T | p.Thr202Met | p.T202M | Q7Z7K6 | protein_coding | deleterious(0) | probably_damaging(0.988) | TCGA-EY-A1GU-01 | Endometrium | uterine corpus endometrioid carcinoma | Female | >=65 | I/II | Unknown | Unknown | SD |
| CENPV | SNV | Missense_Mutation | novel | c.668N>T | p.Thr223Ile | p.T223I | Q7Z7K6 | protein_coding | tolerated(0.18) | benign(0.031) | TCGA-EY-A215-01 | Endometrium | uterine corpus endometrioid carcinoma | Female | <65 | I/II | Unknown | Unknown | SD |
| Page: 1 2 |
Top |
Related drugs of malignant transformation related genes |
| Identification of chemicals and drugs interact with genes involved in malignant transfromation |
| (DGIdb 4.0) |
| Entrez ID | Symbol | Category | Interaction Types | Drug Claim Name | Drug Name | PMIDs |
| Page: 1 |

Copyright 2023-Present -The University of Texas Health Science Center at Houston |