
|
|||||
|
 | |
| |
| |
| |
| |
| |
|
Gene: CENPT |
Gene summary for CENPT |
| Gene information | Species | Human | Gene symbol | CENPT | Gene ID | 80152 |
| Gene name | centromere protein T | |
| Gene Alias | C16orf56 | |
| Cytomap | 16q22.1 | |
| Gene Type | protein-coding | GO ID | GO:0000278 | UniProtAcc | B3KPB2 |
Top |
Malignant transformation analysis |
| Identification of the aberrant gene expression in precancerous and cancerous lesions by comparing the gene expression of stem-like cells in diseased tissues with normal stem cells |
| Entrez ID | Symbol | Replicates | Species | Organ | Tissue | Adj P-value | Log2FC | Malignancy |
| 80152 | CENPT | LZE4T | Human | Esophagus | ESCC | 2.21e-10 | 3.26e-01 | 0.0811 |
| 80152 | CENPT | LZE7T | Human | Esophagus | ESCC | 9.03e-11 | 3.28e-01 | 0.0667 |
| 80152 | CENPT | LZE8T | Human | Esophagus | ESCC | 5.20e-05 | 1.29e-01 | 0.067 |
| 80152 | CENPT | LZE22D1 | Human | Esophagus | HGIN | 4.18e-03 | 1.66e-01 | 0.0595 |
| 80152 | CENPT | LZE24T | Human | Esophagus | ESCC | 2.81e-15 | 3.96e-01 | 0.0596 |
| 80152 | CENPT | P1T-E | Human | Esophagus | ESCC | 1.21e-11 | 5.98e-01 | 0.0875 |
| 80152 | CENPT | P2T-E | Human | Esophagus | ESCC | 1.40e-22 | 3.57e-01 | 0.1177 |
| 80152 | CENPT | P4T-E | Human | Esophagus | ESCC | 4.77e-17 | 3.77e-01 | 0.1323 |
| 80152 | CENPT | P5T-E | Human | Esophagus | ESCC | 4.48e-15 | 1.99e-01 | 0.1327 |
| 80152 | CENPT | P8T-E | Human | Esophagus | ESCC | 5.25e-27 | 5.33e-01 | 0.0889 |
| 80152 | CENPT | P9T-E | Human | Esophagus | ESCC | 3.42e-04 | 1.50e-01 | 0.1131 |
| 80152 | CENPT | P10T-E | Human | Esophagus | ESCC | 1.64e-21 | 2.02e-01 | 0.116 |
| 80152 | CENPT | P11T-E | Human | Esophagus | ESCC | 2.41e-14 | 4.31e-01 | 0.1426 |
| 80152 | CENPT | P12T-E | Human | Esophagus | ESCC | 1.35e-25 | 3.10e-01 | 0.1122 |
| 80152 | CENPT | P15T-E | Human | Esophagus | ESCC | 2.61e-13 | 2.64e-01 | 0.1149 |
| 80152 | CENPT | P16T-E | Human | Esophagus | ESCC | 4.79e-15 | 1.92e-01 | 0.1153 |
| 80152 | CENPT | P17T-E | Human | Esophagus | ESCC | 2.08e-09 | 3.98e-01 | 0.1278 |
| 80152 | CENPT | P19T-E | Human | Esophagus | ESCC | 2.29e-07 | 5.26e-01 | 0.1662 |
| 80152 | CENPT | P20T-E | Human | Esophagus | ESCC | 6.61e-09 | 2.64e-01 | 0.1124 |
| 80152 | CENPT | P21T-E | Human | Esophagus | ESCC | 1.26e-15 | 2.83e-01 | 0.1617 |
| Page: 1 2 3 4 5 |
| Tissue | Expression Dynamics | Abbreviation |
| Esophagus | 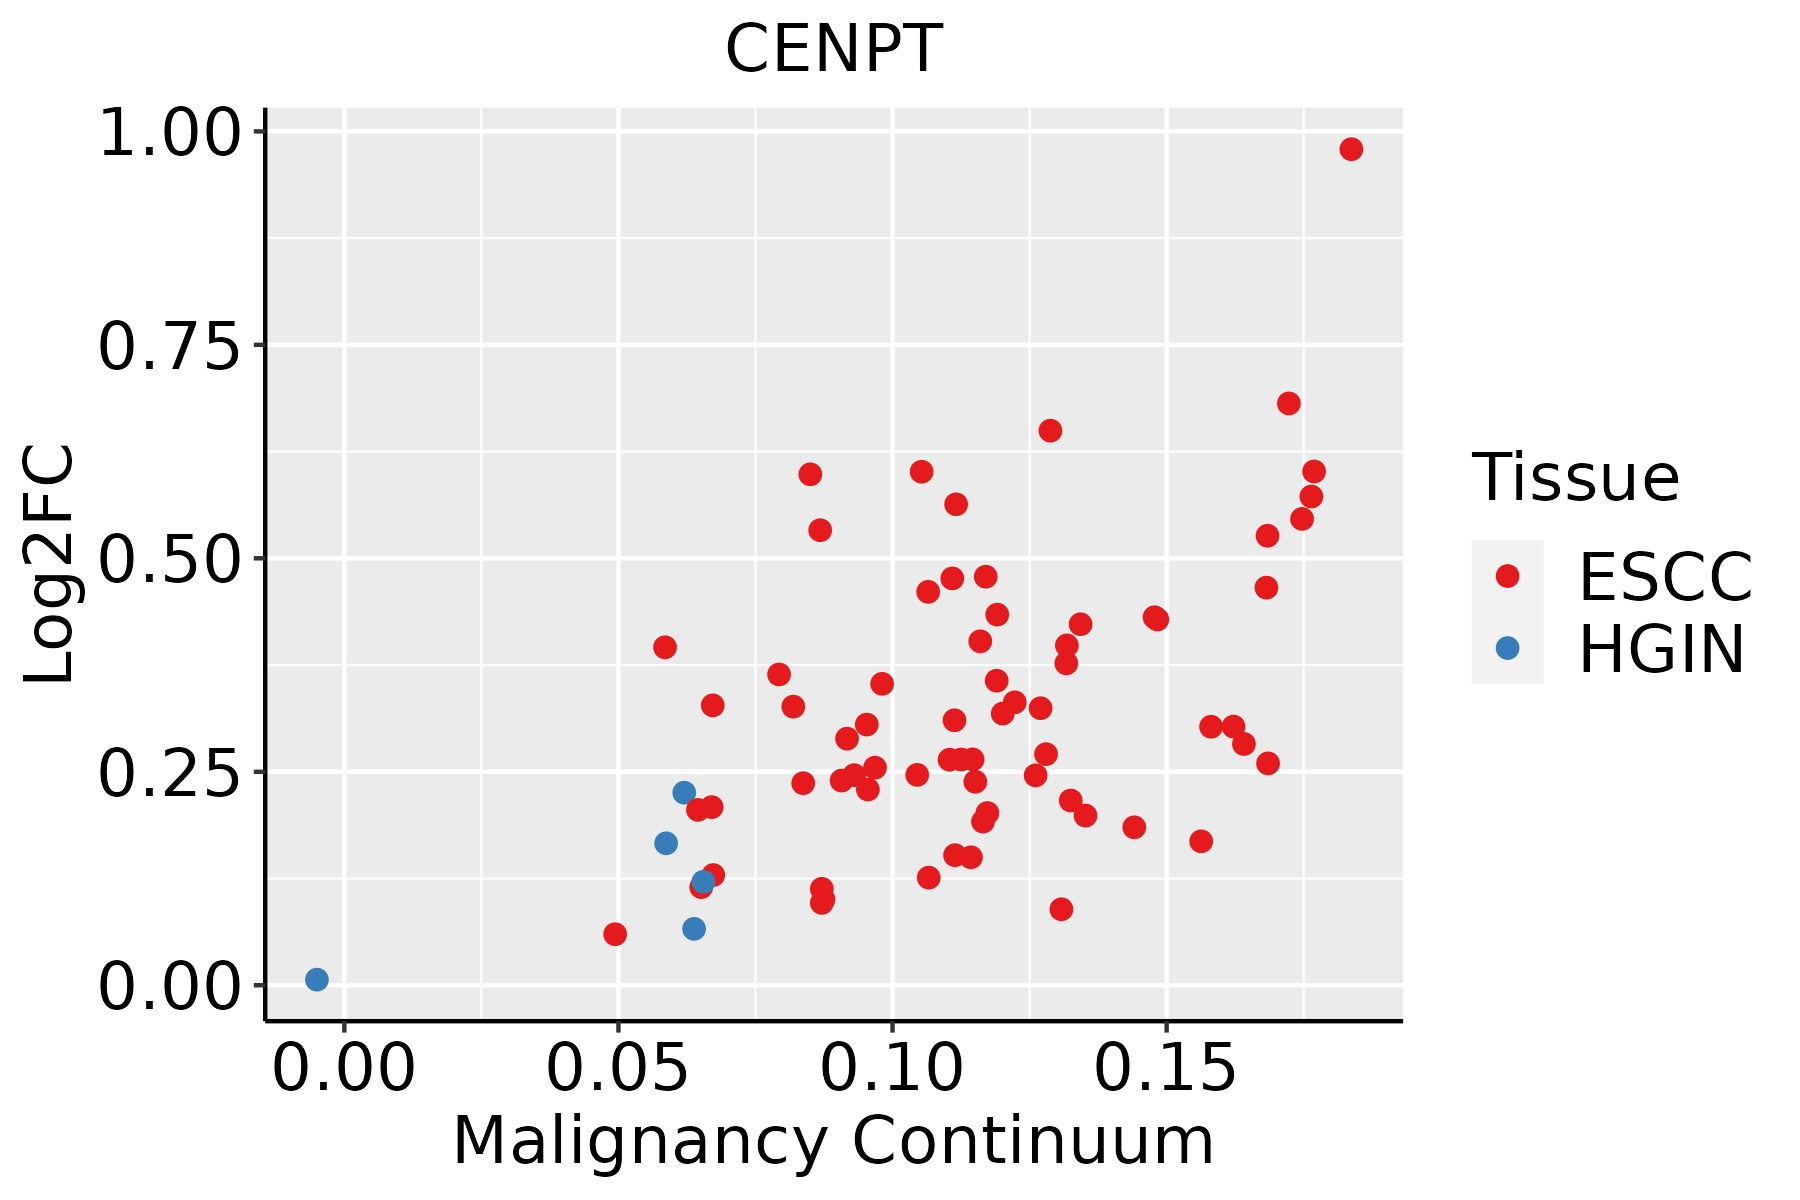 | ESCC: Esophageal squamous cell carcinoma |
| HGIN: High-grade intraepithelial neoplasias | ||
| LGIN: Low-grade intraepithelial neoplasias | ||
| Oral Cavity |  | EOLP: Erosive Oral lichen planus |
| LP: leukoplakia | ||
| NEOLP: Non-erosive oral lichen planus | ||
| OSCC: Oral squamous cell carcinoma | ||
| Thyroid |  | ATC: Anaplastic thyroid cancer |
| HT: Hashimoto's thyroiditis | ||
| PTC: Papillary thyroid cancer |
| ∗log2FC in expression of this searched gene in stem-like cells from each diseased tissue sample relative to stem-like cells in normal samples in each tissue plotted against the malignancy continuum. Samples are colored based on if they are from different disease stage. |
Top |
Malignant transformation related pathway analysis |
| Find out the enriched GO biological processes and KEGG pathways involved in transition from healthy to precancer to cancer |
| Tissue | Disease Stage | Enriched GO biological Processes |
| Colorectum | AD |  |
| Colorectum | SER |  |
| Colorectum | MSS |  |
| Colorectum | MSI-H |  |
| Colorectum | FAP |  |
| ∗Top 15 enriched GO BP terms are showed in the bar plot of each disease state in each tissue. Each row represents a significant GO biological process which is colored according to the -log10(p.adjust). |
| Page: 1 2 3 4 5 6 7 8 9 |
| GO ID | Tissue | Disease Stage | Description | Gene Ratio | Bg Ratio | pvalue | p.adjust | Count |
| GO:00070593 | Esophagus | HGIN | chromosome segregation | 71/2587 | 346/18723 | 3.47e-04 | 5.62e-03 | 71 |
| GO:000705911 | Esophagus | ESCC | chromosome segregation | 238/8552 | 346/18723 | 1.72e-18 | 1.82e-16 | 238 |
| GO:00513831 | Esophagus | ESCC | kinetochore organization | 21/8552 | 23/18723 | 5.69e-06 | 5.90e-05 | 21 |
| GO:00345081 | Esophagus | ESCC | centromere complex assembly | 25/8552 | 30/18723 | 2.45e-05 | 2.09e-04 | 25 |
| GO:00513821 | Esophagus | ESCC | kinetochore assembly | 16/8552 | 18/18723 | 1.78e-04 | 1.15e-03 | 16 |
| GO:00070592 | Oral cavity | OSCC | chromosome segregation | 206/7305 | 346/18723 | 5.82e-15 | 3.76e-13 | 206 |
| GO:0051383 | Oral cavity | OSCC | kinetochore organization | 18/7305 | 23/18723 | 1.47e-04 | 1.04e-03 | 18 |
| GO:0034508 | Oral cavity | OSCC | centromere complex assembly | 21/7305 | 30/18723 | 5.75e-04 | 3.30e-03 | 21 |
| GO:0051382 | Oral cavity | OSCC | kinetochore assembly | 14/7305 | 18/18723 | 9.51e-04 | 4.96e-03 | 14 |
| GO:00070591 | Oral cavity | LP | chromosome segregation | 117/4623 | 346/18723 | 7.61e-05 | 9.91e-04 | 117 |
| GO:00070595 | Thyroid | PTC | chromosome segregation | 146/5968 | 346/18723 | 2.99e-05 | 2.87e-04 | 146 |
| GO:000705913 | Thyroid | ATC | chromosome segregation | 183/6293 | 346/18723 | 8.03e-14 | 4.23e-12 | 183 |
| GO:00513833 | Thyroid | ATC | kinetochore organization | 18/6293 | 23/18723 | 1.47e-05 | 1.39e-04 | 18 |
| GO:00513823 | Thyroid | ATC | kinetochore assembly | 15/6293 | 18/18723 | 2.06e-05 | 1.85e-04 | 15 |
| GO:00345083 | Thyroid | ATC | centromere complex assembly | 20/6293 | 30/18723 | 2.18e-04 | 1.43e-03 | 20 |
| GO:00718242 | Thyroid | ATC | protein-DNA complex subunit organization | 103/6293 | 241/18723 | 1.84e-03 | 9.03e-03 | 103 |
| Page: 1 |
| Pathway ID | Tissue | Disease Stage | Description | Gene Ratio | Bg Ratio | pvalue | p.adjust | qvalue | Count |
| Page: 1 |
Top |
Cell-cell communication analysis |
| Identification of potential cell-cell interactions between two cell types and their ligand-receptor pairs for different disease states |
| Ligand | Receptor | LRpair | Pathway | Tissue | Disease Stage |
| Page: 1 |
Top |
Single-cell gene regulatory network inference analysis |
| Find out the significant the regulons (TFs) and the target genes of each regulon across cell types for different disease states |
| TF | Cell Type | Tissue | Disease Stage | Target Gene | RSS | Regulon Activity |
| ∗The dot plots of a searched regulon are shown for all cell subpopulations in each disease state of each tissue based on the regulon specific score inferred using pySCENIC and by calculating the average expression. |
| Page: 1 |
Top |
Somatic mutation of malignant transformation related genes |
| Annotation of somatic variants for genes involved in malignant transformation |
| Hugo Symbol | Variant Class | Variant Classification | dbSNP RS | HGVSc | HGVSp | HGVSp Short | SWISSPROT | BIOTYPE | SIFT | PolyPhen | Tumor Sample Barcode | Tissue | Histology | Sex | Age | Stage | Therapy Types | Drugs | Outcome |
| CENPT | SNV | Missense_Mutation | novel | c.137N>G | p.Ala46Gly | p.A46G | Q96BT3 | protein_coding | deleterious(0.02) | benign(0.058) | TCGA-A2-A0CT-01 | Breast | breast invasive carcinoma | Female | >=65 | I/II | Chemotherapy | cytoxan | SD |
| CENPT | insertion | In_Frame_Ins | novel | c.943_944insTATTTCTCCAGGTCTCCTCCCCAC | p.Ser315delinsIlePheLeuGlnValSerSerProArg | p.S315delinsIFLQVSSPR | Q96BT3 | protein_coding | TCGA-BH-A0HF-01 | Breast | breast invasive carcinoma | Female | >=65 | I/II | Hormone Therapy | arimidex | SD | ||
| CENPT | SNV | Missense_Mutation | c.994N>C | p.Glu332Gln | p.E332Q | Q96BT3 | protein_coding | tolerated(0.11) | benign(0.007) | TCGA-IR-A3LL-01 | Cervix | cervical & endocervical cancer | Female | <65 | I/II | Chemotherapy | cisplatin | CR | |
| CENPT | SNV | Missense_Mutation | c.653N>G | p.Asp218Gly | p.D218G | Q96BT3 | protein_coding | deleterious(0.01) | possibly_damaging(0.807) | TCGA-AY-6197-01 | Colorectum | colon adenocarcinoma | Male | <65 | I/II | Unknown | Unknown | SD | |
| CENPT | SNV | Missense_Mutation | rs779497731 | c.1355G>A | p.Arg452Gln | p.R452Q | Q96BT3 | protein_coding | tolerated(0.17) | benign(0.005) | TCGA-CK-4951-01 | Colorectum | colon adenocarcinoma | Female | >=65 | I/II | Unknown | Unknown | PD |
| CENPT | SNV | Missense_Mutation | c.1130C>T | p.Ala377Val | p.A377V | Q96BT3 | protein_coding | tolerated(1) | benign(0) | TCGA-NH-A5IV-01 | Colorectum | colon adenocarcinoma | Female | >=65 | I/II | Unknown | Unknown | SD | |
| CENPT | SNV | Missense_Mutation | novel | c.685A>G | p.Thr229Ala | p.T229A | Q96BT3 | protein_coding | tolerated(0.1) | benign(0.007) | TCGA-AF-2691-01 | Colorectum | rectum adenocarcinoma | Female | <65 | I/II | Unknown | Unknown | SD |
| CENPT | SNV | Missense_Mutation | c.1373C>T | p.Ala458Val | p.A458V | Q96BT3 | protein_coding | deleterious(0.01) | benign(0.197) | TCGA-EI-6507-01 | Colorectum | rectum adenocarcinoma | Male | <65 | I/II | Unknown | Unknown | SD | |
| CENPT | SNV | Missense_Mutation | c.1249N>A | p.Leu417Ile | p.L417I | Q96BT3 | protein_coding | tolerated(0.12) | benign(0.007) | TCGA-F5-6814-01 | Colorectum | rectum adenocarcinoma | Male | <65 | I/II | Unknown | Unknown | SD | |
| CENPT | SNV | Missense_Mutation | c.70N>A | p.Asp24Asn | p.D24N | Q96BT3 | protein_coding | deleterious(0.03) | possibly_damaging(0.648) | TCGA-A5-A0VP-01 | Endometrium | uterine corpus endometrioid carcinoma | Female | >=65 | I/II | Unknown | Unknown | SD |
| Page: 1 2 3 4 |
Top |
Related drugs of malignant transformation related genes |
| Identification of chemicals and drugs interact with genes involved in malignant transfromation |
| (DGIdb 4.0) |
| Entrez ID | Symbol | Category | Interaction Types | Drug Claim Name | Drug Name | PMIDs |
| Page: 1 |

Copyright 2023-Present -The University of Texas Health Science Center at Houston |