
|
|||||
|
 | |
| |
| |
| |
| |
| |
|
Gene: CENPQ |
Gene summary for CENPQ |
| Gene information | Species | Human | Gene symbol | CENPQ | Gene ID | 55166 |
| Gene name | centromere protein Q | |
| Gene Alias | C6orf139 | |
| Cytomap | 6p12.3 | |
| Gene Type | protein-coding | GO ID | GO:0007049 | UniProtAcc | Q7L2Z9 |
Top |
Malignant transformation analysis |
| Identification of the aberrant gene expression in precancerous and cancerous lesions by comparing the gene expression of stem-like cells in diseased tissues with normal stem cells |
| Entrez ID | Symbol | Replicates | Species | Organ | Tissue | Adj P-value | Log2FC | Malignancy |
| 55166 | CENPQ | LZE2D | Human | Esophagus | HGIN | 3.64e-03 | 3.66e-01 | 0.0642 |
| 55166 | CENPQ | LZE2T | Human | Esophagus | ESCC | 1.52e-08 | 7.65e-01 | 0.082 |
| 55166 | CENPQ | LZE4T | Human | Esophagus | ESCC | 6.35e-03 | 1.08e-01 | 0.0811 |
| 55166 | CENPQ | LZE22T | Human | Esophagus | ESCC | 1.54e-04 | 2.95e-01 | 0.068 |
| 55166 | CENPQ | LZE24T | Human | Esophagus | ESCC | 3.17e-06 | 1.51e-01 | 0.0596 |
| 55166 | CENPQ | P1T-E | Human | Esophagus | ESCC | 4.62e-03 | 1.52e-01 | 0.0875 |
| 55166 | CENPQ | P2T-E | Human | Esophagus | ESCC | 9.20e-06 | 1.10e-01 | 0.1177 |
| 55166 | CENPQ | P4T-E | Human | Esophagus | ESCC | 9.91e-08 | 1.97e-01 | 0.1323 |
| 55166 | CENPQ | P5T-E | Human | Esophagus | ESCC | 9.53e-09 | 1.78e-01 | 0.1327 |
| 55166 | CENPQ | P8T-E | Human | Esophagus | ESCC | 1.88e-11 | 2.23e-01 | 0.0889 |
| 55166 | CENPQ | P9T-E | Human | Esophagus | ESCC | 5.23e-05 | 1.50e-01 | 0.1131 |
| 55166 | CENPQ | P10T-E | Human | Esophagus | ESCC | 8.56e-12 | 2.09e-01 | 0.116 |
| 55166 | CENPQ | P11T-E | Human | Esophagus | ESCC | 1.72e-04 | 1.65e-01 | 0.1426 |
| 55166 | CENPQ | P12T-E | Human | Esophagus | ESCC | 8.84e-05 | 8.64e-02 | 0.1122 |
| 55166 | CENPQ | P16T-E | Human | Esophagus | ESCC | 4.12e-11 | 2.48e-01 | 0.1153 |
| 55166 | CENPQ | P17T-E | Human | Esophagus | ESCC | 8.50e-05 | 1.94e-01 | 0.1278 |
| 55166 | CENPQ | P20T-E | Human | Esophagus | ESCC | 3.97e-02 | 7.55e-02 | 0.1124 |
| 55166 | CENPQ | P21T-E | Human | Esophagus | ESCC | 4.44e-08 | 1.48e-01 | 0.1617 |
| 55166 | CENPQ | P24T-E | Human | Esophagus | ESCC | 4.40e-09 | 2.20e-01 | 0.1287 |
| 55166 | CENPQ | P26T-E | Human | Esophagus | ESCC | 2.06e-08 | 1.83e-01 | 0.1276 |
| Page: 1 2 3 |
| Tissue | Expression Dynamics | Abbreviation |
| Esophagus | 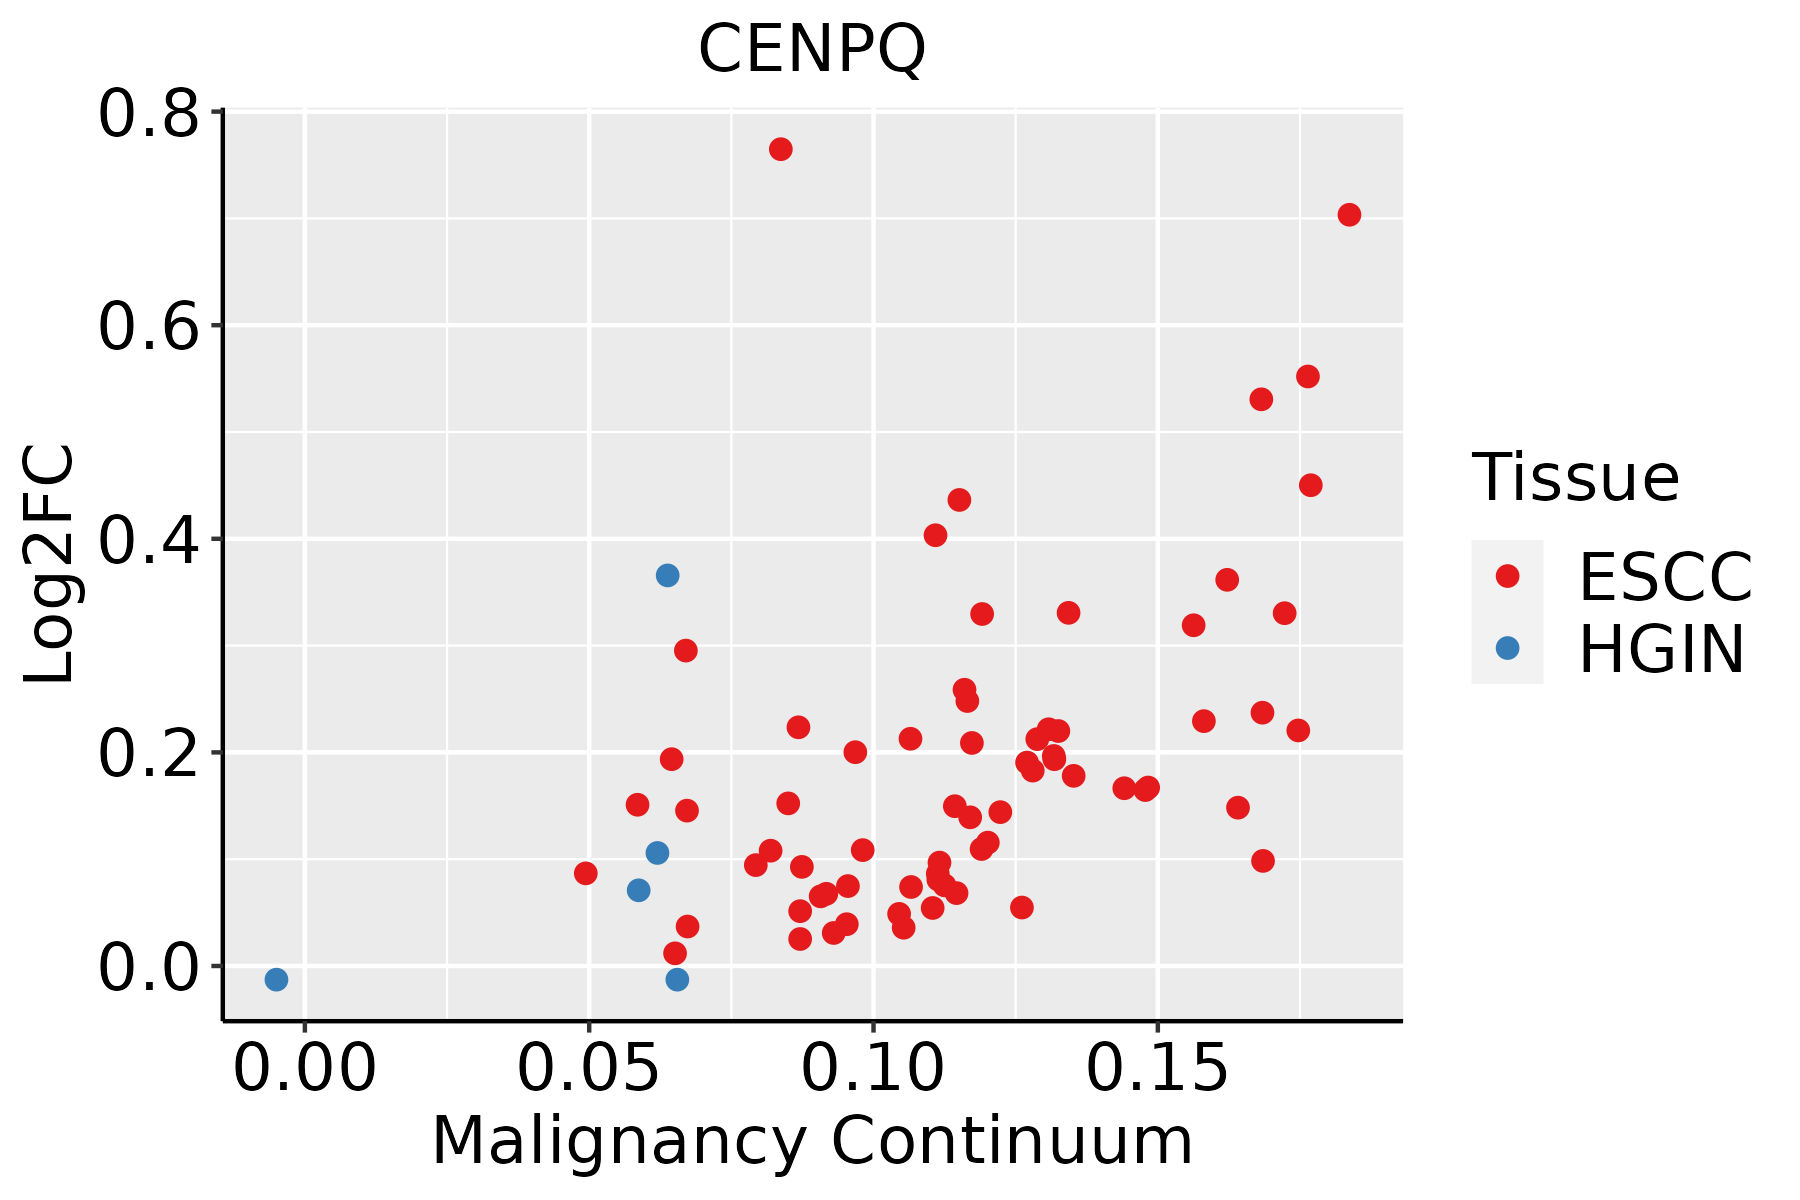 | ESCC: Esophageal squamous cell carcinoma |
| HGIN: High-grade intraepithelial neoplasias | ||
| LGIN: Low-grade intraepithelial neoplasias | ||
| Oral Cavity | 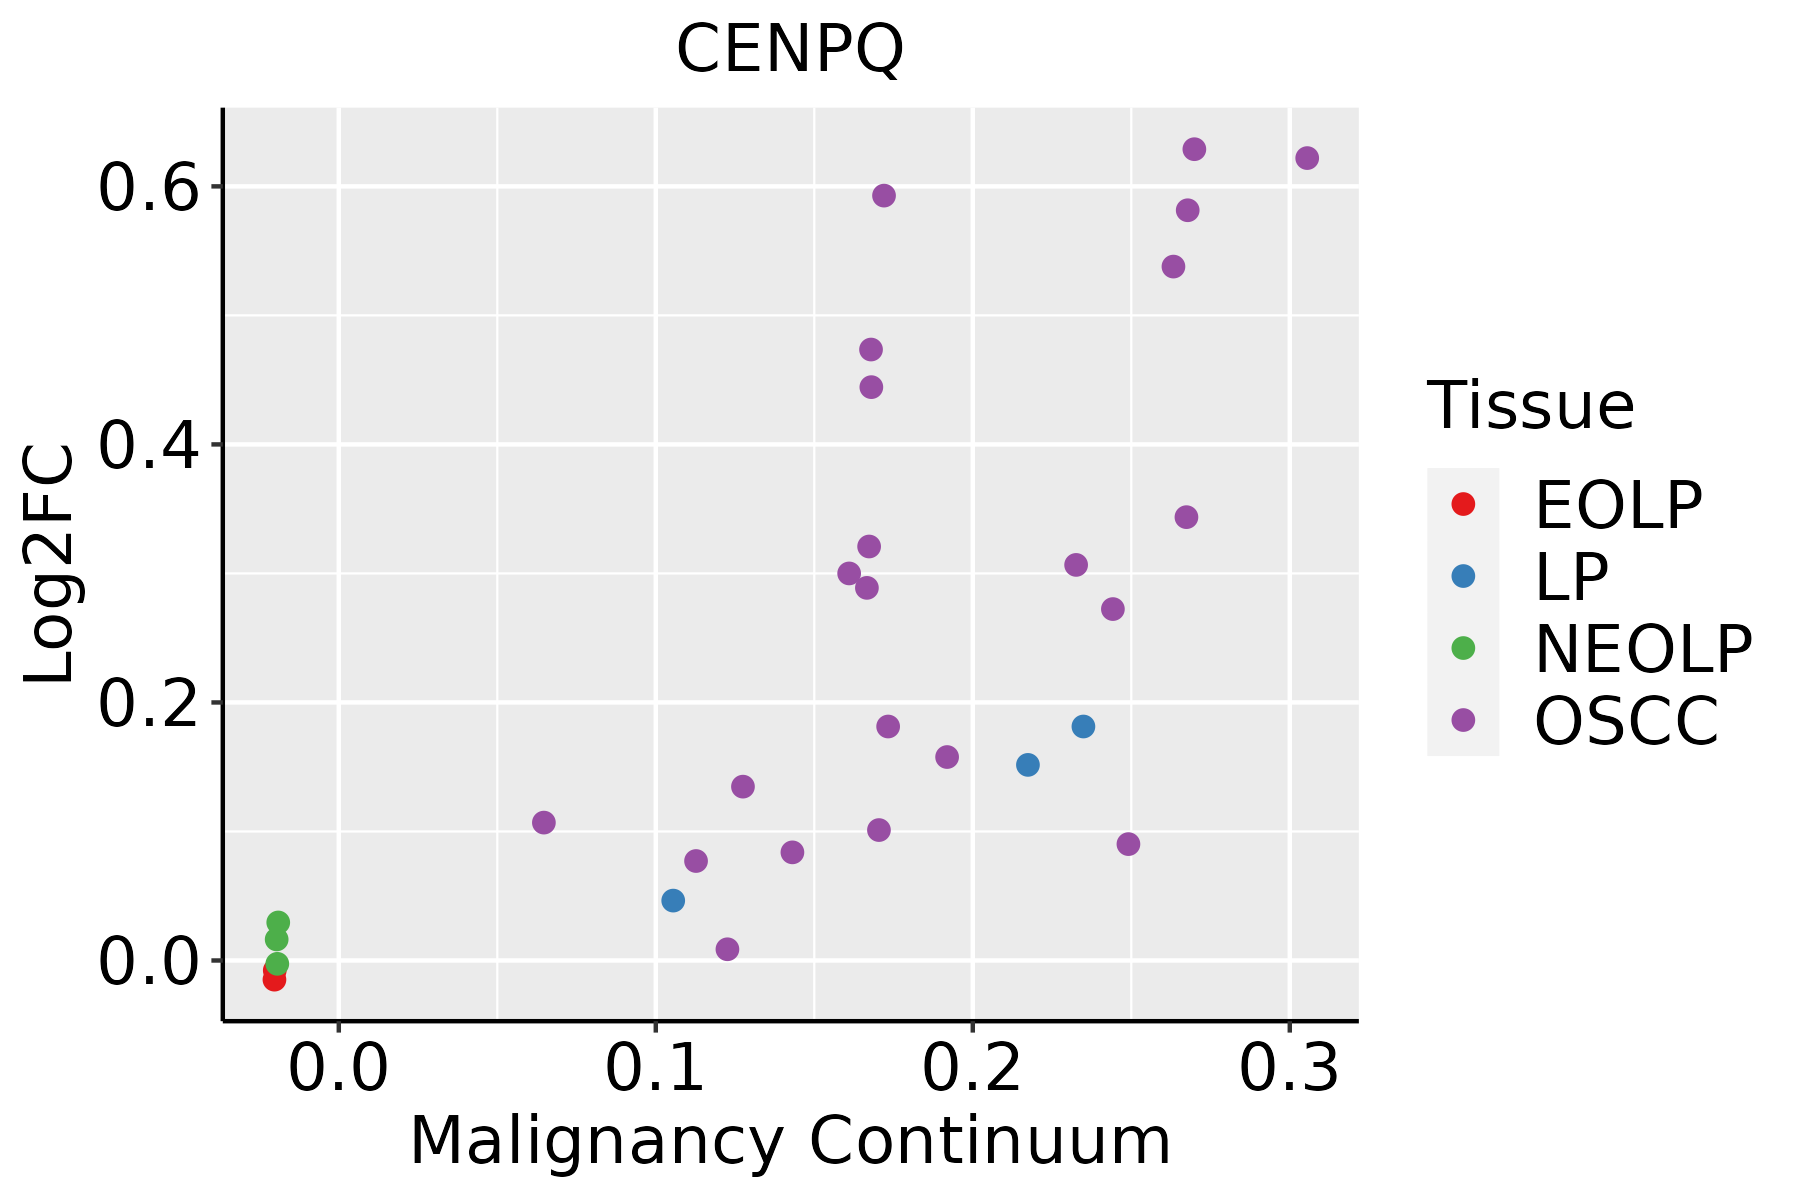 | EOLP: Erosive Oral lichen planus |
| LP: leukoplakia | ||
| NEOLP: Non-erosive oral lichen planus | ||
| OSCC: Oral squamous cell carcinoma |
| ∗log2FC in expression of this searched gene in stem-like cells from each diseased tissue sample relative to stem-like cells in normal samples in each tissue plotted against the malignancy continuum. Samples are colored based on if they are from different disease stage. |
Top |
Malignant transformation related pathway analysis |
| Find out the enriched GO biological processes and KEGG pathways involved in transition from healthy to precancer to cancer |
| Tissue | Disease Stage | Enriched GO biological Processes |
| Colorectum | AD |  |
| Colorectum | SER |  |
| Colorectum | MSS |  |
| Colorectum | MSI-H |  |
| Colorectum | FAP |  |
| ∗Top 15 enriched GO BP terms are showed in the bar plot of each disease state in each tissue. Each row represents a significant GO biological process which is colored according to the -log10(p.adjust). |
| Page: 1 2 3 4 5 6 7 8 9 |
| GO ID | Tissue | Disease Stage | Description | Gene Ratio | Bg Ratio | pvalue | p.adjust | Count |
| GO:190382926 | Esophagus | HGIN | positive regulation of cellular protein localization | 75/2587 | 276/18723 | 3.19e-09 | 2.30e-07 | 75 |
| GO:005165616 | Esophagus | HGIN | establishment of organelle localization | 90/2587 | 390/18723 | 4.27e-07 | 1.94e-05 | 90 |
| GO:00500003 | Esophagus | HGIN | chromosome localization | 24/2587 | 82/18723 | 2.07e-04 | 3.82e-03 | 24 |
| GO:00070593 | Esophagus | HGIN | chromosome segregation | 71/2587 | 346/18723 | 3.47e-04 | 5.62e-03 | 71 |
| GO:00513033 | Esophagus | HGIN | establishment of chromosome localization | 23/2587 | 80/18723 | 3.71e-04 | 5.77e-03 | 23 |
| GO:00345024 | Esophagus | HGIN | protein localization to chromosome | 24/2587 | 92/18723 | 1.29e-03 | 1.54e-02 | 24 |
| GO:00513103 | Esophagus | HGIN | metaphase plate congression | 18/2587 | 65/18723 | 2.46e-03 | 2.45e-02 | 18 |
| GO:005165617 | Esophagus | ESCC | establishment of organelle localization | 273/8552 | 390/18723 | 9.13e-23 | 1.81e-20 | 273 |
| GO:1903829111 | Esophagus | ESCC | positive regulation of cellular protein localization | 199/8552 | 276/18723 | 2.99e-19 | 3.45e-17 | 199 |
| GO:000705911 | Esophagus | ESCC | chromosome segregation | 238/8552 | 346/18723 | 1.72e-18 | 1.82e-16 | 238 |
| GO:005131011 | Esophagus | ESCC | metaphase plate congression | 58/8552 | 65/18723 | 1.81e-13 | 8.63e-12 | 58 |
| GO:00988133 | Esophagus | ESCC | nuclear chromosome segregation | 187/8552 | 281/18723 | 1.00e-12 | 4.36e-11 | 187 |
| GO:005130311 | Esophagus | ESCC | establishment of chromosome localization | 67/8552 | 80/18723 | 1.92e-12 | 8.09e-11 | 67 |
| GO:005000011 | Esophagus | ESCC | chromosome localization | 68/8552 | 82/18723 | 3.37e-12 | 1.32e-10 | 68 |
| GO:003450211 | Esophagus | ESCC | protein localization to chromosome | 70/8552 | 92/18723 | 2.54e-09 | 5.64e-08 | 70 |
| GO:00714591 | Esophagus | ESCC | protein localization to chromosome, centromeric region | 18/8552 | 25/18723 | 7.04e-03 | 2.56e-02 | 18 |
| GO:005165610 | Oral cavity | OSCC | establishment of organelle localization | 239/7305 | 390/18723 | 2.46e-19 | 3.31e-17 | 239 |
| GO:190382920 | Oral cavity | OSCC | positive regulation of cellular protein localization | 179/7305 | 276/18723 | 2.20e-18 | 2.41e-16 | 179 |
| GO:00070592 | Oral cavity | OSCC | chromosome segregation | 206/7305 | 346/18723 | 5.82e-15 | 3.76e-13 | 206 |
| GO:00988132 | Oral cavity | OSCC | nuclear chromosome segregation | 162/7305 | 281/18723 | 1.56e-10 | 4.56e-09 | 162 |
| Page: 1 2 |
| Pathway ID | Tissue | Disease Stage | Description | Gene Ratio | Bg Ratio | pvalue | p.adjust | qvalue | Count |
| Page: 1 |
Top |
Cell-cell communication analysis |
| Identification of potential cell-cell interactions between two cell types and their ligand-receptor pairs for different disease states |
| Ligand | Receptor | LRpair | Pathway | Tissue | Disease Stage |
| Page: 1 |
Top |
Single-cell gene regulatory network inference analysis |
| Find out the significant the regulons (TFs) and the target genes of each regulon across cell types for different disease states |
| TF | Cell Type | Tissue | Disease Stage | Target Gene | RSS | Regulon Activity |
| ∗The dot plots of a searched regulon are shown for all cell subpopulations in each disease state of each tissue based on the regulon specific score inferred using pySCENIC and by calculating the average expression. |
| Page: 1 |
Top |
Somatic mutation of malignant transformation related genes |
| Annotation of somatic variants for genes involved in malignant transformation |
| Hugo Symbol | Variant Class | Variant Classification | dbSNP RS | HGVSc | HGVSp | HGVSp Short | SWISSPROT | BIOTYPE | SIFT | PolyPhen | Tumor Sample Barcode | Tissue | Histology | Sex | Age | Stage | Therapy Types | Drugs | Outcome |
| CENPQ | SNV | Missense_Mutation | novel | c.508N>A | p.Glu170Lys | p.E170K | Q7L2Z9 | protein_coding | deleterious(0) | possibly_damaging(0.906) | TCGA-JW-A5VL-01 | Cervix | cervical & endocervical cancer | Female | <65 | I/II | Unknown | Unknown | SD |
| CENPQ | SNV | Missense_Mutation | rs767389861 | c.397G>A | p.Asp133Asn | p.D133N | Q7L2Z9 | protein_coding | tolerated(1) | benign(0.011) | TCGA-VS-A9UC-01 | Cervix | cervical & endocervical cancer | Female | <65 | I/II | Chemotherapy | cisplatin | SD |
| CENPQ | SNV | Missense_Mutation | novel | c.677N>G | p.Lys226Arg | p.K226R | Q7L2Z9 | protein_coding | deleterious(0.03) | benign(0.196) | TCGA-A6-3808-01 | Colorectum | colon adenocarcinoma | Male | >=65 | I/II | Unknown | Unknown | SD |
| CENPQ | SNV | Missense_Mutation | c.559G>A | p.Ala187Thr | p.A187T | Q7L2Z9 | protein_coding | tolerated(0.72) | benign(0.006) | TCGA-D5-6930-01 | Colorectum | colon adenocarcinoma | Male | >=65 | I/II | Unknown | Unknown | SD | |
| CENPQ | SNV | Missense_Mutation | c.538N>C | p.Lys180Gln | p.K180Q | Q7L2Z9 | protein_coding | tolerated(0.86) | benign(0.086) | TCGA-G4-6314-01 | Colorectum | colon adenocarcinoma | Female | >=65 | III/IV | Ancillary | leucovorin | SD | |
| CENPQ | SNV | Missense_Mutation | novel | c.497T>C | p.Val166Ala | p.V166A | Q7L2Z9 | protein_coding | tolerated(0.2) | probably_damaging(0.998) | TCGA-F5-6814-01 | Colorectum | rectum adenocarcinoma | Male | <65 | I/II | Unknown | Unknown | SD |
| CENPQ | SNV | Missense_Mutation | novel | c.299N>C | p.Ile100Thr | p.I100T | Q7L2Z9 | protein_coding | tolerated(0.39) | benign(0.007) | TCGA-A5-A2K5-01 | Endometrium | uterine corpus endometrioid carcinoma | Female | >=65 | I/II | Unknown | Unknown | SD |
| CENPQ | SNV | Missense_Mutation | novel | c.215N>A | p.Thr72Asn | p.T72N | Q7L2Z9 | protein_coding | tolerated(0.08) | possibly_damaging(0.896) | TCGA-AP-A051-01 | Endometrium | uterine corpus endometrioid carcinoma | Female | >=65 | I/II | Unknown | Unknown | SD |
| CENPQ | SNV | Missense_Mutation | novel | c.137T>G | p.Leu46Arg | p.L46R | Q7L2Z9 | protein_coding | tolerated(0.36) | benign(0) | TCGA-AP-A1E0-01 | Endometrium | uterine corpus endometrioid carcinoma | Female | <65 | III/IV | Chemotherapy | paclitaxel | SD |
| CENPQ | SNV | Missense_Mutation | c.556N>A | p.Leu186Met | p.L186M | Q7L2Z9 | protein_coding | deleterious(0) | probably_damaging(0.979) | TCGA-AX-A0J0-01 | Endometrium | uterine corpus endometrioid carcinoma | Female | <65 | I/II | Unknown | Unknown | SD |
| Page: 1 2 3 |
Top |
Related drugs of malignant transformation related genes |
| Identification of chemicals and drugs interact with genes involved in malignant transfromation |
| (DGIdb 4.0) |
| Entrez ID | Symbol | Category | Interaction Types | Drug Claim Name | Drug Name | PMIDs |
| Page: 1 |

Copyright 2023-Present -The University of Texas Health Science Center at Houston |