
|
|||||
|
 | |
| |
| |
| |
| |
| |
|
Gene: CENPP |
Gene summary for CENPP |
| Gene information | Species | Human | Gene symbol | CENPP | Gene ID | 401541 |
| Gene name | centromere protein P | |
| Gene Alias | CENP-P | |
| Cytomap | 9q22.31 | |
| Gene Type | protein-coding | GO ID | GO:0006323 | UniProtAcc | Q6IPU0 |
Top |
Malignant transformation analysis |
| Identification of the aberrant gene expression in precancerous and cancerous lesions by comparing the gene expression of stem-like cells in diseased tissues with normal stem cells |
| Entrez ID | Symbol | Replicates | Species | Organ | Tissue | Adj P-value | Log2FC | Malignancy |
| 401541 | CENPP | CA_HPV_3 | Human | Cervix | CC | 2.04e-07 | 1.68e-01 | 0.0414 |
| 401541 | CENPP | CCI_1 | Human | Cervix | CC | 3.68e-25 | 1.51e+00 | 0.528 |
| 401541 | CENPP | CCI_2 | Human | Cervix | CC | 3.69e-11 | 1.05e+00 | 0.5249 |
| 401541 | CENPP | CCI_3 | Human | Cervix | CC | 4.38e-38 | 2.13e+00 | 0.516 |
| 401541 | CENPP | CCII_1 | Human | Cervix | CC | 8.50e-10 | 5.05e-01 | 0.3249 |
| 401541 | CENPP | Tumor | Human | Cervix | CC | 1.56e-06 | 1.98e-01 | 0.1241 |
| 401541 | CENPP | sample3 | Human | Cervix | CC | 1.84e-02 | 1.35e-01 | 0.1387 |
| 401541 | CENPP | T3 | Human | Cervix | CC | 2.99e-05 | 1.47e-01 | 0.1389 |
| 401541 | CENPP | AEH-subject3 | Human | Endometrium | AEH | 6.96e-03 | 1.87e-01 | -0.2576 |
| 401541 | CENPP | AEH-subject4 | Human | Endometrium | AEH | 4.18e-03 | 2.43e-01 | -0.2657 |
| 401541 | CENPP | EEC-subject1 | Human | Endometrium | EEC | 3.65e-03 | 2.11e-01 | -0.2682 |
| 401541 | CENPP | EEC-subject5 | Human | Endometrium | EEC | 9.55e-07 | 2.35e-01 | -0.249 |
| 401541 | CENPP | P1T-E | Human | Esophagus | ESCC | 9.10e-06 | 3.91e-01 | 0.0875 |
| 401541 | CENPP | P2T-E | Human | Esophagus | ESCC | 4.30e-10 | 2.63e-01 | 0.1177 |
| 401541 | CENPP | P4T-E | Human | Esophagus | ESCC | 2.71e-02 | 1.14e-01 | 0.1323 |
| 401541 | CENPP | P5T-E | Human | Esophagus | ESCC | 3.75e-03 | 1.15e-01 | 0.1327 |
| 401541 | CENPP | P8T-E | Human | Esophagus | ESCC | 7.90e-03 | 7.75e-02 | 0.0889 |
| 401541 | CENPP | P9T-E | Human | Esophagus | ESCC | 4.46e-11 | 3.18e-01 | 0.1131 |
| 401541 | CENPP | P10T-E | Human | Esophagus | ESCC | 3.22e-45 | 7.85e-01 | 0.116 |
| 401541 | CENPP | P11T-E | Human | Esophagus | ESCC | 1.89e-08 | 4.82e-01 | 0.1426 |
| Page: 1 2 3 4 |
| Tissue | Expression Dynamics | Abbreviation |
| Cervix | 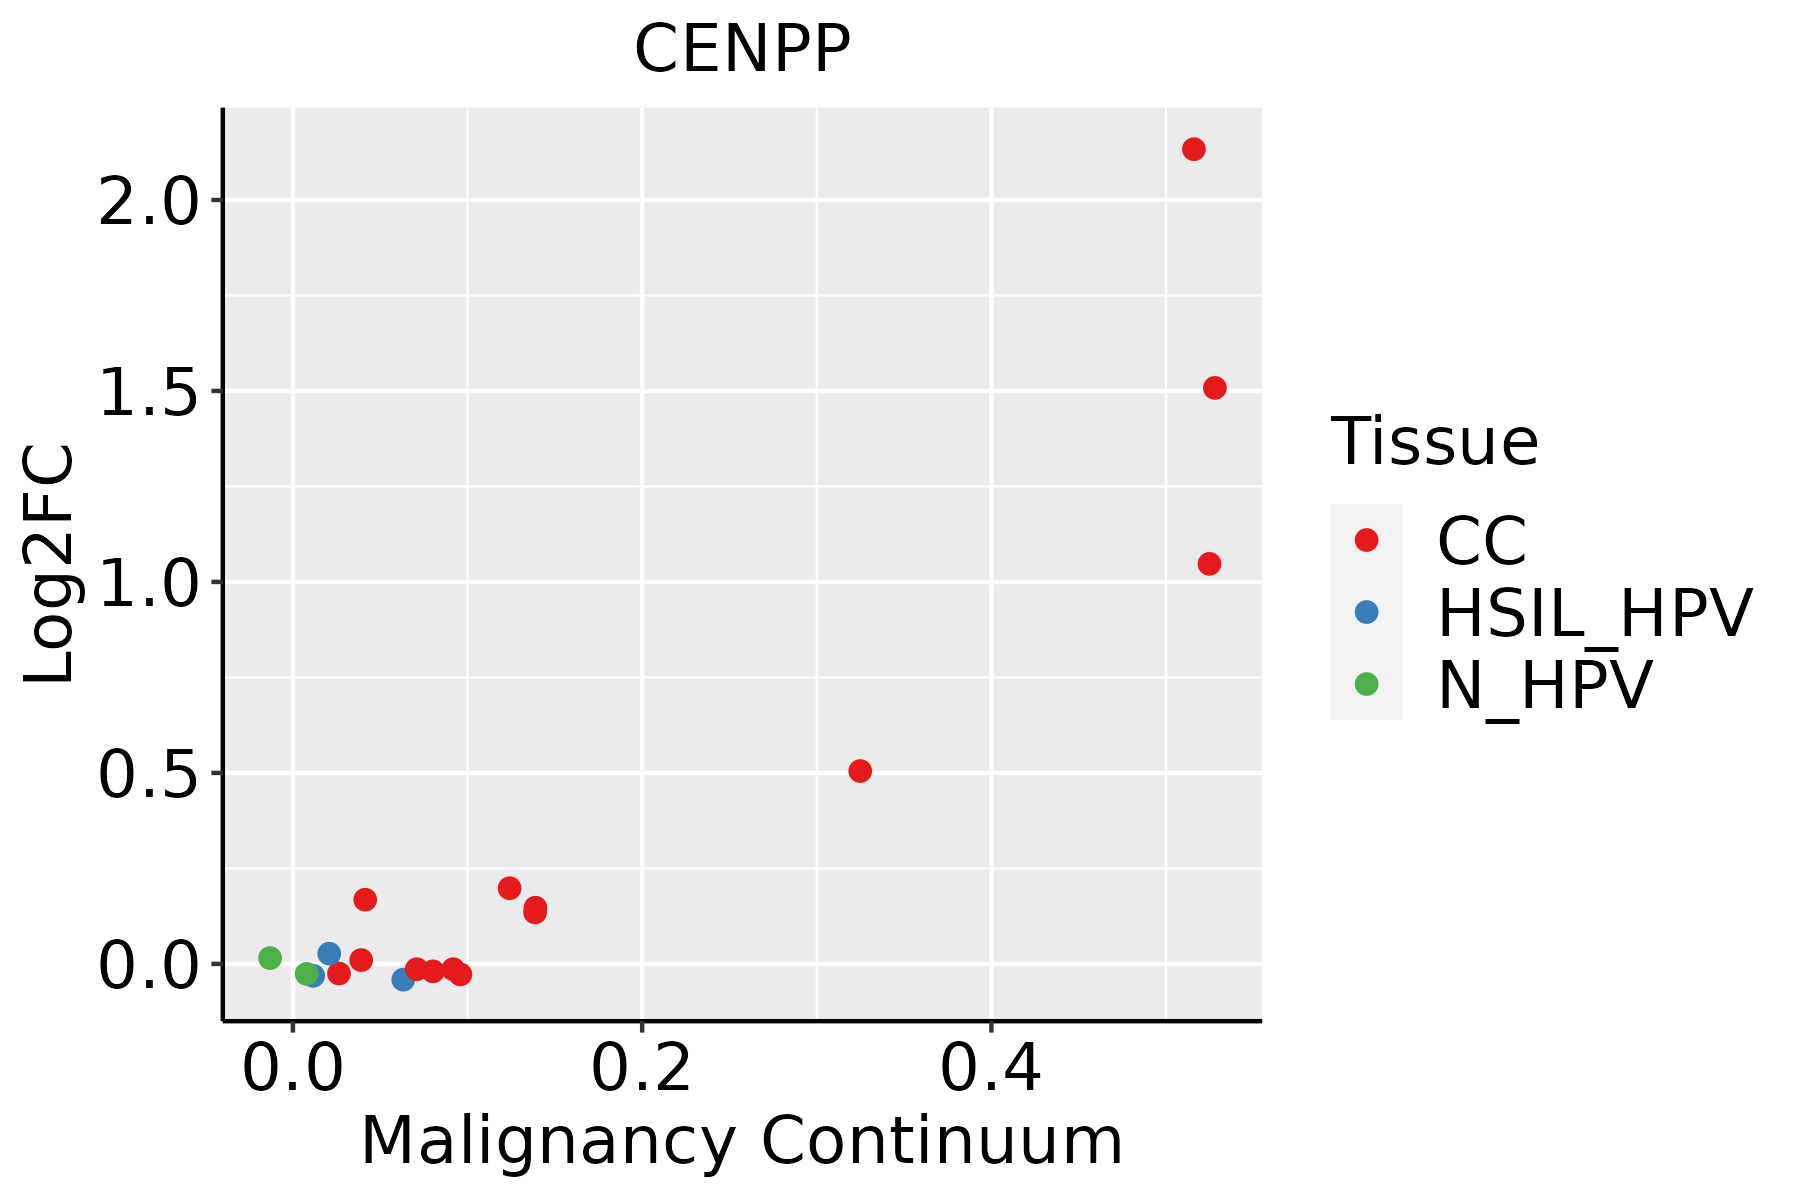 | CC: Cervix cancer |
| HSIL_HPV: HPV-infected high-grade squamous intraepithelial lesions | ||
| N_HPV: HPV-infected normal cervix | ||
| Endometrium | 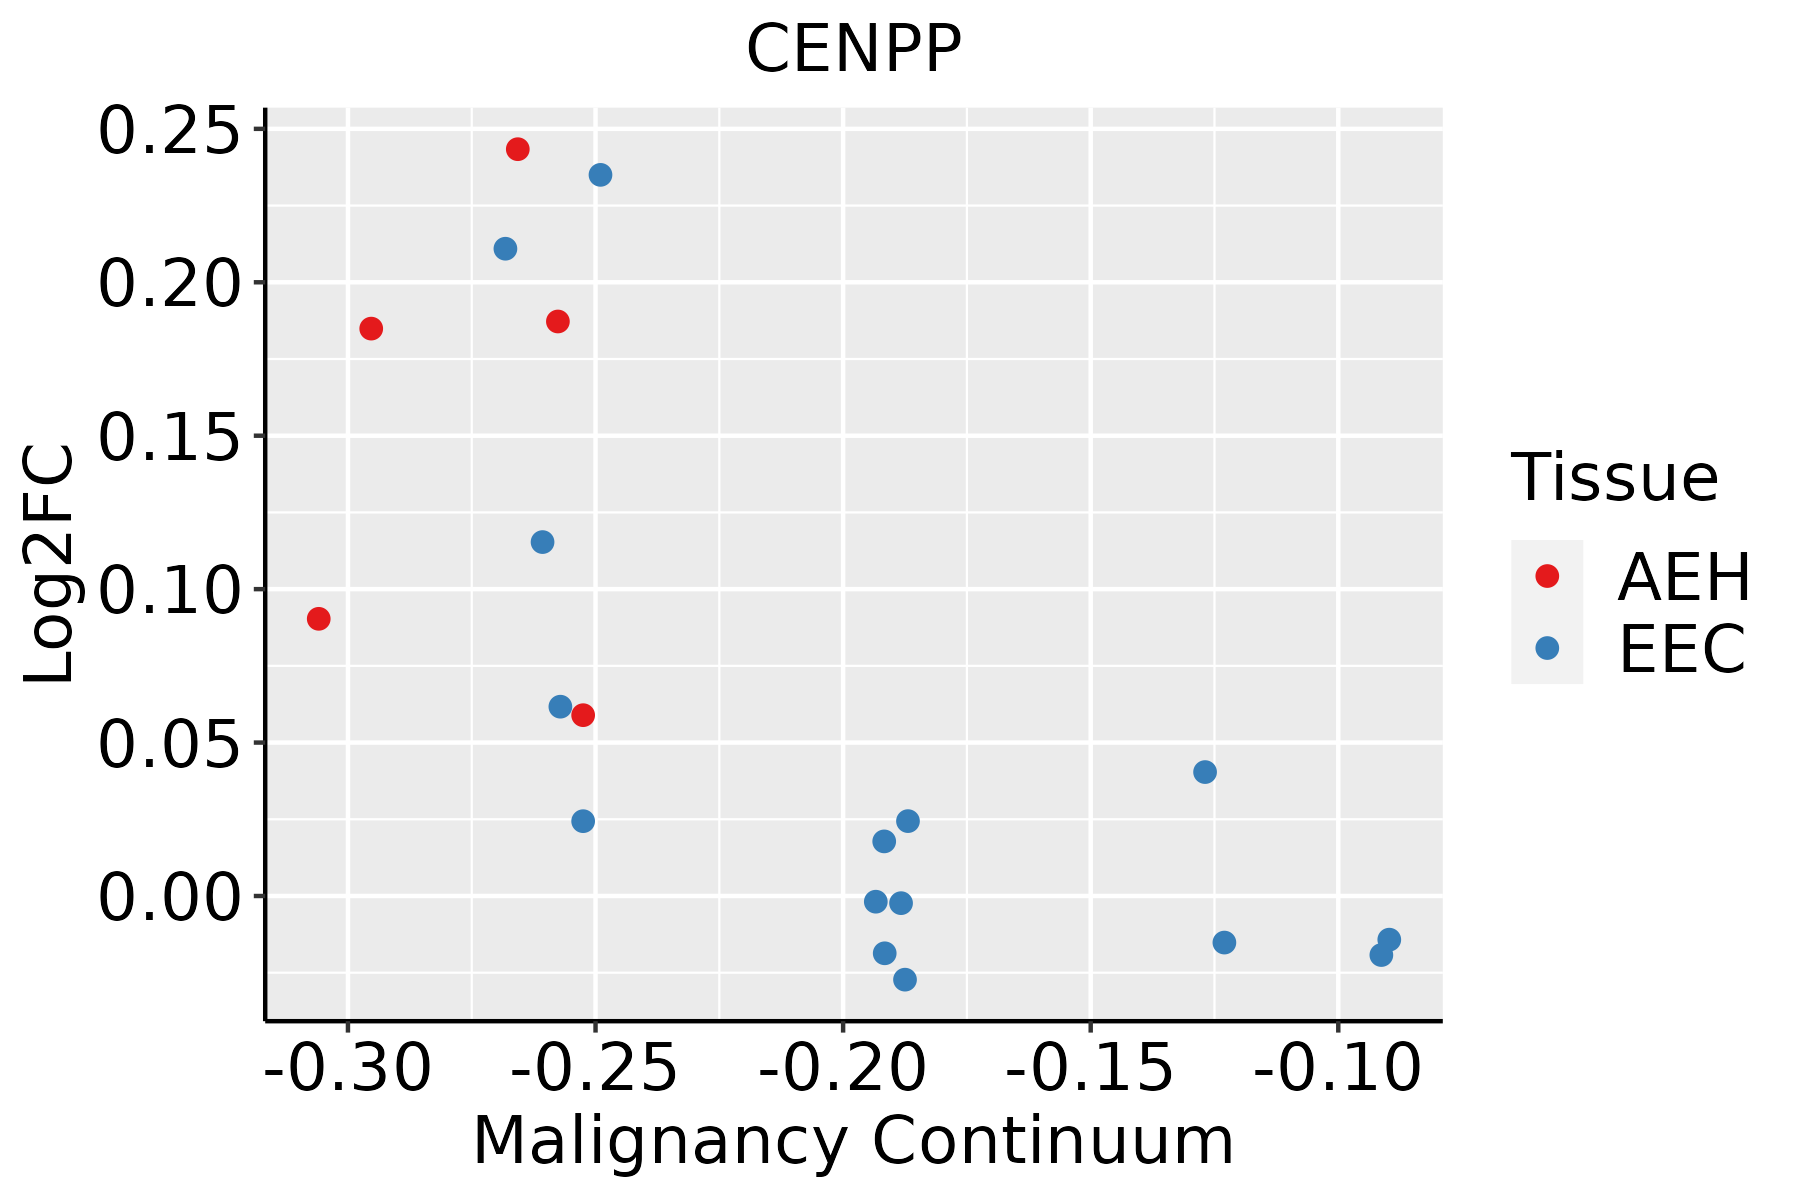 | AEH: Atypical endometrial hyperplasia |
| EEC: Endometrioid Cancer | ||
| Esophagus | 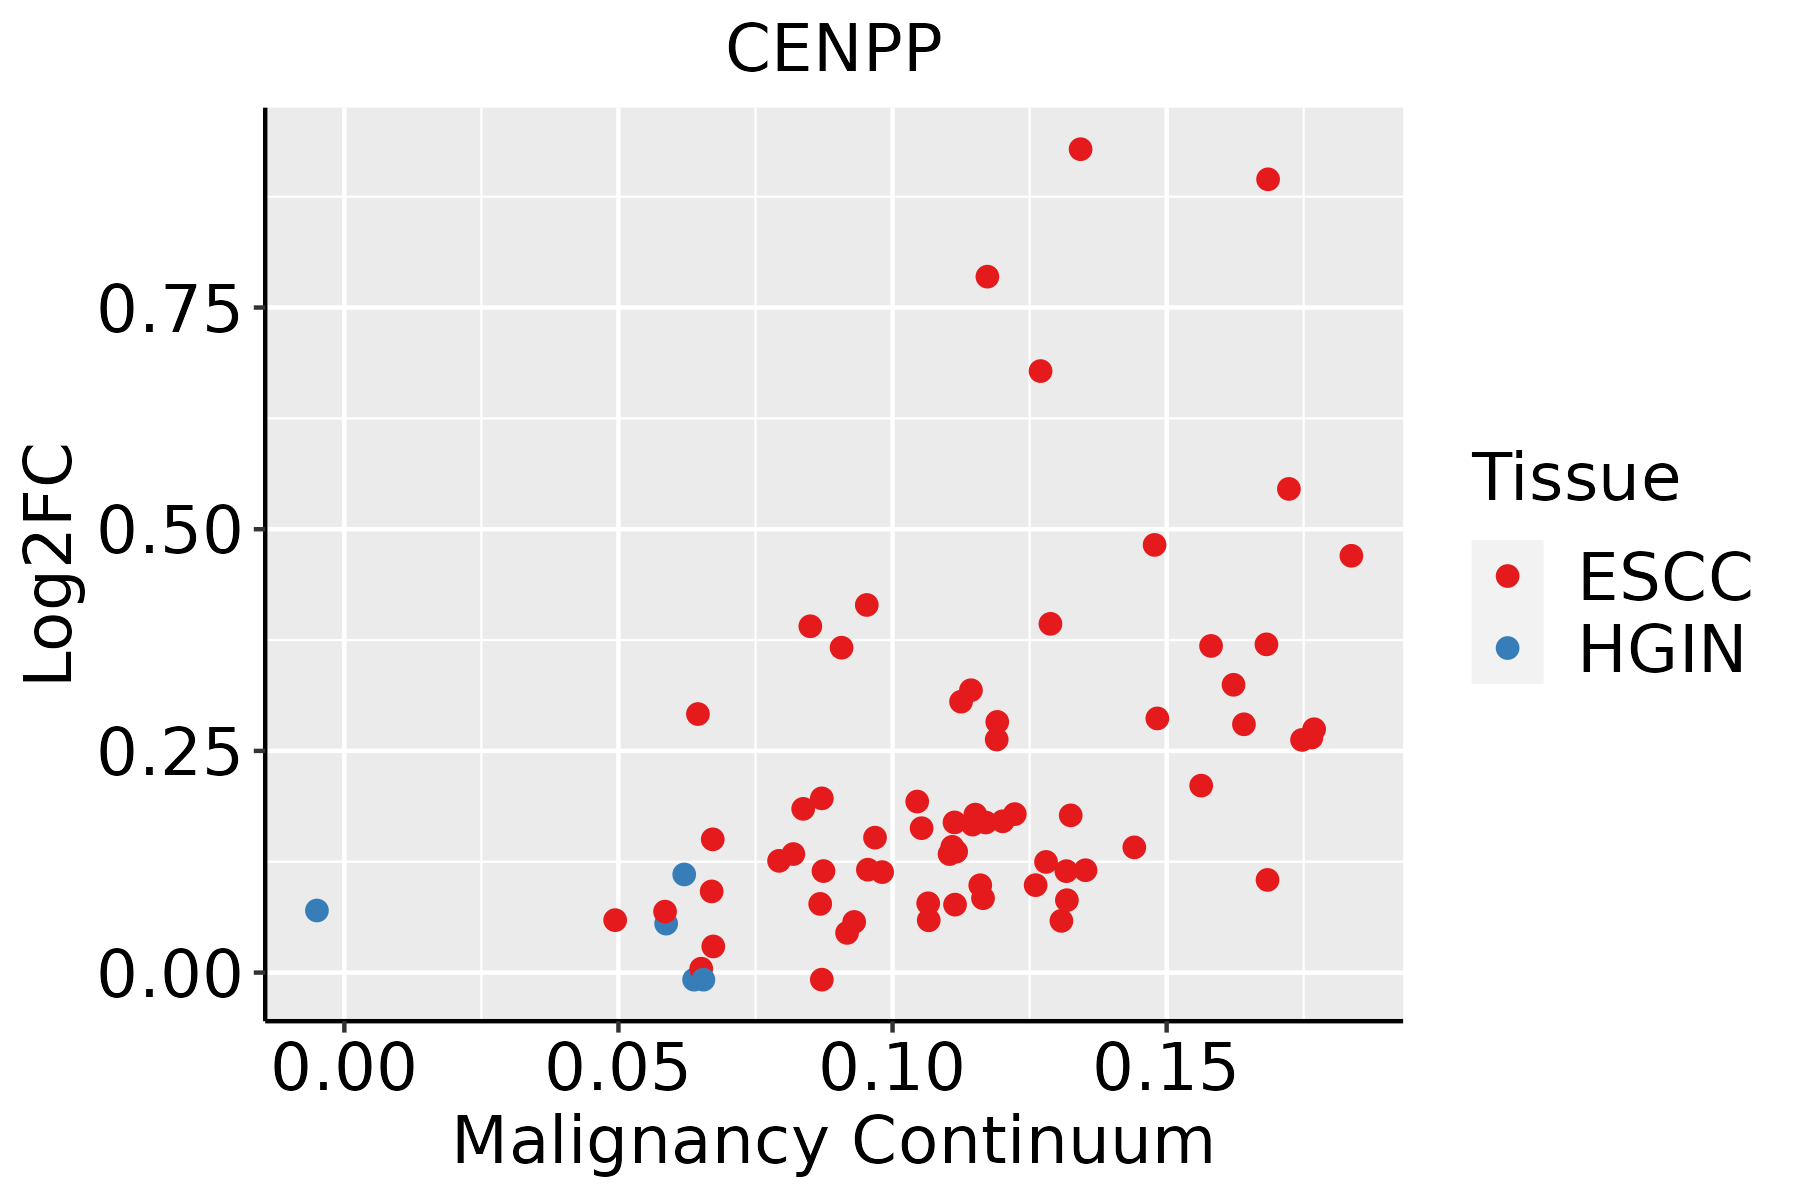 | ESCC: Esophageal squamous cell carcinoma |
| HGIN: High-grade intraepithelial neoplasias | ||
| LGIN: Low-grade intraepithelial neoplasias | ||
| Liver | 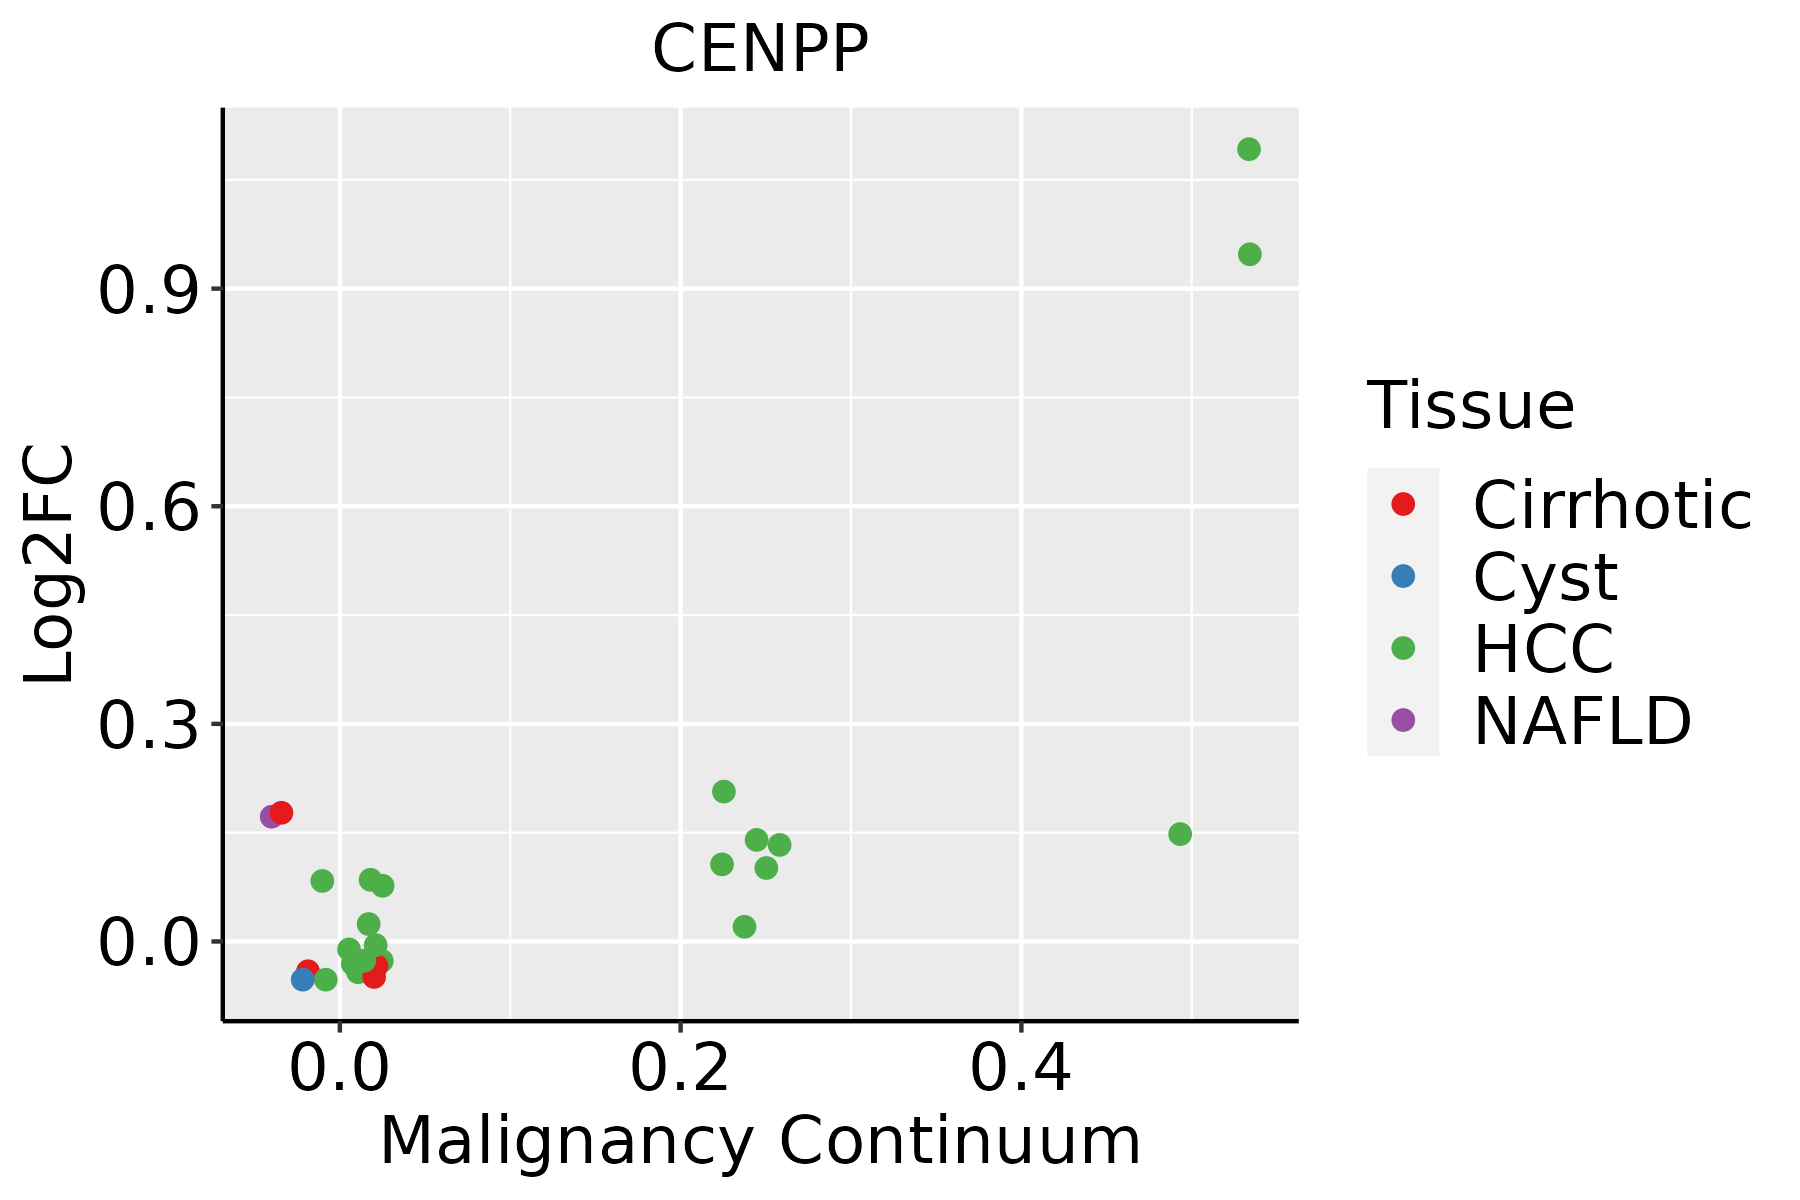 | HCC: Hepatocellular carcinoma |
| NAFLD: Non-alcoholic fatty liver disease | ||
| Oral Cavity | 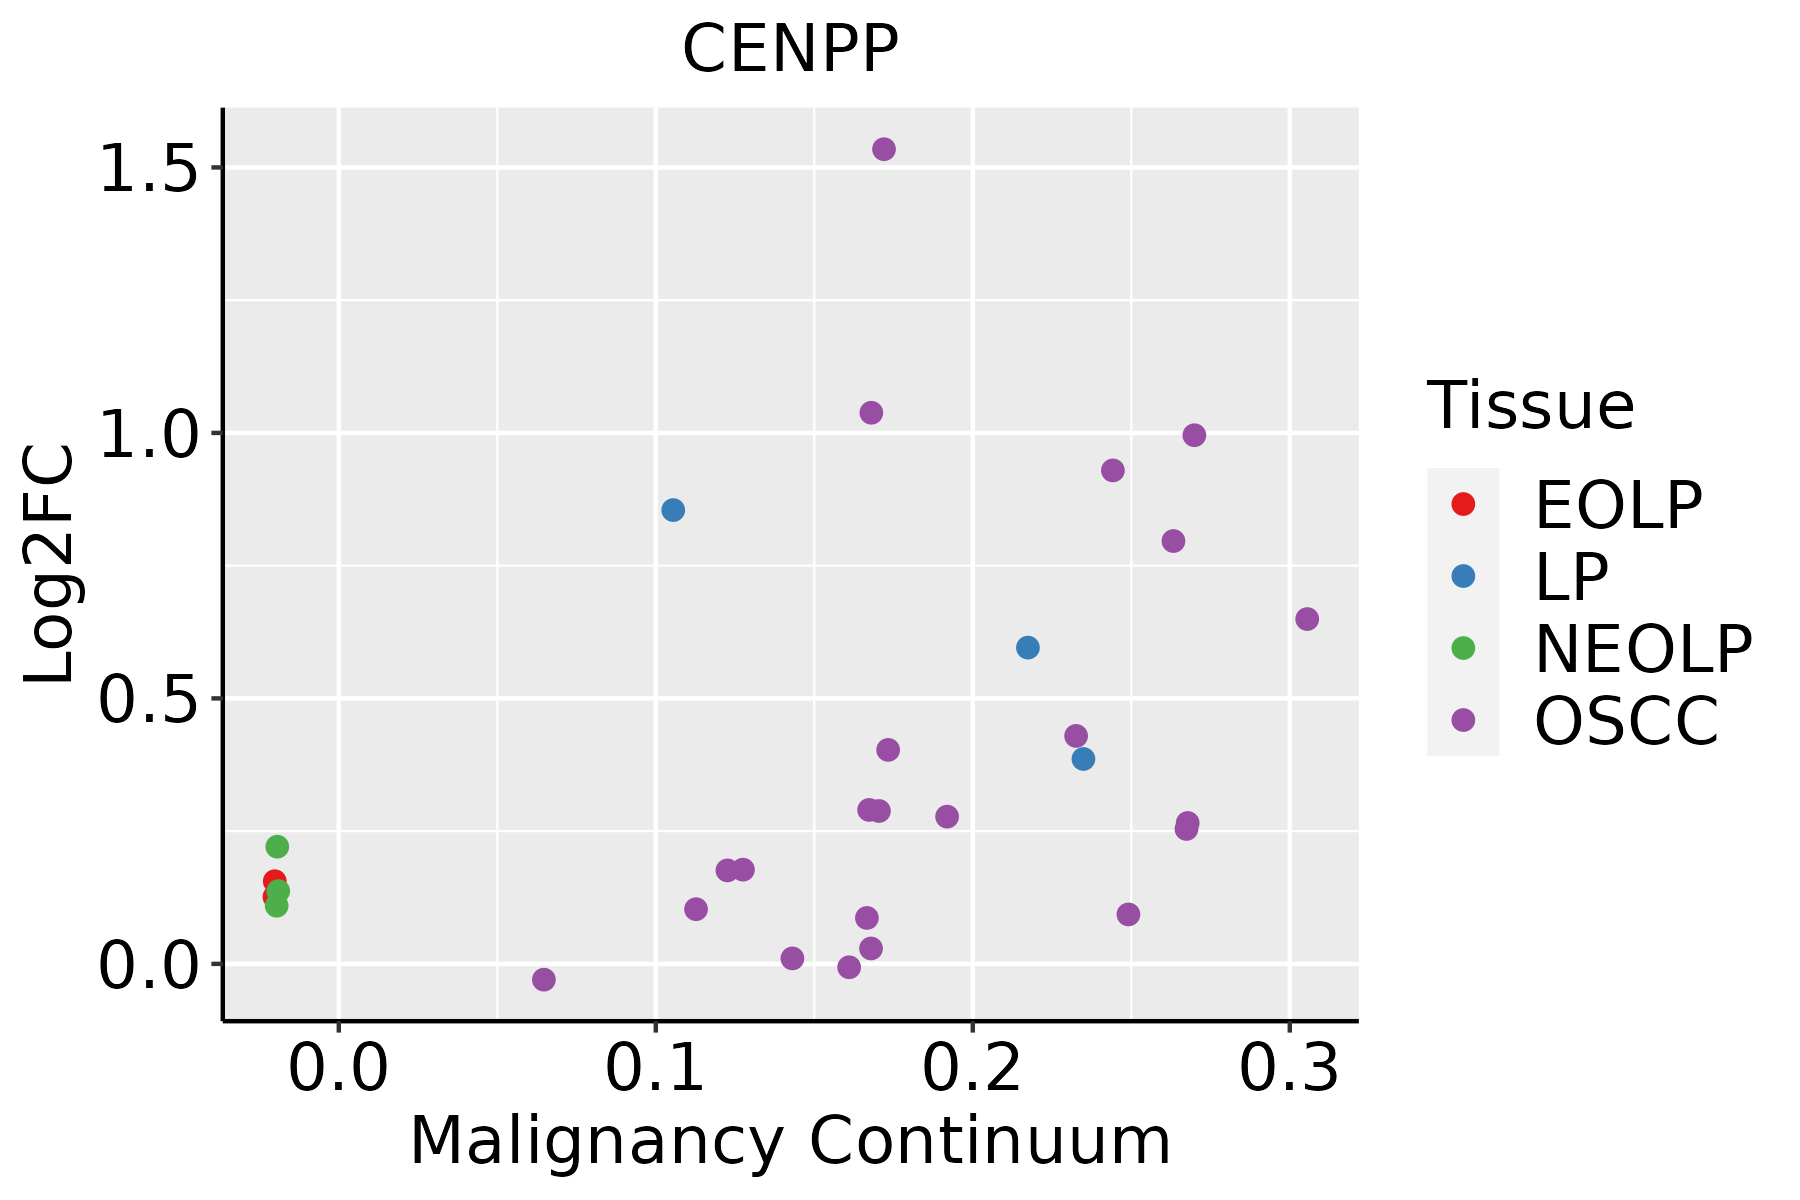 | EOLP: Erosive Oral lichen planus |
| LP: leukoplakia | ||
| NEOLP: Non-erosive oral lichen planus | ||
| OSCC: Oral squamous cell carcinoma | ||
| Skin |  | AK: Actinic keratosis |
| cSCC: Cutaneous squamous cell carcinoma | ||
| SCCIS:squamous cell carcinoma in situ |
| ∗log2FC in expression of this searched gene in stem-like cells from each diseased tissue sample relative to stem-like cells in normal samples in each tissue plotted against the malignancy continuum. Samples are colored based on if they are from different disease stage. |
Top |
Malignant transformation related pathway analysis |
| Find out the enriched GO biological processes and KEGG pathways involved in transition from healthy to precancer to cancer |
| Tissue | Disease Stage | Enriched GO biological Processes |
| Colorectum | AD |  |
| Colorectum | SER |  |
| Colorectum | MSS |  |
| Colorectum | MSI-H |  |
| Colorectum | FAP |  |
| ∗Top 15 enriched GO BP terms are showed in the bar plot of each disease state in each tissue. Each row represents a significant GO biological process which is colored according to the -log10(p.adjust). |
| Page: 1 2 3 4 5 6 7 8 9 |
| GO ID | Tissue | Disease Stage | Description | Gene Ratio | Bg Ratio | pvalue | p.adjust | Count |
| GO:00063257 | Cervix | CC | chromatin organization | 78/2311 | 409/18723 | 5.40e-05 | 8.02e-04 | 78 |
| GO:00063381 | Cervix | CC | chromatin remodeling | 45/2311 | 255/18723 | 8.33e-03 | 4.30e-02 | 45 |
| GO:00063258 | Endometrium | AEH | chromatin organization | 64/2100 | 409/18723 | 3.69e-03 | 2.52e-02 | 64 |
| GO:000632513 | Endometrium | EEC | chromatin organization | 65/2168 | 409/18723 | 4.98e-03 | 3.14e-02 | 65 |
| GO:000632517 | Esophagus | ESCC | chromatin organization | 240/8552 | 409/18723 | 6.52e-08 | 1.14e-06 | 240 |
| GO:00345081 | Esophagus | ESCC | centromere complex assembly | 25/8552 | 30/18723 | 2.45e-05 | 2.09e-04 | 25 |
| GO:0031055 | Esophagus | ESCC | chromatin remodeling at centromere | 9/8552 | 10/18723 | 5.09e-03 | 1.92e-02 | 9 |
| GO:0043486 | Esophagus | ESCC | histone exchange | 16/8552 | 22/18723 | 9.46e-03 | 3.28e-02 | 16 |
| GO:000632511 | Liver | HCC | chromatin organization | 206/7958 | 409/18723 | 7.23e-04 | 4.41e-03 | 206 |
| GO:0034508 | Oral cavity | OSCC | centromere complex assembly | 21/7305 | 30/18723 | 5.75e-04 | 3.30e-03 | 21 |
| GO:000632510 | Oral cavity | OSCC | chromatin organization | 190/7305 | 409/18723 | 1.17e-03 | 5.97e-03 | 190 |
| GO:000632515 | Oral cavity | EOLP | chromatin organization | 84/2218 | 409/18723 | 2.68e-07 | 8.16e-06 | 84 |
| GO:00063383 | Oral cavity | EOLP | chromatin remodeling | 46/2218 | 255/18723 | 2.34e-03 | 1.44e-02 | 46 |
| GO:000632518 | Skin | AK | chromatin organization | 73/1910 | 409/18723 | 1.40e-06 | 4.26e-05 | 73 |
| GO:00063384 | Skin | AK | chromatin remodeling | 51/1910 | 255/18723 | 1.95e-06 | 5.73e-05 | 51 |
| GO:0071103 | Skin | AK | DNA conformation change | 47/1910 | 290/18723 | 9.43e-04 | 7.61e-03 | 47 |
| GO:0071824 | Skin | AK | protein-DNA complex subunit organization | 38/1910 | 241/18723 | 4.43e-03 | 2.57e-02 | 38 |
| GO:000632519 | Skin | cSCC | chromatin organization | 147/4864 | 409/18723 | 4.41e-06 | 6.52e-05 | 147 |
| GO:000633812 | Skin | cSCC | chromatin remodeling | 94/4864 | 255/18723 | 7.58e-05 | 7.26e-04 | 94 |
| GO:00718241 | Skin | cSCC | protein-DNA complex subunit organization | 87/4864 | 241/18723 | 3.09e-04 | 2.47e-03 | 87 |
| Page: 1 2 |
| Pathway ID | Tissue | Disease Stage | Description | Gene Ratio | Bg Ratio | pvalue | p.adjust | qvalue | Count |
| Page: 1 |
Top |
Cell-cell communication analysis |
| Identification of potential cell-cell interactions between two cell types and their ligand-receptor pairs for different disease states |
| Ligand | Receptor | LRpair | Pathway | Tissue | Disease Stage |
| Page: 1 |
Top |
Single-cell gene regulatory network inference analysis |
| Find out the significant the regulons (TFs) and the target genes of each regulon across cell types for different disease states |
| TF | Cell Type | Tissue | Disease Stage | Target Gene | RSS | Regulon Activity |
| ∗The dot plots of a searched regulon are shown for all cell subpopulations in each disease state of each tissue based on the regulon specific score inferred using pySCENIC and by calculating the average expression. |
| Page: 1 |
Top |
Somatic mutation of malignant transformation related genes |
| Annotation of somatic variants for genes involved in malignant transformation |
| Hugo Symbol | Variant Class | Variant Classification | dbSNP RS | HGVSc | HGVSp | HGVSp Short | SWISSPROT | BIOTYPE | SIFT | PolyPhen | Tumor Sample Barcode | Tissue | Histology | Sex | Age | Stage | Therapy Types | Drugs | Outcome |
| CENPP | insertion | In_Frame_Ins | novel | c.728_729insTCAACTCAACTGGTTTCCAAGCTTTAA | p.Gln244_Arg245insLeuAsnTrpPheProSerPheLysGln | p.Q244_R245insLNWFPSFKQ | Q6IPU0 | protein_coding | TCGA-A8-A0AB-01 | Breast | breast invasive carcinoma | Female | <65 | I/II | Chemotherapy | 5-fluorouracil | CR | ||
| CENPP | SNV | Missense_Mutation | c.581N>T | p.Ala194Val | p.A194V | Q6IPU0 | protein_coding | tolerated(1) | benign(0.001) | TCGA-AA-3710-01 | Colorectum | colon adenocarcinoma | Female | >=65 | I/II | Unknown | Unknown | SD | |
| CENPP | SNV | Missense_Mutation | novel | c.572A>G | p.Tyr191Cys | p.Y191C | Q6IPU0 | protein_coding | deleterious(0) | probably_damaging(0.998) | TCGA-AA-A00N-01 | Colorectum | colon adenocarcinoma | Male | >=65 | I/II | Unknown | Unknown | PD |
| CENPP | SNV | Missense_Mutation | novel | c.109A>G | p.Lys37Glu | p.K37E | Q6IPU0 | protein_coding | tolerated(0.08) | benign(0.058) | TCGA-CA-6717-01 | Colorectum | colon adenocarcinoma | Male | <65 | I/II | Chemotherapy | oxaliplatin | CR |
| CENPP | insertion | Frame_Shift_Ins | novel | c.512_513insT | p.Val174CysfsTer5 | p.V174Cfs*5 | Q6IPU0 | protein_coding | TCGA-5M-AAT6-01 | Colorectum | colon adenocarcinoma | Female | <65 | III/IV | Unknown | Unknown | PD | ||
| CENPP | deletion | Frame_Shift_Del | rs750494120 | c.519delT | p.Phe173LeufsTer46 | p.F173Lfs*46 | Q6IPU0 | protein_coding | TCGA-AZ-6598-01 | Colorectum | colon adenocarcinoma | Female | >=65 | I/II | Unknown | Unknown | SD | ||
| CENPP | SNV | Missense_Mutation | novel | c.559N>A | p.Leu187Ile | p.L187I | Q6IPU0 | protein_coding | deleterious(0) | benign(0.037) | TCGA-AJ-A5DW-01 | Endometrium | uterine corpus endometrioid carcinoma | Female | <65 | I/II | Unknown | Unknown | SD |
| CENPP | SNV | Missense_Mutation | c.389N>T | p.Arg130Ile | p.R130I | Q6IPU0 | protein_coding | deleterious(0.05) | benign(0.114) | TCGA-AP-A059-01 | Endometrium | uterine corpus endometrioid carcinoma | Female | >=65 | I/II | Unknown | Unknown | SD | |
| CENPP | SNV | Missense_Mutation | c.296N>T | p.Arg99Ile | p.R99I | Q6IPU0 | protein_coding | deleterious(0.03) | benign(0.031) | TCGA-AX-A0J0-01 | Endometrium | uterine corpus endometrioid carcinoma | Female | <65 | I/II | Unknown | Unknown | SD | |
| CENPP | SNV | Missense_Mutation | novel | c.71N>G | p.Asp24Gly | p.D24G | Q6IPU0 | protein_coding | tolerated(0.07) | benign(0.033) | TCGA-DI-A1BU-01 | Endometrium | uterine corpus endometrioid carcinoma | Female | <65 | I/II | Chemotherapy | paclitaxel | SD |
| Page: 1 2 3 4 |
Top |
Related drugs of malignant transformation related genes |
| Identification of chemicals and drugs interact with genes involved in malignant transfromation |
| (DGIdb 4.0) |
| Entrez ID | Symbol | Category | Interaction Types | Drug Claim Name | Drug Name | PMIDs |
| Page: 1 |

Copyright 2023-Present -The University of Texas Health Science Center at Houston |