
|
|||||
|
 | |
| |
| |
| |
| |
| |
|
Gene: CENPN |
Gene summary for CENPN |
| Gene information | Species | Human | Gene symbol | CENPN | Gene ID | 55839 |
| Gene name | centromere protein N | |
| Gene Alias | BM039 | |
| Cytomap | 16q23.2 | |
| Gene Type | protein-coding | GO ID | GO:0006996 | UniProtAcc | Q96H22 |
Top |
Malignant transformation analysis |
| Identification of the aberrant gene expression in precancerous and cancerous lesions by comparing the gene expression of stem-like cells in diseased tissues with normal stem cells |
| Entrez ID | Symbol | Replicates | Species | Organ | Tissue | Adj P-value | Log2FC | Malignancy |
| 55839 | CENPN | LZE2T | Human | Esophagus | ESCC | 4.77e-03 | 4.12e-01 | 0.082 |
| 55839 | CENPN | LZE4T | Human | Esophagus | ESCC | 9.76e-03 | 3.70e-01 | 0.0811 |
| 55839 | CENPN | LZE7T | Human | Esophagus | ESCC | 2.97e-03 | 3.14e-01 | 0.0667 |
| 55839 | CENPN | LZE6T | Human | Esophagus | ESCC | 4.61e-04 | 3.01e-01 | 0.0845 |
| 55839 | CENPN | P1T-E | Human | Esophagus | ESCC | 1.04e-04 | 3.28e-01 | 0.0875 |
| 55839 | CENPN | P2T-E | Human | Esophagus | ESCC | 2.69e-09 | 3.98e-01 | 0.1177 |
| 55839 | CENPN | P4T-E | Human | Esophagus | ESCC | 1.13e-16 | 5.51e-01 | 0.1323 |
| 55839 | CENPN | P5T-E | Human | Esophagus | ESCC | 1.93e-37 | 8.31e-01 | 0.1327 |
| 55839 | CENPN | P8T-E | Human | Esophagus | ESCC | 6.45e-03 | 8.82e-02 | 0.0889 |
| 55839 | CENPN | P9T-E | Human | Esophagus | ESCC | 3.18e-10 | 2.06e-01 | 0.1131 |
| 55839 | CENPN | P10T-E | Human | Esophagus | ESCC | 1.24e-09 | 2.84e-01 | 0.116 |
| 55839 | CENPN | P11T-E | Human | Esophagus | ESCC | 5.65e-03 | 3.99e-01 | 0.1426 |
| 55839 | CENPN | P12T-E | Human | Esophagus | ESCC | 1.14e-09 | 3.87e-01 | 0.1122 |
| 55839 | CENPN | P15T-E | Human | Esophagus | ESCC | 1.22e-23 | 7.47e-01 | 0.1149 |
| 55839 | CENPN | P16T-E | Human | Esophagus | ESCC | 7.83e-03 | 1.49e-01 | 0.1153 |
| 55839 | CENPN | P17T-E | Human | Esophagus | ESCC | 6.97e-12 | 8.00e-01 | 0.1278 |
| 55839 | CENPN | P20T-E | Human | Esophagus | ESCC | 9.65e-06 | 2.37e-01 | 0.1124 |
| 55839 | CENPN | P21T-E | Human | Esophagus | ESCC | 8.18e-18 | 4.88e-01 | 0.1617 |
| 55839 | CENPN | P22T-E | Human | Esophagus | ESCC | 3.25e-13 | 5.36e-01 | 0.1236 |
| 55839 | CENPN | P23T-E | Human | Esophagus | ESCC | 7.66e-19 | 7.14e-01 | 0.108 |
| Page: 1 2 3 4 5 |
| Tissue | Expression Dynamics | Abbreviation |
| Esophagus | 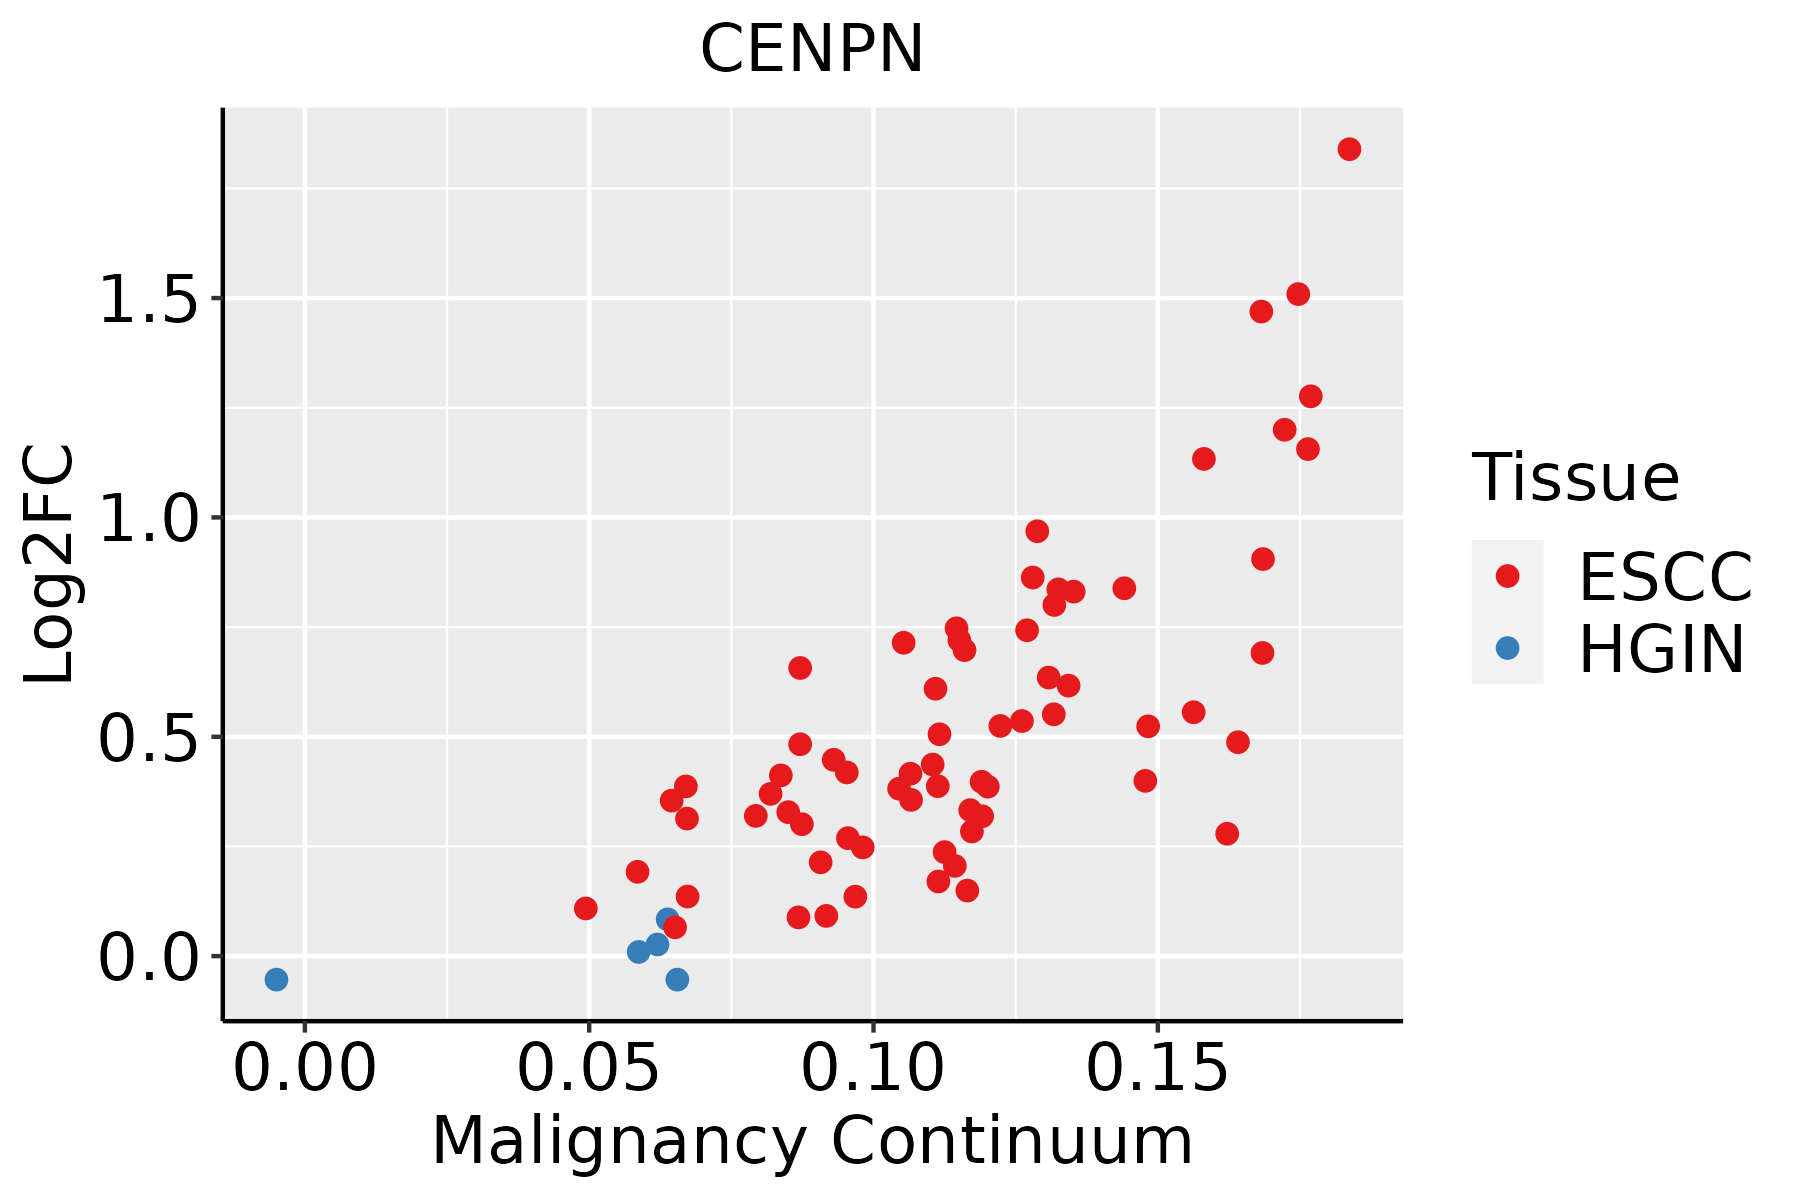 | ESCC: Esophageal squamous cell carcinoma |
| HGIN: High-grade intraepithelial neoplasias | ||
| LGIN: Low-grade intraepithelial neoplasias | ||
| Liver | 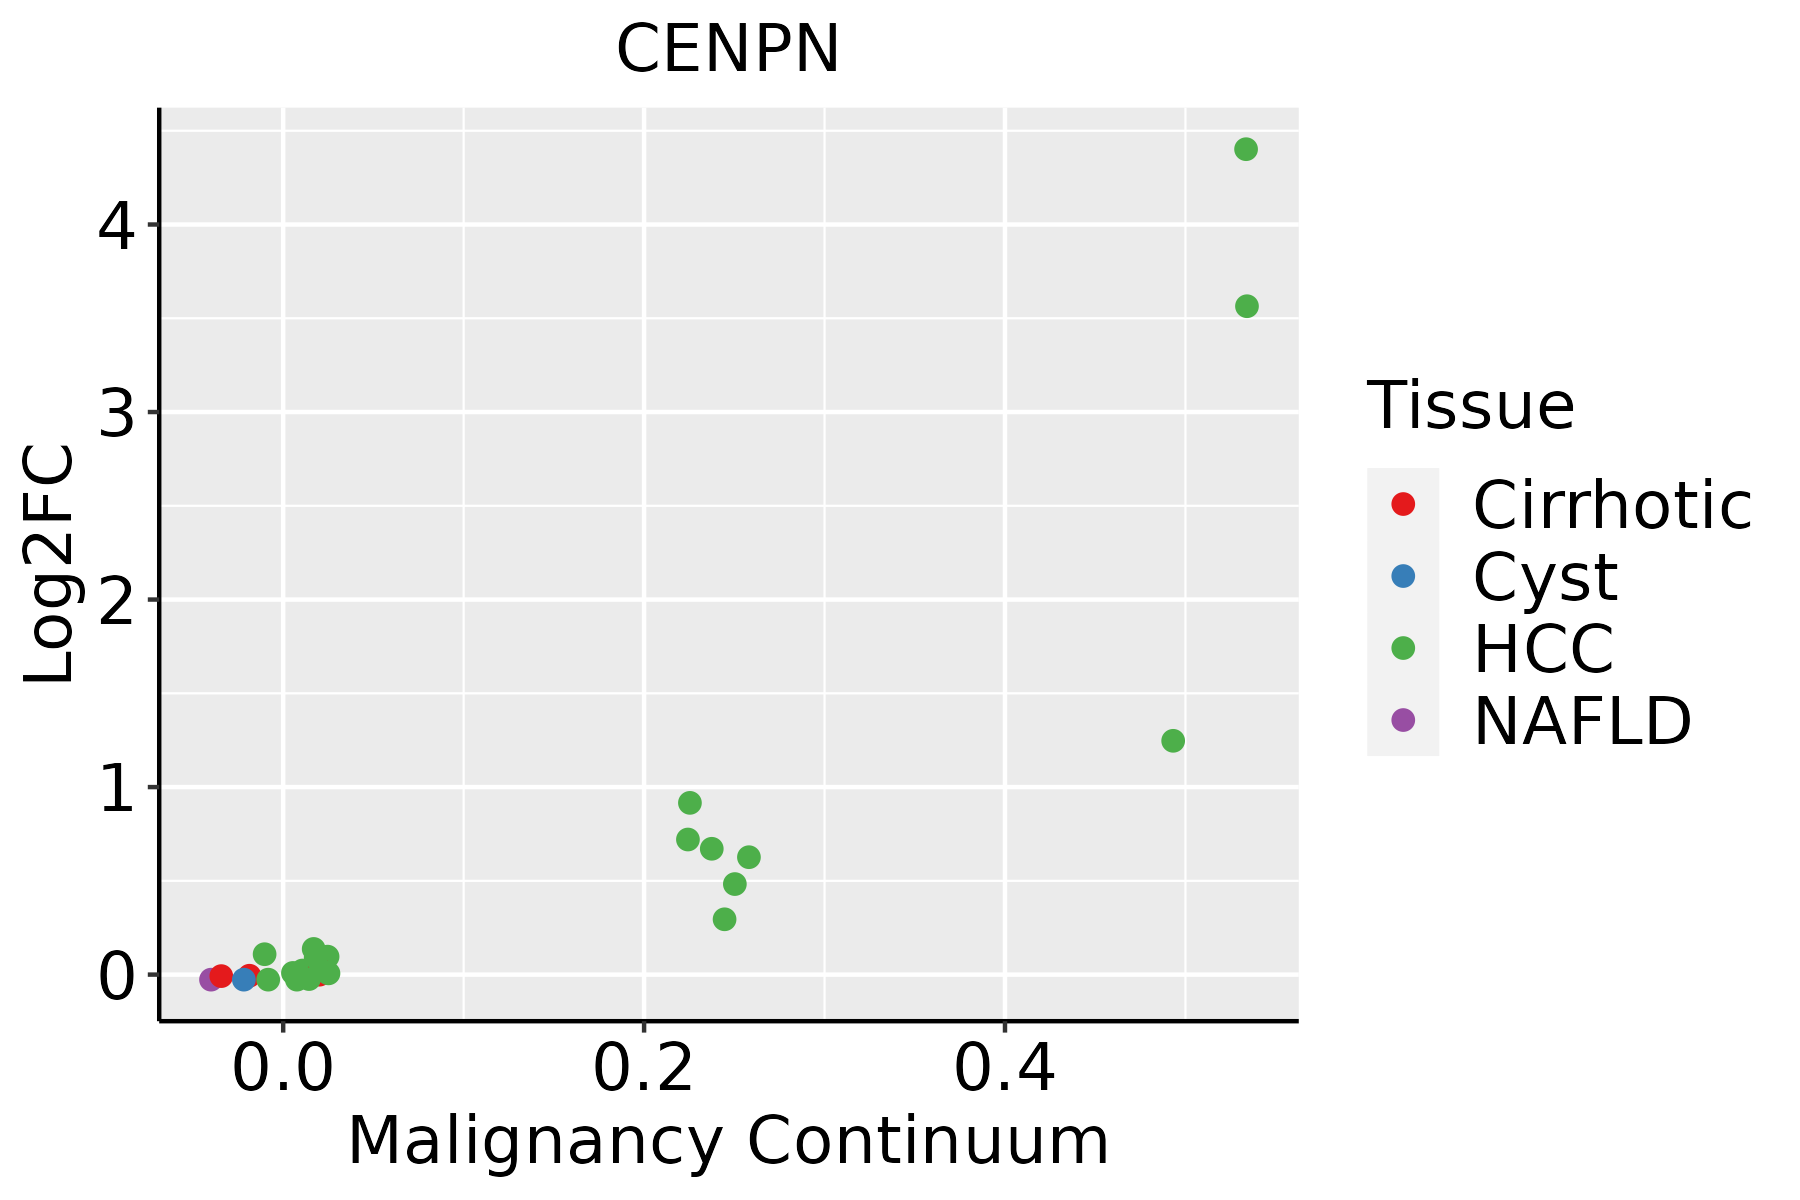 | HCC: Hepatocellular carcinoma |
| NAFLD: Non-alcoholic fatty liver disease | ||
| Oral Cavity | 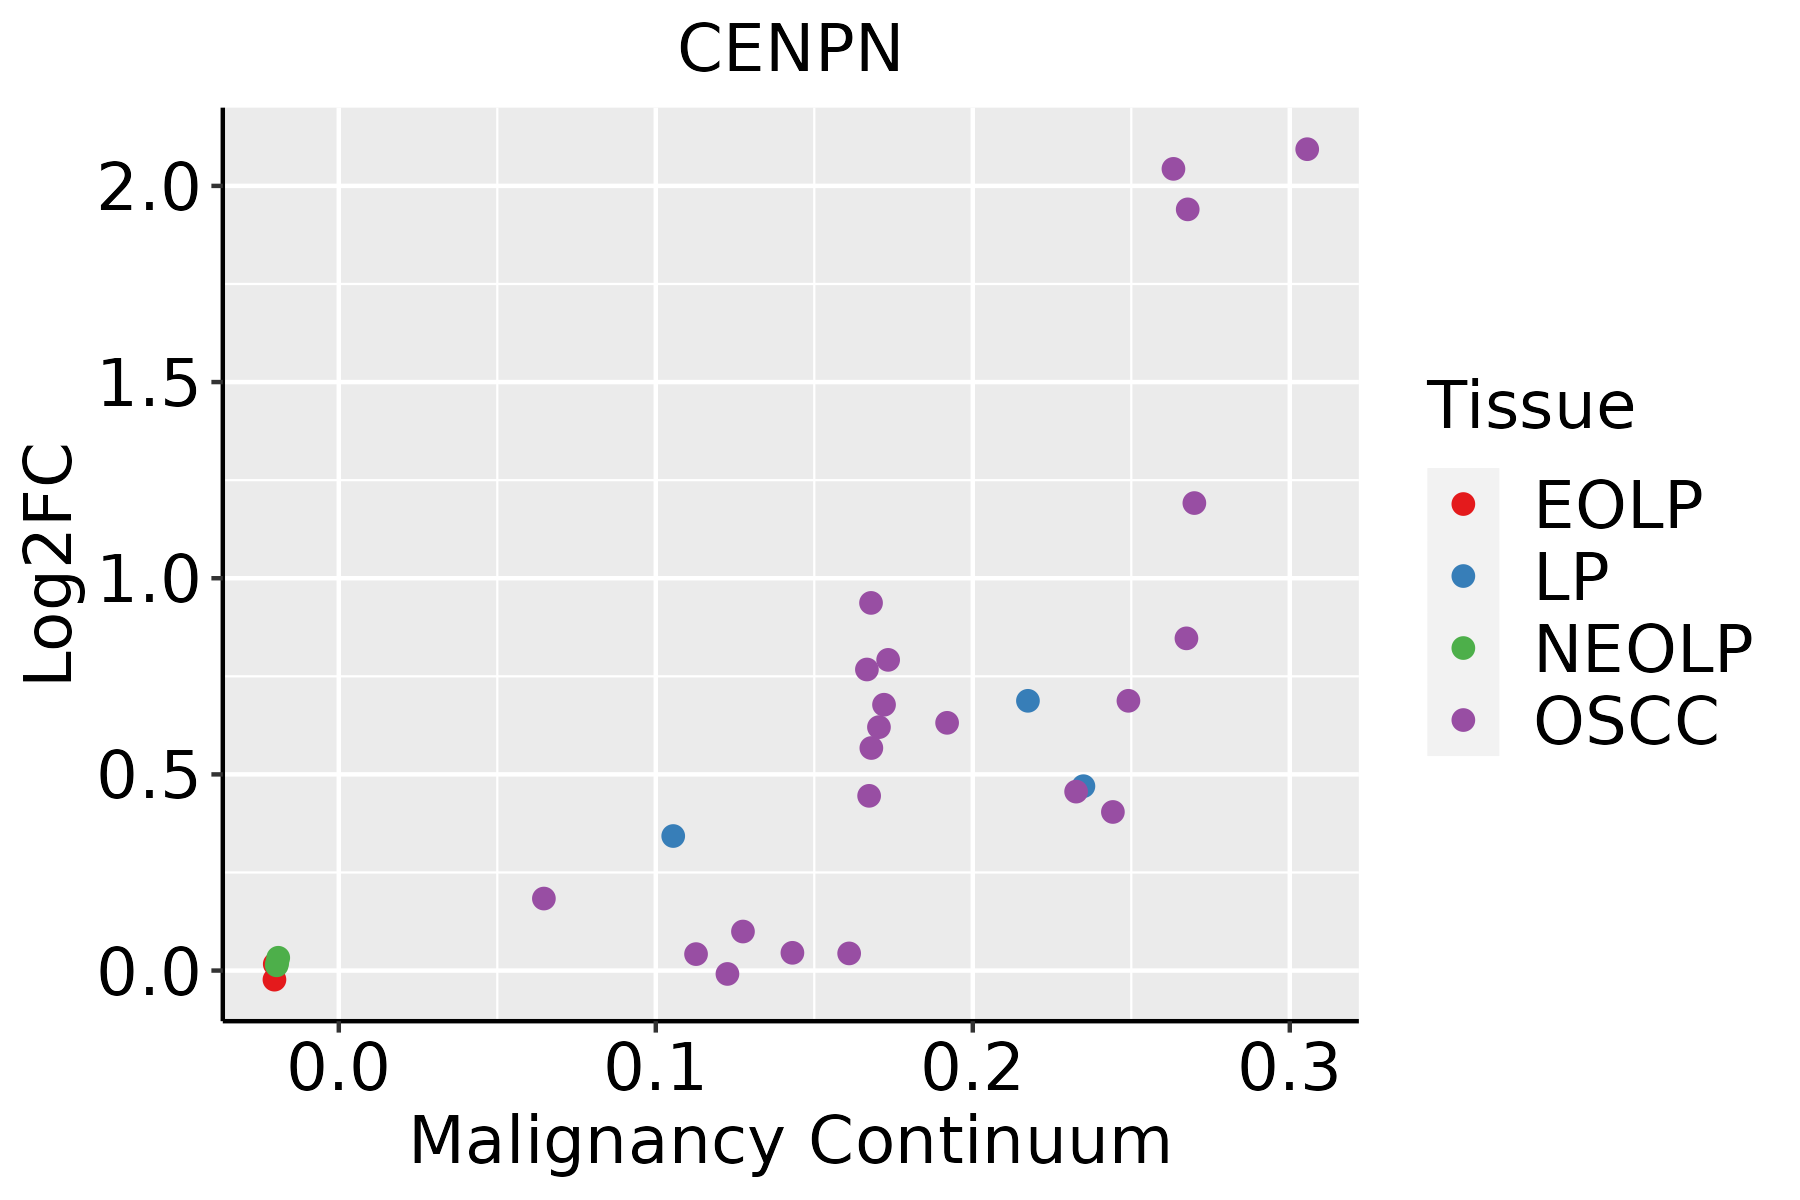 | EOLP: Erosive Oral lichen planus |
| LP: leukoplakia | ||
| NEOLP: Non-erosive oral lichen planus | ||
| OSCC: Oral squamous cell carcinoma | ||
| Skin |  | AK: Actinic keratosis |
| cSCC: Cutaneous squamous cell carcinoma | ||
| SCCIS:squamous cell carcinoma in situ | ||
| Thyroid |  | ATC: Anaplastic thyroid cancer |
| HT: Hashimoto's thyroiditis | ||
| PTC: Papillary thyroid cancer |
| ∗log2FC in expression of this searched gene in stem-like cells from each diseased tissue sample relative to stem-like cells in normal samples in each tissue plotted against the malignancy continuum. Samples are colored based on if they are from different disease stage. |
Top |
Malignant transformation related pathway analysis |
| Find out the enriched GO biological processes and KEGG pathways involved in transition from healthy to precancer to cancer |
| Tissue | Disease Stage | Enriched GO biological Processes |
| Colorectum | AD |  |
| Colorectum | SER |  |
| Colorectum | MSS |  |
| Colorectum | MSI-H |  |
| Colorectum | FAP |  |
| ∗Top 15 enriched GO BP terms are showed in the bar plot of each disease state in each tissue. Each row represents a significant GO biological process which is colored according to the -log10(p.adjust). |
| Page: 1 2 3 4 5 6 7 8 9 |
| GO ID | Tissue | Disease Stage | Description | Gene Ratio | Bg Ratio | pvalue | p.adjust | Count |
| GO:000705911 | Esophagus | ESCC | chromosome segregation | 238/8552 | 346/18723 | 1.72e-18 | 1.82e-16 | 238 |
| GO:00513831 | Esophagus | ESCC | kinetochore organization | 21/8552 | 23/18723 | 5.69e-06 | 5.90e-05 | 21 |
| GO:00345081 | Esophagus | ESCC | centromere complex assembly | 25/8552 | 30/18723 | 2.45e-05 | 2.09e-04 | 25 |
| GO:00513821 | Esophagus | ESCC | kinetochore assembly | 16/8552 | 18/18723 | 1.78e-04 | 1.15e-03 | 16 |
| GO:0007059 | Liver | HCC | chromosome segregation | 197/7958 | 346/18723 | 3.57e-08 | 7.87e-07 | 197 |
| GO:00070592 | Oral cavity | OSCC | chromosome segregation | 206/7305 | 346/18723 | 5.82e-15 | 3.76e-13 | 206 |
| GO:0051383 | Oral cavity | OSCC | kinetochore organization | 18/7305 | 23/18723 | 1.47e-04 | 1.04e-03 | 18 |
| GO:0034508 | Oral cavity | OSCC | centromere complex assembly | 21/7305 | 30/18723 | 5.75e-04 | 3.30e-03 | 21 |
| GO:0051382 | Oral cavity | OSCC | kinetochore assembly | 14/7305 | 18/18723 | 9.51e-04 | 4.96e-03 | 14 |
| GO:00070591 | Oral cavity | LP | chromosome segregation | 117/4623 | 346/18723 | 7.61e-05 | 9.91e-04 | 117 |
| GO:000705912 | Skin | cSCC | chromosome segregation | 161/4864 | 346/18723 | 8.34e-17 | 8.57e-15 | 161 |
| GO:00513832 | Skin | cSCC | kinetochore organization | 15/4864 | 23/18723 | 8.72e-05 | 8.21e-04 | 15 |
| GO:00718241 | Skin | cSCC | protein-DNA complex subunit organization | 87/4864 | 241/18723 | 3.09e-04 | 2.47e-03 | 87 |
| GO:00345082 | Skin | cSCC | centromere complex assembly | 16/4864 | 30/18723 | 1.27e-03 | 8.19e-03 | 16 |
| GO:00513822 | Skin | cSCC | kinetochore assembly | 11/4864 | 18/18723 | 1.74e-03 | 1.06e-02 | 11 |
| GO:000705913 | Thyroid | ATC | chromosome segregation | 183/6293 | 346/18723 | 8.03e-14 | 4.23e-12 | 183 |
| GO:00513833 | Thyroid | ATC | kinetochore organization | 18/6293 | 23/18723 | 1.47e-05 | 1.39e-04 | 18 |
| GO:00513823 | Thyroid | ATC | kinetochore assembly | 15/6293 | 18/18723 | 2.06e-05 | 1.85e-04 | 15 |
| GO:00345083 | Thyroid | ATC | centromere complex assembly | 20/6293 | 30/18723 | 2.18e-04 | 1.43e-03 | 20 |
| GO:00718242 | Thyroid | ATC | protein-DNA complex subunit organization | 103/6293 | 241/18723 | 1.84e-03 | 9.03e-03 | 103 |
| Page: 1 |
| Pathway ID | Tissue | Disease Stage | Description | Gene Ratio | Bg Ratio | pvalue | p.adjust | qvalue | Count |
| Page: 1 |
Top |
Cell-cell communication analysis |
| Identification of potential cell-cell interactions between two cell types and their ligand-receptor pairs for different disease states |
| Ligand | Receptor | LRpair | Pathway | Tissue | Disease Stage |
| Page: 1 |
Top |
Single-cell gene regulatory network inference analysis |
| Find out the significant the regulons (TFs) and the target genes of each regulon across cell types for different disease states |
| TF | Cell Type | Tissue | Disease Stage | Target Gene | RSS | Regulon Activity |
| ∗The dot plots of a searched regulon are shown for all cell subpopulations in each disease state of each tissue based on the regulon specific score inferred using pySCENIC and by calculating the average expression. |
| Page: 1 |
Top |
Somatic mutation of malignant transformation related genes |
| Annotation of somatic variants for genes involved in malignant transformation |
| Hugo Symbol | Variant Class | Variant Classification | dbSNP RS | HGVSc | HGVSp | HGVSp Short | SWISSPROT | BIOTYPE | SIFT | PolyPhen | Tumor Sample Barcode | Tissue | Histology | Sex | Age | Stage | Therapy Types | Drugs | Outcome |
| CENPN | SNV | Missense_Mutation | novel | c.965N>G | p.Leu322Arg | p.L322R | Q96H22 | protein_coding | deleterious_low_confidence(0) | benign(0.23) | TCGA-GI-A2C9-01 | Breast | breast invasive carcinoma | Female | <65 | I/II | Unspecific | SD | |
| CENPN | SNV | Missense_Mutation | novel | c.261N>C | p.Gln87His | p.Q87H | Q96H22 | protein_coding | tolerated(0.05) | benign(0.007) | TCGA-JW-A5VL-01 | Cervix | cervical & endocervical cancer | Female | <65 | I/II | Unknown | Unknown | SD |
| CENPN | SNV | Missense_Mutation | c.658N>G | p.Thr220Ala | p.T220A | Q96H22 | protein_coding | tolerated(0.4) | benign(0.01) | TCGA-AA-3492-01 | Colorectum | colon adenocarcinoma | Female | >=65 | I/II | Unknown | Unknown | SD | |
| CENPN | SNV | Missense_Mutation | rs528102999 | c.320C>T | p.Ser107Leu | p.S107L | Q96H22 | protein_coding | tolerated(0.06) | benign(0.011) | TCGA-AA-3510-01 | Colorectum | colon adenocarcinoma | Male | >=65 | I/II | Unknown | Unknown | SD |
| CENPN | SNV | Missense_Mutation | rs746494487 | c.476N>T | p.Pro159Leu | p.P159L | Q96H22 | protein_coding | tolerated(0.05) | probably_damaging(1) | TCGA-AA-3715-01 | Colorectum | colon adenocarcinoma | Male | >=65 | I/II | Unknown | Unknown | PD |
| CENPN | SNV | Missense_Mutation | rs753087047 | c.509N>A | p.Arg170His | p.R170H | Q96H22 | protein_coding | tolerated(0.2) | possibly_damaging(0.69) | TCGA-AA-3869-01 | Colorectum | colon adenocarcinoma | Male | >=65 | III/IV | Chemotherapy | capecitabine | PD |
| CENPN | SNV | Missense_Mutation | rs781178168 | c.891N>A | p.Phe297Leu | p.F297L | Q96H22 | protein_coding | deleterious(0) | probably_damaging(0.999) | TCGA-AZ-4315-01 | Colorectum | colon adenocarcinoma | Male | <65 | I/II | Unknown | Unknown | SD |
| CENPN | SNV | Missense_Mutation | rs200191233 | c.656N>T | p.Thr219Met | p.T219M | Q96H22 | protein_coding | tolerated(0.21) | possibly_damaging(0.617) | TCGA-CM-6674-01 | Colorectum | colon adenocarcinoma | Male | <65 | I/II | Unknown | Unknown | SD |
| CENPN | SNV | Missense_Mutation | c.401N>A | p.Arg134Gln | p.R134Q | Q96H22 | protein_coding | deleterious(0.03) | possibly_damaging(0.826) | TCGA-AG-A002-01 | Colorectum | rectum adenocarcinoma | Male | <65 | I/II | Unknown | Unknown | SD | |
| CENPN | SNV | Missense_Mutation | rs781178168 | c.891C>A | p.Phe297Leu | p.F297L | Q96H22 | protein_coding | deleterious(0) | probably_damaging(0.999) | TCGA-AJ-A3EL-01 | Endometrium | uterine corpus endometrioid carcinoma | Female | <65 | I/II | Unknown | Unknown | SD |
| Page: 1 2 3 4 |
Top |
Related drugs of malignant transformation related genes |
| Identification of chemicals and drugs interact with genes involved in malignant transfromation |
| (DGIdb 4.0) |
| Entrez ID | Symbol | Category | Interaction Types | Drug Claim Name | Drug Name | PMIDs |
| Page: 1 |

Copyright 2023-Present -The University of Texas Health Science Center at Houston |