
|
|||||
|
 | |
| |
| |
| |
| |
| |
|
Gene: CENPJ |
Gene summary for CENPJ |
| Gene information | Species | Human | Gene symbol | CENPJ | Gene ID | 55835 |
| Gene name | centromere protein J | |
| Gene Alias | BM032 | |
| Cytomap | 13q12.12-q12.13 | |
| Gene Type | protein-coding | GO ID | GO:0000226 | UniProtAcc | A8K8P1 |
Top |
Malignant transformation analysis |
| Identification of the aberrant gene expression in precancerous and cancerous lesions by comparing the gene expression of stem-like cells in diseased tissues with normal stem cells |
| Entrez ID | Symbol | Replicates | Species | Organ | Tissue | Adj P-value | Log2FC | Malignancy |
| 55835 | CENPJ | CCI_2 | Human | Cervix | CC | 2.73e-02 | 5.05e-01 | 0.5249 |
| 55835 | CENPJ | CCI_3 | Human | Cervix | CC | 2.20e-02 | 3.74e-01 | 0.516 |
| 55835 | CENPJ | HCC1_Meng | Human | Liver | HCC | 6.29e-13 | 3.35e-02 | 0.0246 |
| 55835 | CENPJ | HCC1 | Human | Liver | HCC | 5.72e-05 | 3.07e+00 | 0.5336 |
| 55835 | CENPJ | HCC2 | Human | Liver | HCC | 1.66e-08 | 2.74e+00 | 0.5341 |
| 55835 | CENPJ | S028 | Human | Liver | HCC | 6.35e-05 | 2.48e-01 | 0.2503 |
| 55835 | CENPJ | S029 | Human | Liver | HCC | 6.37e-04 | 2.48e-01 | 0.2581 |
| 55835 | CENPJ | male-WTA | Human | Thyroid | PTC | 1.02e-02 | 5.23e-02 | 0.1037 |
| 55835 | CENPJ | PTC04 | Human | Thyroid | PTC | 4.20e-07 | 1.84e-01 | 0.1927 |
| 55835 | CENPJ | PTC06 | Human | Thyroid | PTC | 2.73e-05 | 4.29e-02 | 0.2057 |
| 55835 | CENPJ | PTC07 | Human | Thyroid | PTC | 2.62e-08 | 5.15e-02 | 0.2044 |
| 55835 | CENPJ | ATC12 | Human | Thyroid | ATC | 5.26e-07 | 1.45e-01 | 0.34 |
| 55835 | CENPJ | ATC13 | Human | Thyroid | ATC | 1.61e-18 | 2.89e-01 | 0.34 |
| 55835 | CENPJ | ATC2 | Human | Thyroid | ATC | 4.04e-04 | 5.12e-01 | 0.34 |
| 55835 | CENPJ | ATC4 | Human | Thyroid | ATC | 2.64e-07 | 1.98e-01 | 0.34 |
| 55835 | CENPJ | ATC5 | Human | Thyroid | ATC | 1.92e-17 | 3.55e-01 | 0.34 |
| Page: 1 |
| Tissue | Expression Dynamics | Abbreviation |
| Cervix | 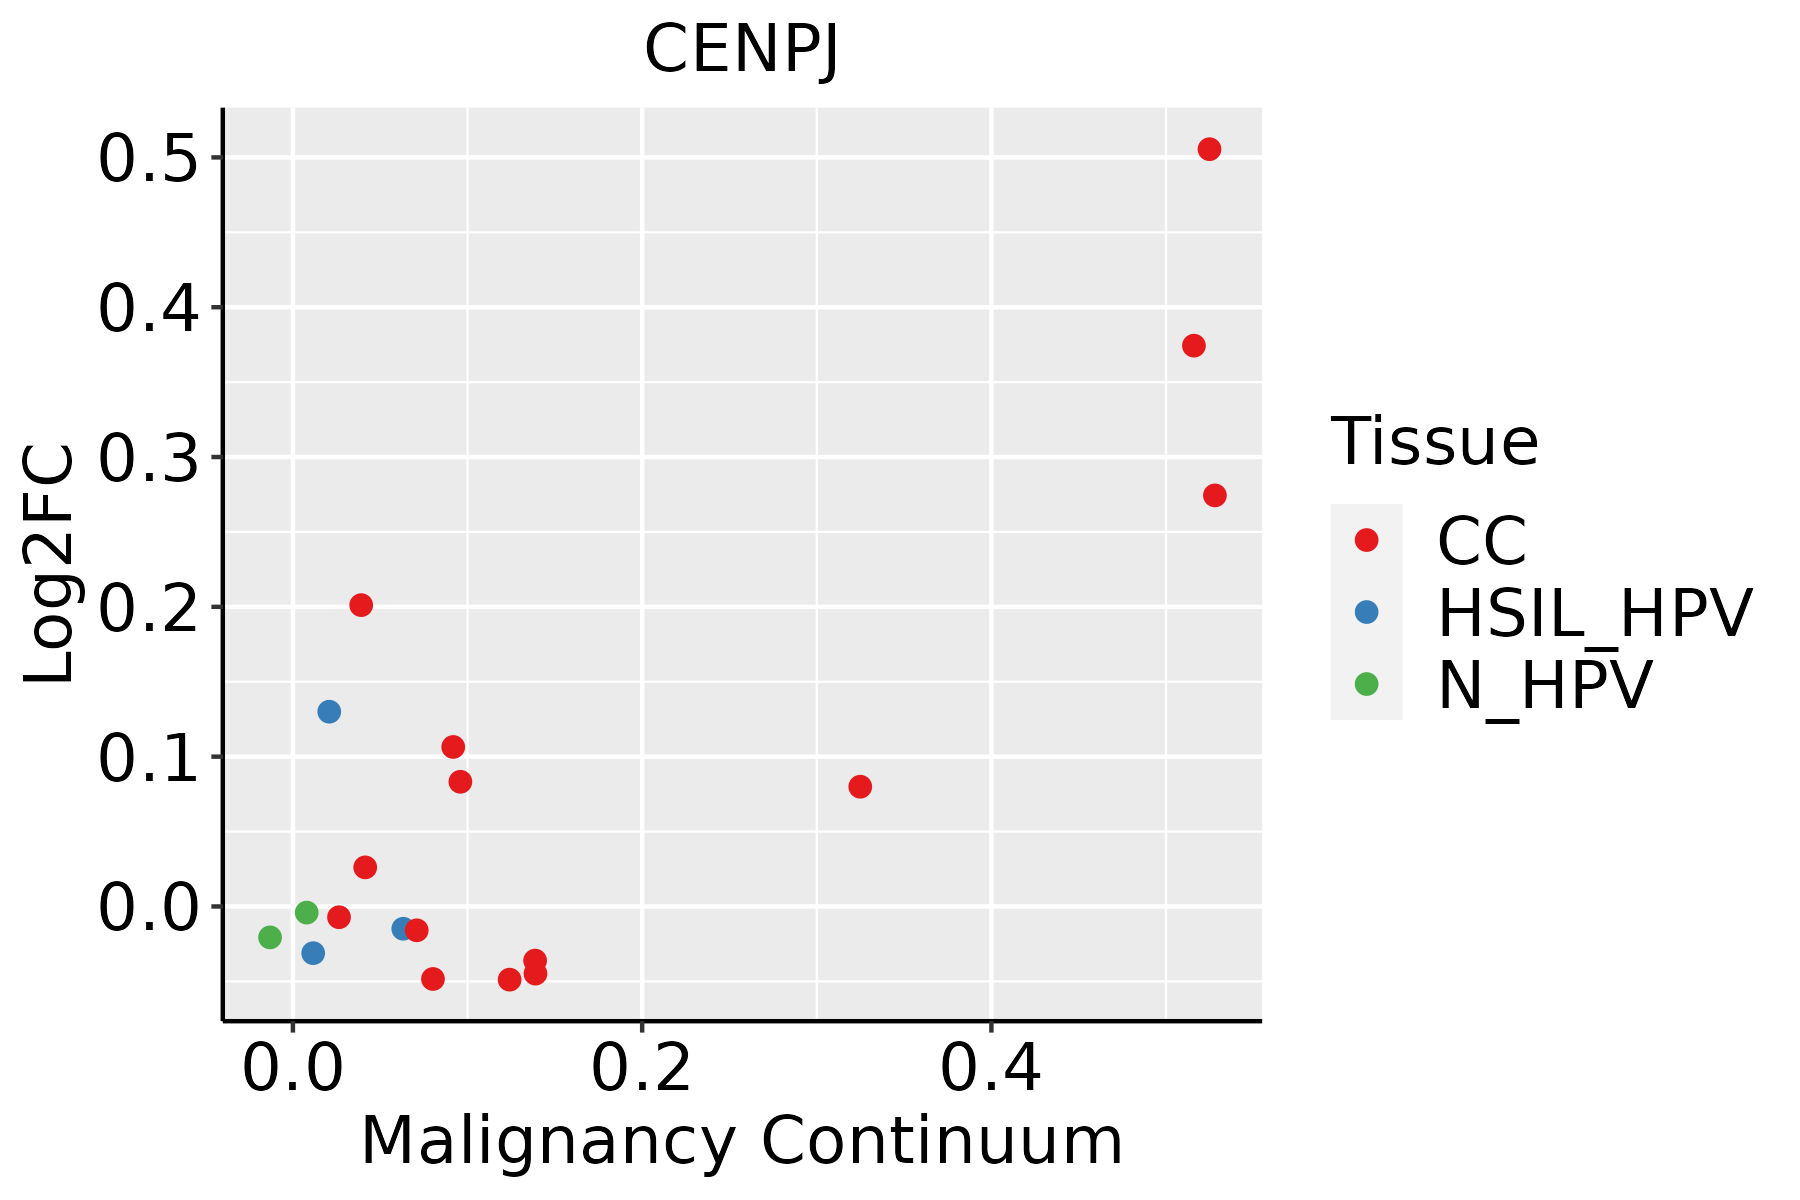 | CC: Cervix cancer |
| HSIL_HPV: HPV-infected high-grade squamous intraepithelial lesions | ||
| N_HPV: HPV-infected normal cervix | ||
| Liver | 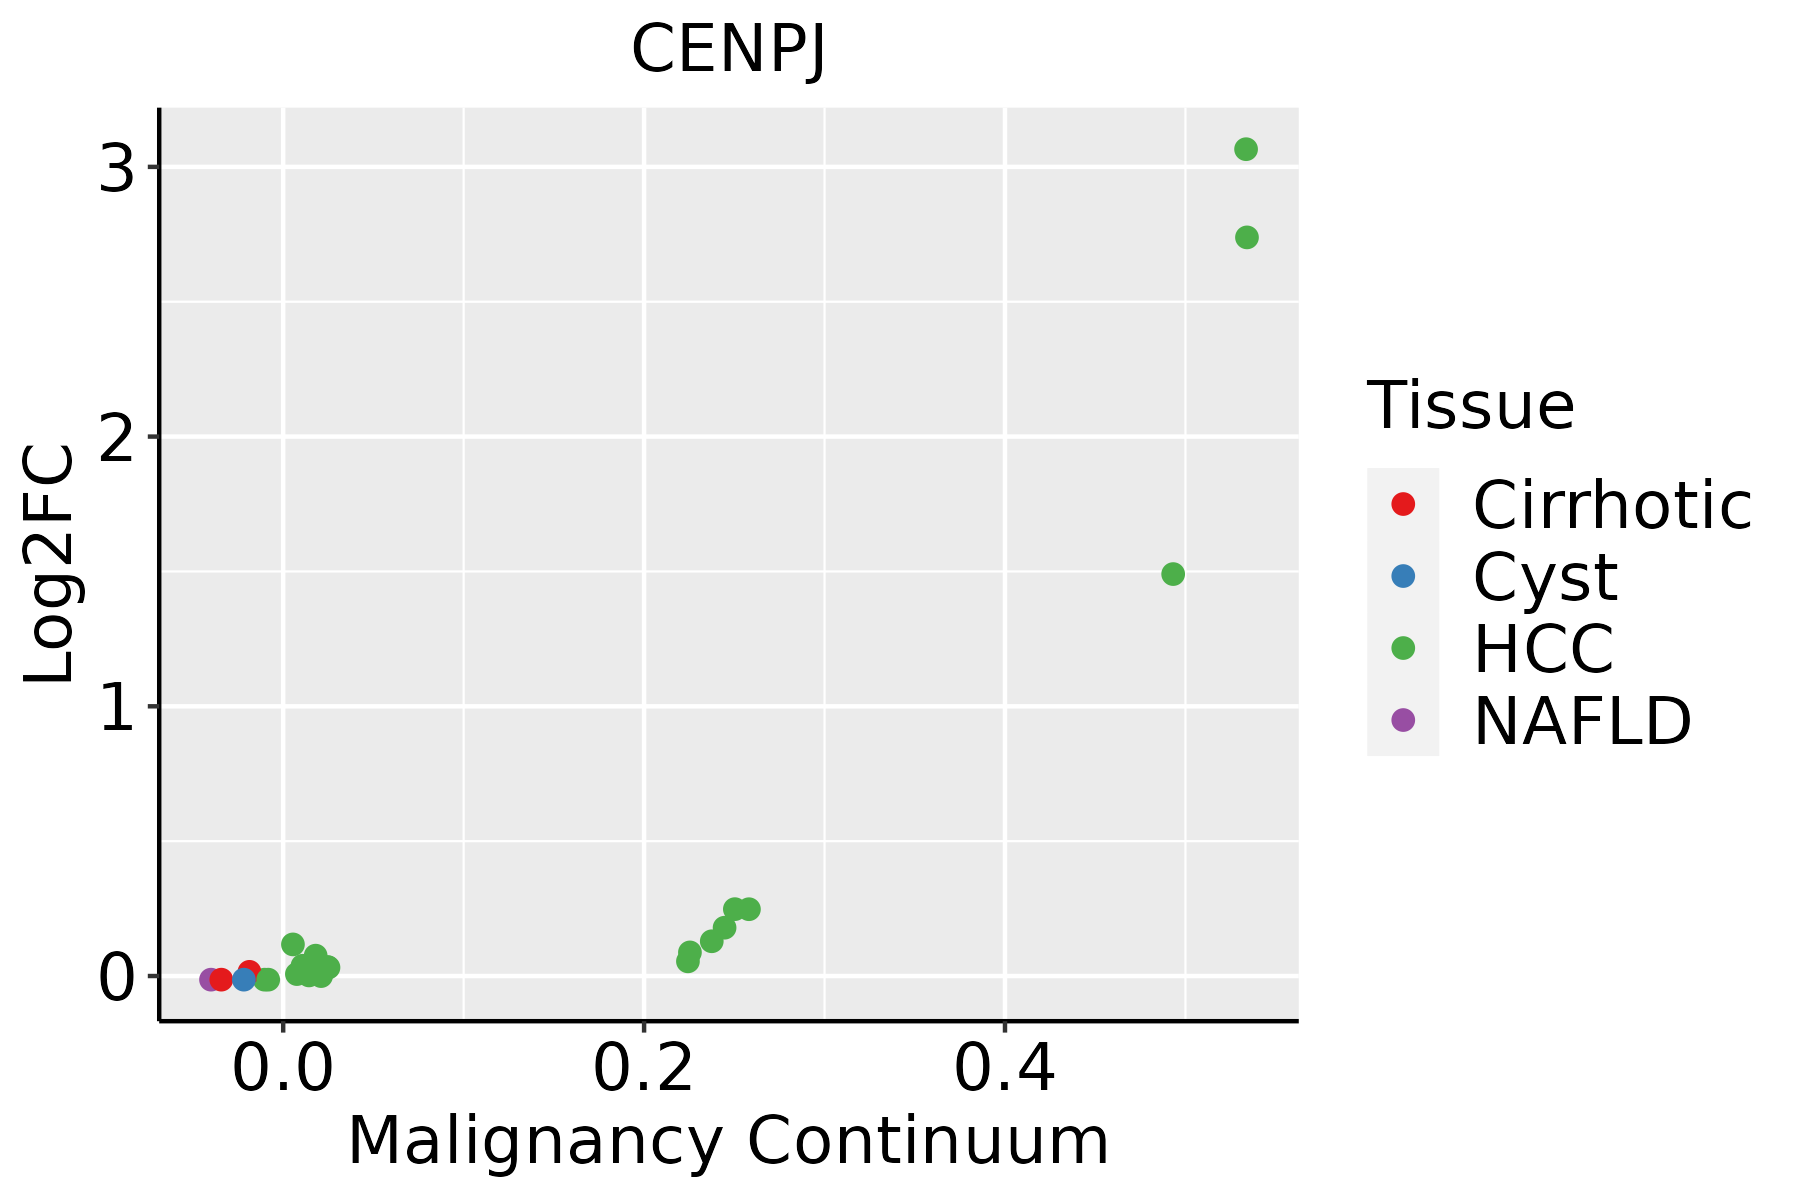 | HCC: Hepatocellular carcinoma |
| NAFLD: Non-alcoholic fatty liver disease | ||
| Thyroid |  | ATC: Anaplastic thyroid cancer |
| HT: Hashimoto's thyroiditis | ||
| PTC: Papillary thyroid cancer |
| ∗log2FC in expression of this searched gene in stem-like cells from each diseased tissue sample relative to stem-like cells in normal samples in each tissue plotted against the malignancy continuum. Samples are colored based on if they are from different disease stage. |
Top |
Malignant transformation related pathway analysis |
| Find out the enriched GO biological processes and KEGG pathways involved in transition from healthy to precancer to cancer |
| Tissue | Disease Stage | Enriched GO biological Processes |
| Colorectum | AD |  |
| Colorectum | SER |  |
| Colorectum | MSS |  |
| Colorectum | MSI-H |  |
| Colorectum | FAP |  |
| ∗Top 15 enriched GO BP terms are showed in the bar plot of each disease state in each tissue. Each row represents a significant GO biological process which is colored according to the -log10(p.adjust). |
| Page: 1 2 3 4 5 6 7 8 9 |
| GO ID | Tissue | Disease Stage | Description | Gene Ratio | Bg Ratio | pvalue | p.adjust | Count |
| GO:005125810 | Cervix | CC | protein polymerization | 70/2311 | 297/18723 | 5.20e-08 | 3.11e-06 | 70 |
| GO:190495110 | Cervix | CC | positive regulation of establishment of protein localization | 73/2311 | 319/18723 | 9.69e-08 | 5.25e-06 | 73 |
| GO:00457876 | Cervix | CC | positive regulation of cell cycle | 66/2311 | 313/18723 | 7.78e-06 | 1.81e-04 | 66 |
| GO:005149510 | Cervix | CC | positive regulation of cytoskeleton organization | 50/2311 | 226/18723 | 2.53e-05 | 4.29e-04 | 50 |
| GO:00900685 | Cervix | CC | positive regulation of cell cycle process | 50/2311 | 236/18723 | 8.25e-05 | 1.11e-03 | 50 |
| GO:19021153 | Cervix | CC | regulation of organelle assembly | 40/2311 | 186/18723 | 2.92e-04 | 3.15e-03 | 40 |
| GO:19021171 | Cervix | CC | positive regulation of organelle assembly | 19/2311 | 67/18723 | 3.42e-04 | 3.58e-03 | 19 |
| GO:00309532 | Cervix | CC | astral microtubule organization | 6/2311 | 10/18723 | 4.73e-04 | 4.68e-03 | 6 |
| GO:00467853 | Cervix | CC | microtubule polymerization | 19/2311 | 83/18723 | 5.25e-03 | 3.08e-02 | 19 |
| GO:00311224 | Cervix | CC | cytoplasmic microtubule organization | 14/2311 | 56/18723 | 6.93e-03 | 3.74e-02 | 14 |
| GO:190495122 | Liver | HCC | positive regulation of establishment of protein localization | 207/7958 | 319/18723 | 3.95e-16 | 3.29e-14 | 207 |
| GO:005125822 | Liver | HCC | protein polymerization | 182/7958 | 297/18723 | 4.17e-11 | 1.58e-09 | 182 |
| GO:005149522 | Liver | HCC | positive regulation of cytoskeleton organization | 138/7958 | 226/18723 | 1.26e-08 | 3.12e-07 | 138 |
| GO:000705111 | Liver | HCC | spindle organization | 116/7958 | 184/18723 | 1.40e-08 | 3.40e-07 | 116 |
| GO:19021151 | Liver | HCC | regulation of organelle assembly | 110/7958 | 186/18723 | 3.30e-06 | 4.34e-05 | 110 |
| GO:004578711 | Liver | HCC | positive regulation of cell cycle | 172/7958 | 313/18723 | 5.29e-06 | 6.58e-05 | 172 |
| GO:0031023 | Liver | HCC | microtubule organizing center organization | 82/7958 | 143/18723 | 2.38e-04 | 1.79e-03 | 82 |
| GO:0007098 | Liver | HCC | centrosome cycle | 75/7958 | 130/18723 | 3.33e-04 | 2.34e-03 | 75 |
| GO:0046785 | Liver | HCC | microtubule polymerization | 51/7958 | 83/18723 | 3.82e-04 | 2.61e-03 | 51 |
| GO:0007020 | Liver | HCC | microtubule nucleation | 25/7958 | 35/18723 | 5.05e-04 | 3.29e-03 | 25 |
| Page: 1 2 3 4 |
| Pathway ID | Tissue | Disease Stage | Description | Gene Ratio | Bg Ratio | pvalue | p.adjust | qvalue | Count |
| Page: 1 |
Top |
Cell-cell communication analysis |
| Identification of potential cell-cell interactions between two cell types and their ligand-receptor pairs for different disease states |
| Ligand | Receptor | LRpair | Pathway | Tissue | Disease Stage |
| Page: 1 |
Top |
Single-cell gene regulatory network inference analysis |
| Find out the significant the regulons (TFs) and the target genes of each regulon across cell types for different disease states |
| TF | Cell Type | Tissue | Disease Stage | Target Gene | RSS | Regulon Activity |
| ∗The dot plots of a searched regulon are shown for all cell subpopulations in each disease state of each tissue based on the regulon specific score inferred using pySCENIC and by calculating the average expression. |
| Page: 1 |
Top |
Somatic mutation of malignant transformation related genes |
| Annotation of somatic variants for genes involved in malignant transformation |
| Hugo Symbol | Variant Class | Variant Classification | dbSNP RS | HGVSc | HGVSp | HGVSp Short | SWISSPROT | BIOTYPE | SIFT | PolyPhen | Tumor Sample Barcode | Tissue | Histology | Sex | Age | Stage | Therapy Types | Drugs | Outcome |
| CENPJ | SNV | Missense_Mutation | novel | c.2437N>A | p.Leu813Ile | p.L813I | Q9HC77 | protein_coding | tolerated(0.09) | benign(0.014) | TCGA-3C-AALI-01 | Breast | breast invasive carcinoma | Female | <65 | I/II | Unspecific | Poly E | Complete Response |
| CENPJ | SNV | Missense_Mutation | c.429N>A | p.Phe143Leu | p.F143L | Q9HC77 | protein_coding | tolerated(0.83) | benign(0.048) | TCGA-AR-A0TT-01 | Breast | breast invasive carcinoma | Female | <65 | III/IV | Chemotherapy | doxorubicin | SD | |
| CENPJ | SNV | Missense_Mutation | novel | c.3314N>A | p.Arg1105Gln | p.R1105Q | Q9HC77 | protein_coding | tolerated(0.14) | benign(0.003) | TCGA-AR-A0TX-01 | Breast | breast invasive carcinoma | Female | <65 | I/II | Unknown | Unknown | SD |
| CENPJ | SNV | Missense_Mutation | c.1225N>A | p.Asp409Asn | p.D409N | Q9HC77 | protein_coding | deleterious(0.02) | benign(0.386) | TCGA-E2-A10C-01 | Breast | breast invasive carcinoma | Female | <65 | I/II | Chemotherapy | cytoxan | SD | |
| CENPJ | SNV | Missense_Mutation | novel | c.2932G>A | p.Glu978Lys | p.E978K | Q9HC77 | protein_coding | deleterious(0) | probably_damaging(0.992) | TCGA-LD-A7W5-01 | Breast | breast invasive carcinoma | Female | <65 | III/IV | Chemotherapy | taxotere | SD |
| CENPJ | SNV | Missense_Mutation | rs142535552 | c.1409N>T | p.Pro470Leu | p.P470L | Q9HC77 | protein_coding | deleterious(0) | benign(0.005) | TCGA-LL-A441-01 | Breast | breast invasive carcinoma | Female | <65 | I/II | Chemotherapy | taxotere | CR |
| CENPJ | insertion | Frame_Shift_Ins | novel | c.1206_1207insGTTCTAACGCATGTACACACCTACCTCATTCCATTTA | p.Asn403ValfsTer24 | p.N403Vfs*24 | Q9HC77 | protein_coding | TCGA-A2-A04V-01 | Breast | breast invasive carcinoma | Female | <65 | I/II | Chemotherapy | cytoxan | PD | ||
| CENPJ | insertion | Frame_Shift_Ins | novel | c.1961_1962insTGCTGATACATACTGTAAATGTATGCTTATCATAGTAGTTATGGGTAAA | p.Pro655AlafsTer27 | p.P655Afs*27 | Q9HC77 | protein_coding | TCGA-AO-A0J9-01 | Breast | breast invasive carcinoma | Female | <65 | III/IV | Chemotherapy | cyclophosphamide | PD | ||
| CENPJ | insertion | In_Frame_Ins | novel | c.149_150insCAGTCCTTATTGGTGTTCCTGGCATGTAGTGAG | p.Ser51_Thr52insProTyrTrpCysSerTrpHisValValSerSer | p.S51_T52insPYWCSWHVVSS | Q9HC77 | protein_coding | TCGA-B6-A0IE-01 | Breast | breast invasive carcinoma | Female | <65 | III/IV | Unknown | Unknown | PD | ||
| CENPJ | SNV | Missense_Mutation | novel | c.924G>T | p.Lys308Asn | p.K308N | Q9HC77 | protein_coding | tolerated(0.51) | benign(0.015) | TCGA-2W-A8YY-01 | Cervix | cervical & endocervical cancer | Female | <65 | I/II | Chemotherapy | cisplatin | CR |
| Page: 1 2 3 4 5 6 7 8 9 10 11 12 13 14 15 16 |
Top |
Related drugs of malignant transformation related genes |
| Identification of chemicals and drugs interact with genes involved in malignant transfromation |
| (DGIdb 4.0) |
| Entrez ID | Symbol | Category | Interaction Types | Drug Claim Name | Drug Name | PMIDs |
| Page: 1 |

Copyright 2023-Present -The University of Texas Health Science Center at Houston |