
|
|||||
|
 | |
| |
| |
| |
| |
| |
|
Gene: CENPH |
Gene summary for CENPH |
| Gene information | Species | Human | Gene symbol | CENPH | Gene ID | 64946 |
| Gene name | centromere protein H | |
| Gene Alias | CENPH | |
| Cytomap | 5q13.2 | |
| Gene Type | protein-coding | GO ID | GO:0000226 | UniProtAcc | A0A0S2Z5T0 |
Top |
Malignant transformation analysis |
| Identification of the aberrant gene expression in precancerous and cancerous lesions by comparing the gene expression of stem-like cells in diseased tissues with normal stem cells |
| Entrez ID | Symbol | Replicates | Species | Organ | Tissue | Adj P-value | Log2FC | Malignancy |
| 64946 | CENPH | LZE7T | Human | Esophagus | ESCC | 2.01e-03 | 3.16e-01 | 0.0667 |
| 64946 | CENPH | LZE24T | Human | Esophagus | ESCC | 2.67e-04 | 1.66e-01 | 0.0596 |
| 64946 | CENPH | LZE6T | Human | Esophagus | ESCC | 8.01e-04 | 1.85e-01 | 0.0845 |
| 64946 | CENPH | P1T-E | Human | Esophagus | ESCC | 2.32e-04 | 3.46e-01 | 0.0875 |
| 64946 | CENPH | P2T-E | Human | Esophagus | ESCC | 1.03e-43 | 1.03e+00 | 0.1177 |
| 64946 | CENPH | P4T-E | Human | Esophagus | ESCC | 2.81e-18 | 5.66e-01 | 0.1323 |
| 64946 | CENPH | P5T-E | Human | Esophagus | ESCC | 2.65e-16 | 3.26e-01 | 0.1327 |
| 64946 | CENPH | P9T-E | Human | Esophagus | ESCC | 2.18e-08 | 1.90e-01 | 0.1131 |
| 64946 | CENPH | P10T-E | Human | Esophagus | ESCC | 4.64e-15 | 3.00e-01 | 0.116 |
| 64946 | CENPH | P12T-E | Human | Esophagus | ESCC | 8.89e-09 | 2.54e-01 | 0.1122 |
| 64946 | CENPH | P15T-E | Human | Esophagus | ESCC | 4.03e-16 | 4.94e-01 | 0.1149 |
| 64946 | CENPH | P16T-E | Human | Esophagus | ESCC | 1.58e-20 | 4.13e-01 | 0.1153 |
| 64946 | CENPH | P17T-E | Human | Esophagus | ESCC | 1.58e-06 | 3.54e-01 | 0.1278 |
| 64946 | CENPH | P19T-E | Human | Esophagus | ESCC | 4.55e-02 | 4.72e-01 | 0.1662 |
| 64946 | CENPH | P20T-E | Human | Esophagus | ESCC | 3.38e-05 | 2.08e-01 | 0.1124 |
| 64946 | CENPH | P21T-E | Human | Esophagus | ESCC | 1.77e-18 | 4.92e-01 | 0.1617 |
| 64946 | CENPH | P22T-E | Human | Esophagus | ESCC | 7.91e-09 | 2.19e-01 | 0.1236 |
| 64946 | CENPH | P23T-E | Human | Esophagus | ESCC | 2.57e-09 | 2.23e-01 | 0.108 |
| 64946 | CENPH | P24T-E | Human | Esophagus | ESCC | 3.10e-17 | 4.14e-01 | 0.1287 |
| 64946 | CENPH | P26T-E | Human | Esophagus | ESCC | 1.03e-20 | 5.06e-01 | 0.1276 |
| Page: 1 2 3 4 |
| Tissue | Expression Dynamics | Abbreviation |
| Esophagus | 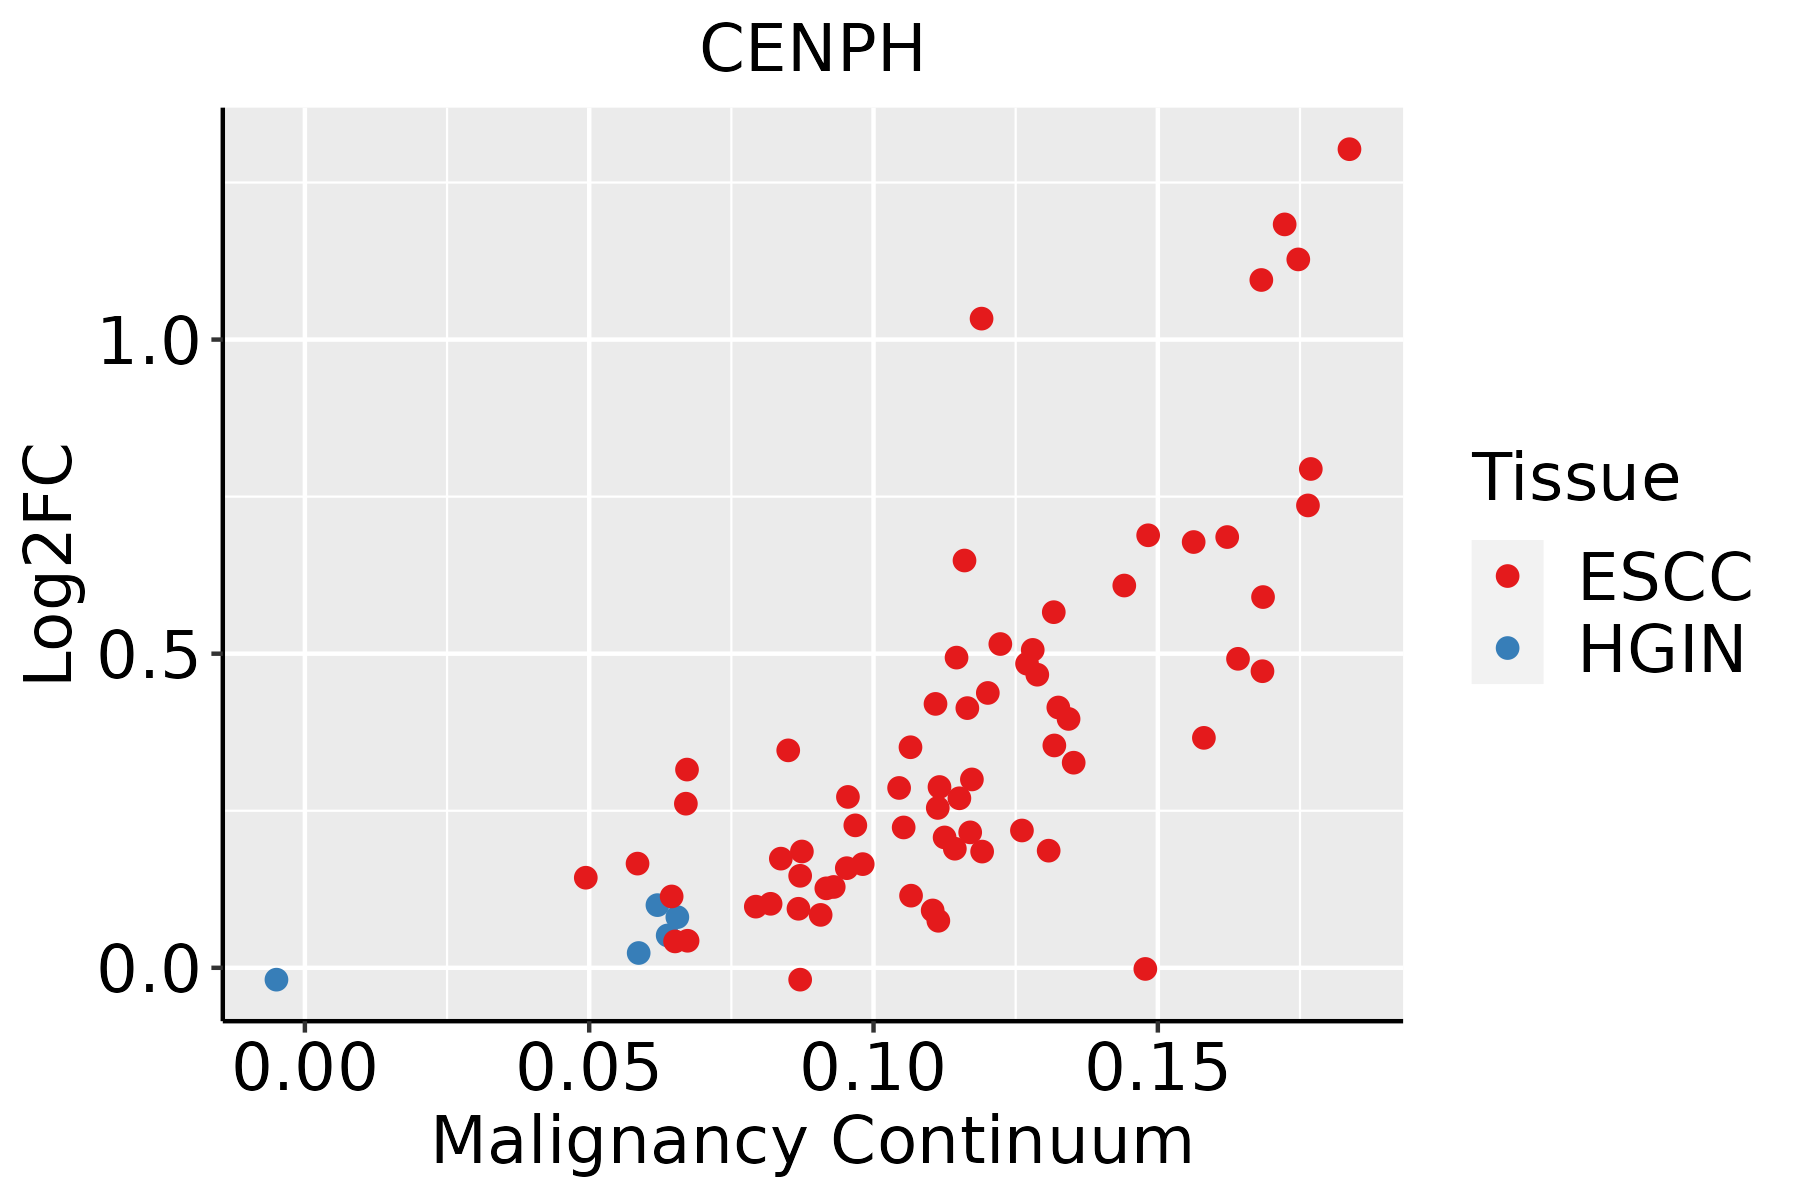 | ESCC: Esophageal squamous cell carcinoma |
| HGIN: High-grade intraepithelial neoplasias | ||
| LGIN: Low-grade intraepithelial neoplasias | ||
| Oral Cavity | 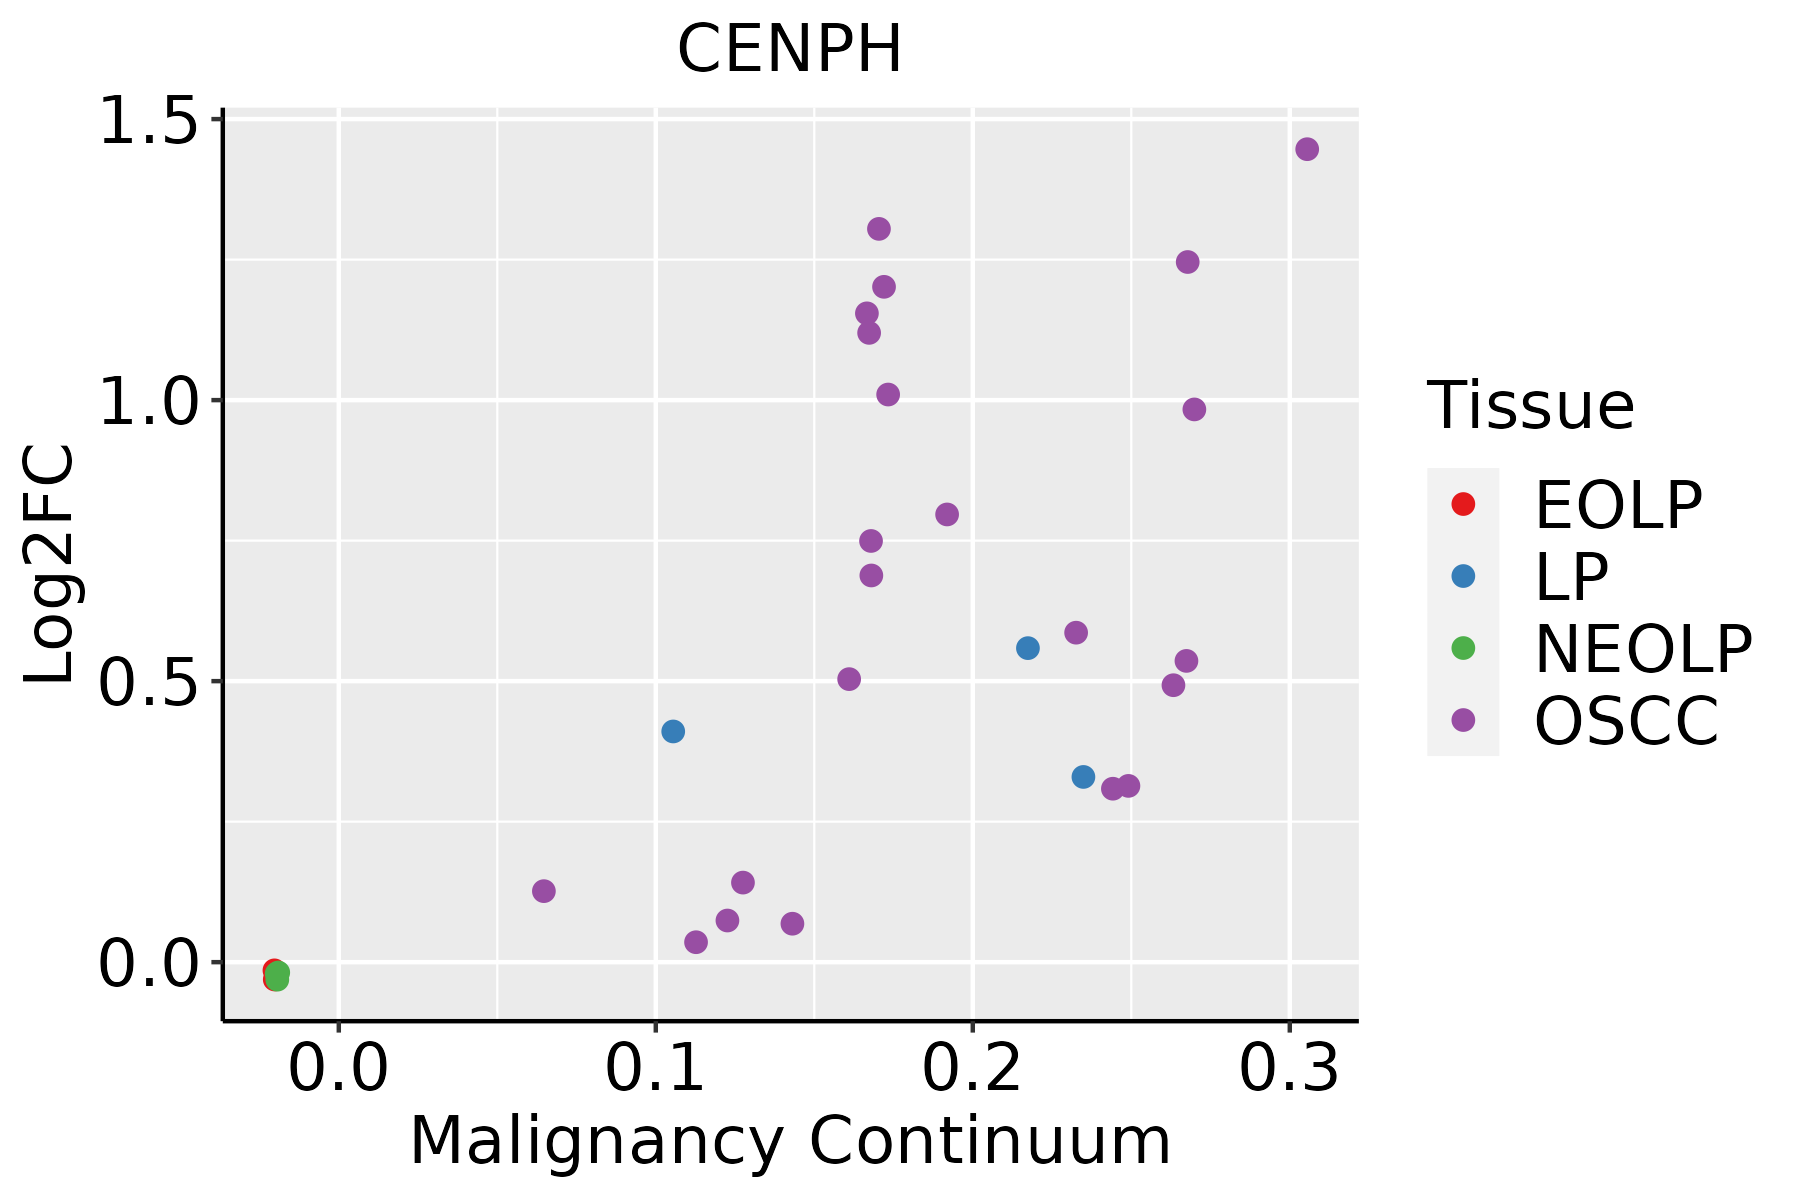 | EOLP: Erosive Oral lichen planus |
| LP: leukoplakia | ||
| NEOLP: Non-erosive oral lichen planus | ||
| OSCC: Oral squamous cell carcinoma | ||
| Skin | 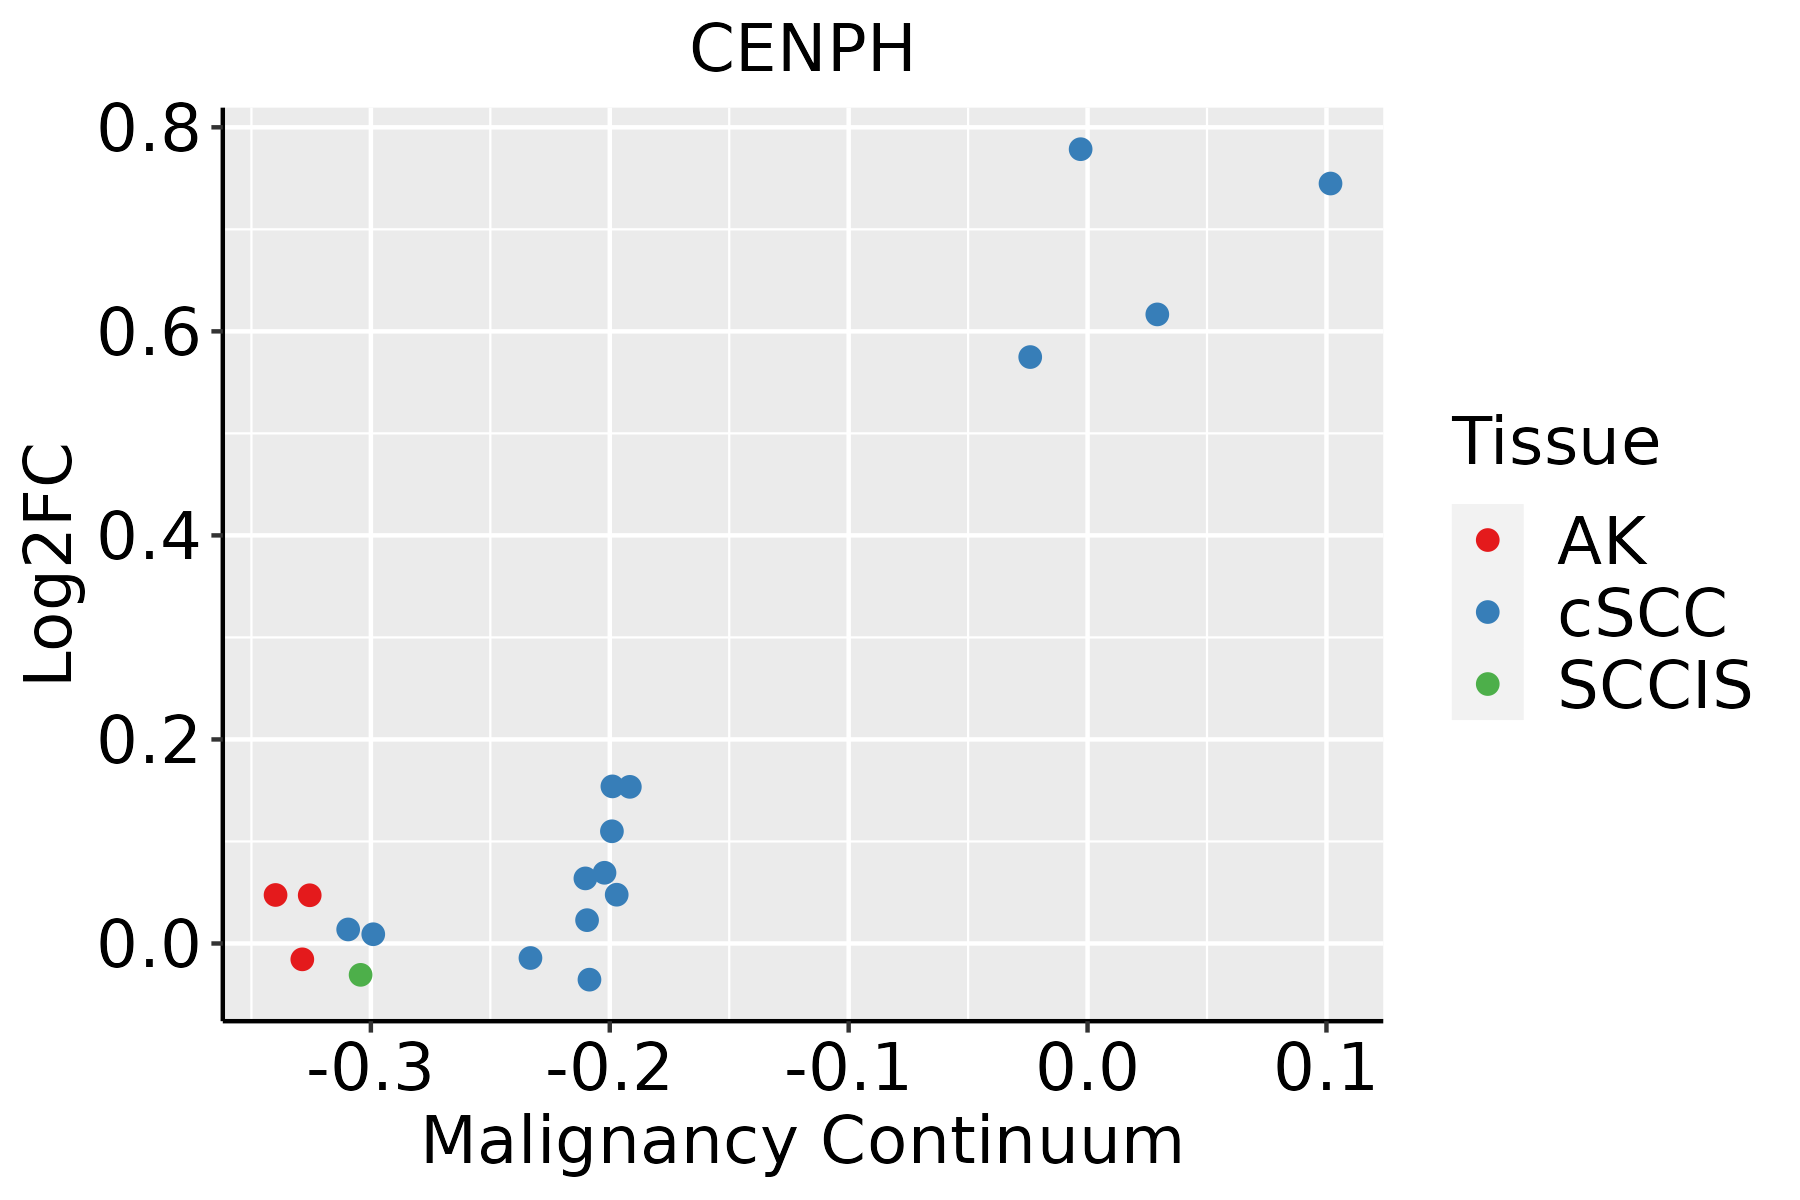 | AK: Actinic keratosis |
| cSCC: Cutaneous squamous cell carcinoma | ||
| SCCIS:squamous cell carcinoma in situ | ||
| Thyroid | 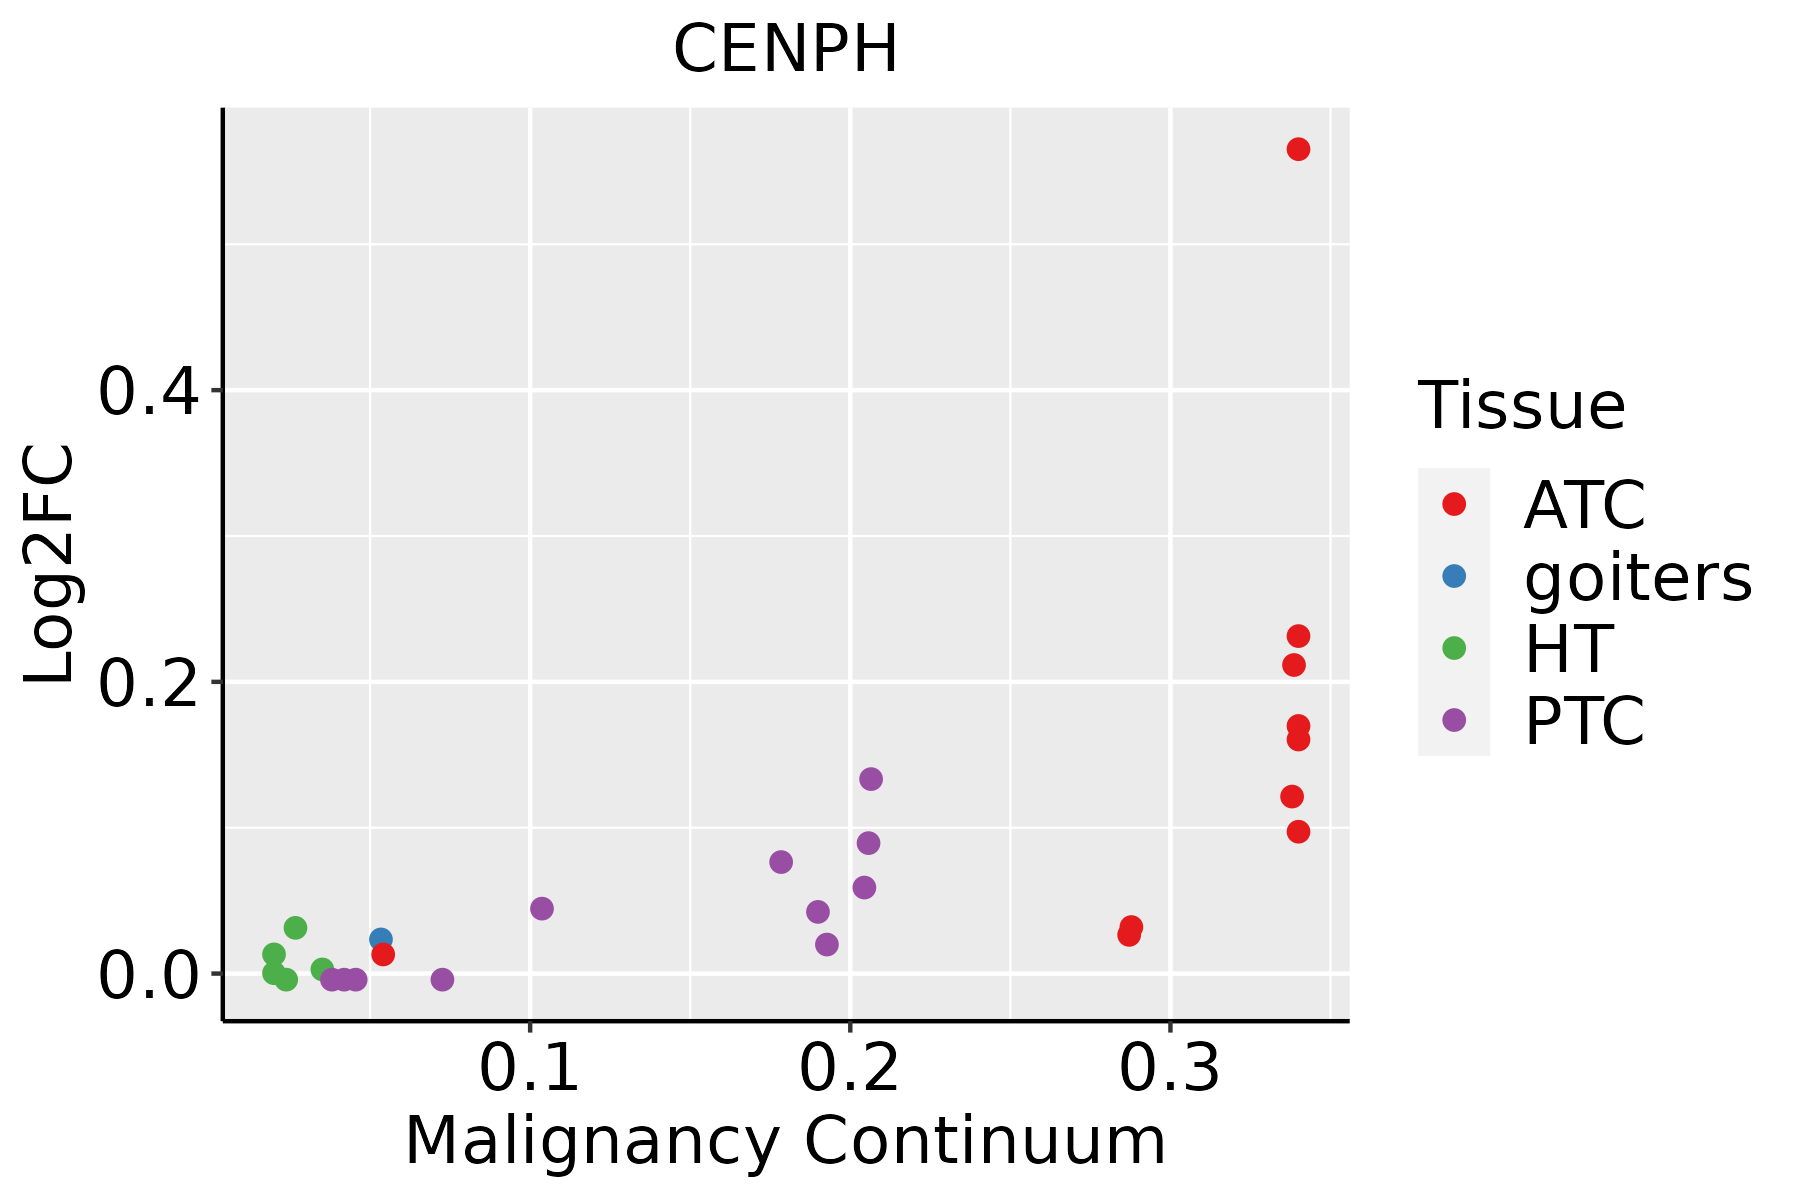 | ATC: Anaplastic thyroid cancer |
| HT: Hashimoto's thyroiditis | ||
| PTC: Papillary thyroid cancer |
| ∗log2FC in expression of this searched gene in stem-like cells from each diseased tissue sample relative to stem-like cells in normal samples in each tissue plotted against the malignancy continuum. Samples are colored based on if they are from different disease stage. |
Top |
Malignant transformation related pathway analysis |
| Find out the enriched GO biological processes and KEGG pathways involved in transition from healthy to precancer to cancer |
| Tissue | Disease Stage | Enriched GO biological Processes |
| Colorectum | AD |  |
| Colorectum | SER |  |
| Colorectum | MSS |  |
| Colorectum | MSI-H |  |
| Colorectum | FAP |  |
| ∗Top 15 enriched GO BP terms are showed in the bar plot of each disease state in each tissue. Each row represents a significant GO biological process which is colored according to the -log10(p.adjust). |
| Page: 1 2 3 4 5 6 7 8 9 |
| GO ID | Tissue | Disease Stage | Description | Gene Ratio | Bg Ratio | pvalue | p.adjust | Count |
| GO:000705911 | Esophagus | ESCC | chromosome segregation | 238/8552 | 346/18723 | 1.72e-18 | 1.82e-16 | 238 |
| GO:190285015 | Esophagus | ESCC | microtubule cytoskeleton organization involved in mitosis | 116/8552 | 147/18723 | 1.25e-16 | 9.91e-15 | 116 |
| GO:000705214 | Esophagus | ESCC | mitotic spindle organization | 97/8552 | 120/18723 | 2.17e-15 | 1.33e-13 | 97 |
| GO:000705114 | Esophagus | ESCC | spindle organization | 134/8552 | 184/18723 | 5.70e-14 | 2.87e-12 | 134 |
| GO:00513831 | Esophagus | ESCC | kinetochore organization | 21/8552 | 23/18723 | 5.69e-06 | 5.90e-05 | 21 |
| GO:00345081 | Esophagus | ESCC | centromere complex assembly | 25/8552 | 30/18723 | 2.45e-05 | 2.09e-04 | 25 |
| GO:00513821 | Esophagus | ESCC | kinetochore assembly | 16/8552 | 18/18723 | 1.78e-04 | 1.15e-03 | 16 |
| GO:00070592 | Oral cavity | OSCC | chromosome segregation | 206/7305 | 346/18723 | 5.82e-15 | 3.76e-13 | 206 |
| GO:00070526 | Oral cavity | OSCC | mitotic spindle organization | 85/7305 | 120/18723 | 1.44e-12 | 6.23e-11 | 85 |
| GO:19028506 | Oral cavity | OSCC | microtubule cytoskeleton organization involved in mitosis | 99/7305 | 147/18723 | 2.94e-12 | 1.18e-10 | 99 |
| GO:00070517 | Oral cavity | OSCC | spindle organization | 117/7305 | 184/18723 | 1.16e-11 | 4.17e-10 | 117 |
| GO:0051383 | Oral cavity | OSCC | kinetochore organization | 18/7305 | 23/18723 | 1.47e-04 | 1.04e-03 | 18 |
| GO:0034508 | Oral cavity | OSCC | centromere complex assembly | 21/7305 | 30/18723 | 5.75e-04 | 3.30e-03 | 21 |
| GO:0051382 | Oral cavity | OSCC | kinetochore assembly | 14/7305 | 18/18723 | 9.51e-04 | 4.96e-03 | 14 |
| GO:000705912 | Skin | cSCC | chromosome segregation | 161/4864 | 346/18723 | 8.34e-17 | 8.57e-15 | 161 |
| GO:190285016 | Skin | cSCC | microtubule cytoskeleton organization involved in mitosis | 85/4864 | 147/18723 | 2.66e-16 | 2.39e-14 | 85 |
| GO:000705215 | Skin | cSCC | mitotic spindle organization | 73/4864 | 120/18723 | 7.81e-16 | 6.80e-14 | 73 |
| GO:000705115 | Skin | cSCC | spindle organization | 96/4864 | 184/18723 | 2.59e-14 | 1.77e-12 | 96 |
| GO:00513832 | Skin | cSCC | kinetochore organization | 15/4864 | 23/18723 | 8.72e-05 | 8.21e-04 | 15 |
| GO:00718241 | Skin | cSCC | protein-DNA complex subunit organization | 87/4864 | 241/18723 | 3.09e-04 | 2.47e-03 | 87 |
| Page: 1 2 |
| Pathway ID | Tissue | Disease Stage | Description | Gene Ratio | Bg Ratio | pvalue | p.adjust | qvalue | Count |
| Page: 1 |
Top |
Cell-cell communication analysis |
| Identification of potential cell-cell interactions between two cell types and their ligand-receptor pairs for different disease states |
| Ligand | Receptor | LRpair | Pathway | Tissue | Disease Stage |
| Page: 1 |
Top |
Single-cell gene regulatory network inference analysis |
| Find out the significant the regulons (TFs) and the target genes of each regulon across cell types for different disease states |
| TF | Cell Type | Tissue | Disease Stage | Target Gene | RSS | Regulon Activity |
| ∗The dot plots of a searched regulon are shown for all cell subpopulations in each disease state of each tissue based on the regulon specific score inferred using pySCENIC and by calculating the average expression. |
| Page: 1 |
Top |
Somatic mutation of malignant transformation related genes |
| Annotation of somatic variants for genes involved in malignant transformation |
| Hugo Symbol | Variant Class | Variant Classification | dbSNP RS | HGVSc | HGVSp | HGVSp Short | SWISSPROT | BIOTYPE | SIFT | PolyPhen | Tumor Sample Barcode | Tissue | Histology | Sex | Age | Stage | Therapy Types | Drugs | Outcome |
| CENPH | deletion | Frame_Shift_Del | c.344delA | p.Asn115ThrfsTer16 | p.N115Tfs*16 | Q9H3R5 | protein_coding | TCGA-BH-A18G-01 | Breast | breast invasive carcinoma | Female | >=65 | I/II | Unknown | Unknown | SD | |||
| CENPH | SNV | Missense_Mutation | c.314N>T | p.Arg105Met | p.R105M | Q9H3R5 | protein_coding | deleterious(0) | possibly_damaging(0.888) | TCGA-G4-6304-01 | Colorectum | colon adenocarcinoma | Female | >=65 | I/II | Chemotherapy | fluorouracil | PD | |
| CENPH | deletion | Frame_Shift_Del | c.344delA | p.Asn115ThrfsTer16 | p.N115Tfs*16 | Q9H3R5 | protein_coding | TCGA-AZ-6598-01 | Colorectum | colon adenocarcinoma | Female | >=65 | I/II | Unknown | Unknown | SD | |||
| CENPH | SNV | Missense_Mutation | novel | c.642N>G | p.His214Gln | p.H214Q | Q9H3R5 | protein_coding | deleterious(0.01) | possibly_damaging(0.617) | TCGA-AJ-A3EL-01 | Endometrium | uterine corpus endometrioid carcinoma | Female | <65 | I/II | Unknown | Unknown | SD |
| CENPH | SNV | Missense_Mutation | novel | c.473N>C | p.Arg158Thr | p.R158T | Q9H3R5 | protein_coding | deleterious(0) | probably_damaging(0.947) | TCGA-AX-A2IO-01 | Endometrium | uterine corpus endometrioid carcinoma | Female | >=65 | I/II | Chemotherapy | carboplatin | SD |
| CENPH | SNV | Missense_Mutation | c.588G>T | p.Lys196Asn | p.K196N | Q9H3R5 | protein_coding | tolerated(0.11) | probably_damaging(0.966) | TCGA-BS-A0TC-01 | Endometrium | uterine corpus endometrioid carcinoma | Female | >=65 | I/II | Unknown | Unknown | SD | |
| CENPH | SNV | Missense_Mutation | novel | c.548N>G | p.Lys183Arg | p.K183R | Q9H3R5 | protein_coding | deleterious(0.02) | probably_damaging(0.945) | TCGA-DI-A1BU-01 | Endometrium | uterine corpus endometrioid carcinoma | Female | <65 | I/II | Chemotherapy | paclitaxel | SD |
| CENPH | SNV | Missense_Mutation | novel | c.301N>A | p.Leu101Ile | p.L101I | Q9H3R5 | protein_coding | deleterious(0.03) | probably_damaging(0.973) | TCGA-EO-A3AY-01 | Endometrium | uterine corpus endometrioid carcinoma | Female | <65 | I/II | Unknown | Unknown | PD |
| CENPH | SNV | Missense_Mutation | rs200925138 | c.235N>A | p.Glu79Lys | p.E79K | Q9H3R5 | protein_coding | deleterious(0.02) | benign(0.007) | TCGA-EO-A3B0-01 | Endometrium | uterine corpus endometrioid carcinoma | Female | <65 | III/IV | Unknown | Unknown | SD |
| CENPH | SNV | Missense_Mutation | novel | c.64N>A | p.Ala22Thr | p.A22T | Q9H3R5 | protein_coding | tolerated(0.21) | benign(0.017) | TCGA-EY-A2OM-01 | Endometrium | uterine corpus endometrioid carcinoma | Female | <65 | I/II | Chemotherapy | taxol | SD |
| Page: 1 2 3 |
Top |
Related drugs of malignant transformation related genes |
| Identification of chemicals and drugs interact with genes involved in malignant transfromation |
| (DGIdb 4.0) |
| Entrez ID | Symbol | Category | Interaction Types | Drug Claim Name | Drug Name | PMIDs |
| Page: 1 |

Copyright 2023-Present -The University of Texas Health Science Center at Houston |