
|
|||||
|
 | |
| |
| |
| |
| |
| |
|
Gene: CENPC |
Gene summary for CENPC |
| Gene information | Species | Human | Gene symbol | CENPC | Gene ID | 1060 |
| Gene name | centromere protein C | |
| Gene Alias | CENP-C | |
| Cytomap | 4q13.2 | |
| Gene Type | protein-coding | GO ID | GO:0000003 | UniProtAcc | Q03188 |
Top |
Malignant transformation analysis |
| Identification of the aberrant gene expression in precancerous and cancerous lesions by comparing the gene expression of stem-like cells in diseased tissues with normal stem cells |
| Entrez ID | Symbol | Replicates | Species | Organ | Tissue | Adj P-value | Log2FC | Malignancy |
| 1060 | CENPC | LZE4T | Human | Esophagus | ESCC | 2.82e-06 | 3.06e-01 | 0.0811 |
| 1060 | CENPC | LZE5T | Human | Esophagus | ESCC | 5.50e-06 | 5.33e-01 | 0.0514 |
| 1060 | CENPC | LZE7T | Human | Esophagus | ESCC | 7.57e-08 | 3.41e-01 | 0.0667 |
| 1060 | CENPC | LZE20T | Human | Esophagus | ESCC | 7.87e-07 | 2.77e-01 | 0.0662 |
| 1060 | CENPC | LZE24T | Human | Esophagus | ESCC | 6.37e-10 | 2.04e-01 | 0.0596 |
| 1060 | CENPC | LZE6T | Human | Esophagus | ESCC | 5.07e-04 | 1.61e-01 | 0.0845 |
| 1060 | CENPC | P1T-E | Human | Esophagus | ESCC | 4.71e-16 | 6.63e-01 | 0.0875 |
| 1060 | CENPC | P2T-E | Human | Esophagus | ESCC | 7.60e-30 | 5.17e-01 | 0.1177 |
| 1060 | CENPC | P4T-E | Human | Esophagus | ESCC | 1.70e-17 | 3.74e-01 | 0.1323 |
| 1060 | CENPC | P5T-E | Human | Esophagus | ESCC | 6.99e-12 | 1.32e-01 | 0.1327 |
| 1060 | CENPC | P8T-E | Human | Esophagus | ESCC | 2.06e-18 | 3.56e-01 | 0.0889 |
| 1060 | CENPC | P9T-E | Human | Esophagus | ESCC | 5.70e-08 | 1.60e-01 | 0.1131 |
| 1060 | CENPC | P10T-E | Human | Esophagus | ESCC | 2.54e-15 | 2.59e-01 | 0.116 |
| 1060 | CENPC | P11T-E | Human | Esophagus | ESCC | 7.40e-18 | 5.56e-01 | 0.1426 |
| 1060 | CENPC | P12T-E | Human | Esophagus | ESCC | 1.30e-28 | 5.41e-01 | 0.1122 |
| 1060 | CENPC | P15T-E | Human | Esophagus | ESCC | 4.90e-17 | 3.65e-01 | 0.1149 |
| 1060 | CENPC | P16T-E | Human | Esophagus | ESCC | 3.76e-21 | 3.13e-01 | 0.1153 |
| 1060 | CENPC | P17T-E | Human | Esophagus | ESCC | 6.56e-03 | 3.13e-01 | 0.1278 |
| 1060 | CENPC | P19T-E | Human | Esophagus | ESCC | 1.45e-02 | 2.40e-01 | 0.1662 |
| 1060 | CENPC | P20T-E | Human | Esophagus | ESCC | 1.95e-37 | 7.71e-01 | 0.1124 |
| Page: 1 2 3 4 5 |
| Tissue | Expression Dynamics | Abbreviation |
| Esophagus | 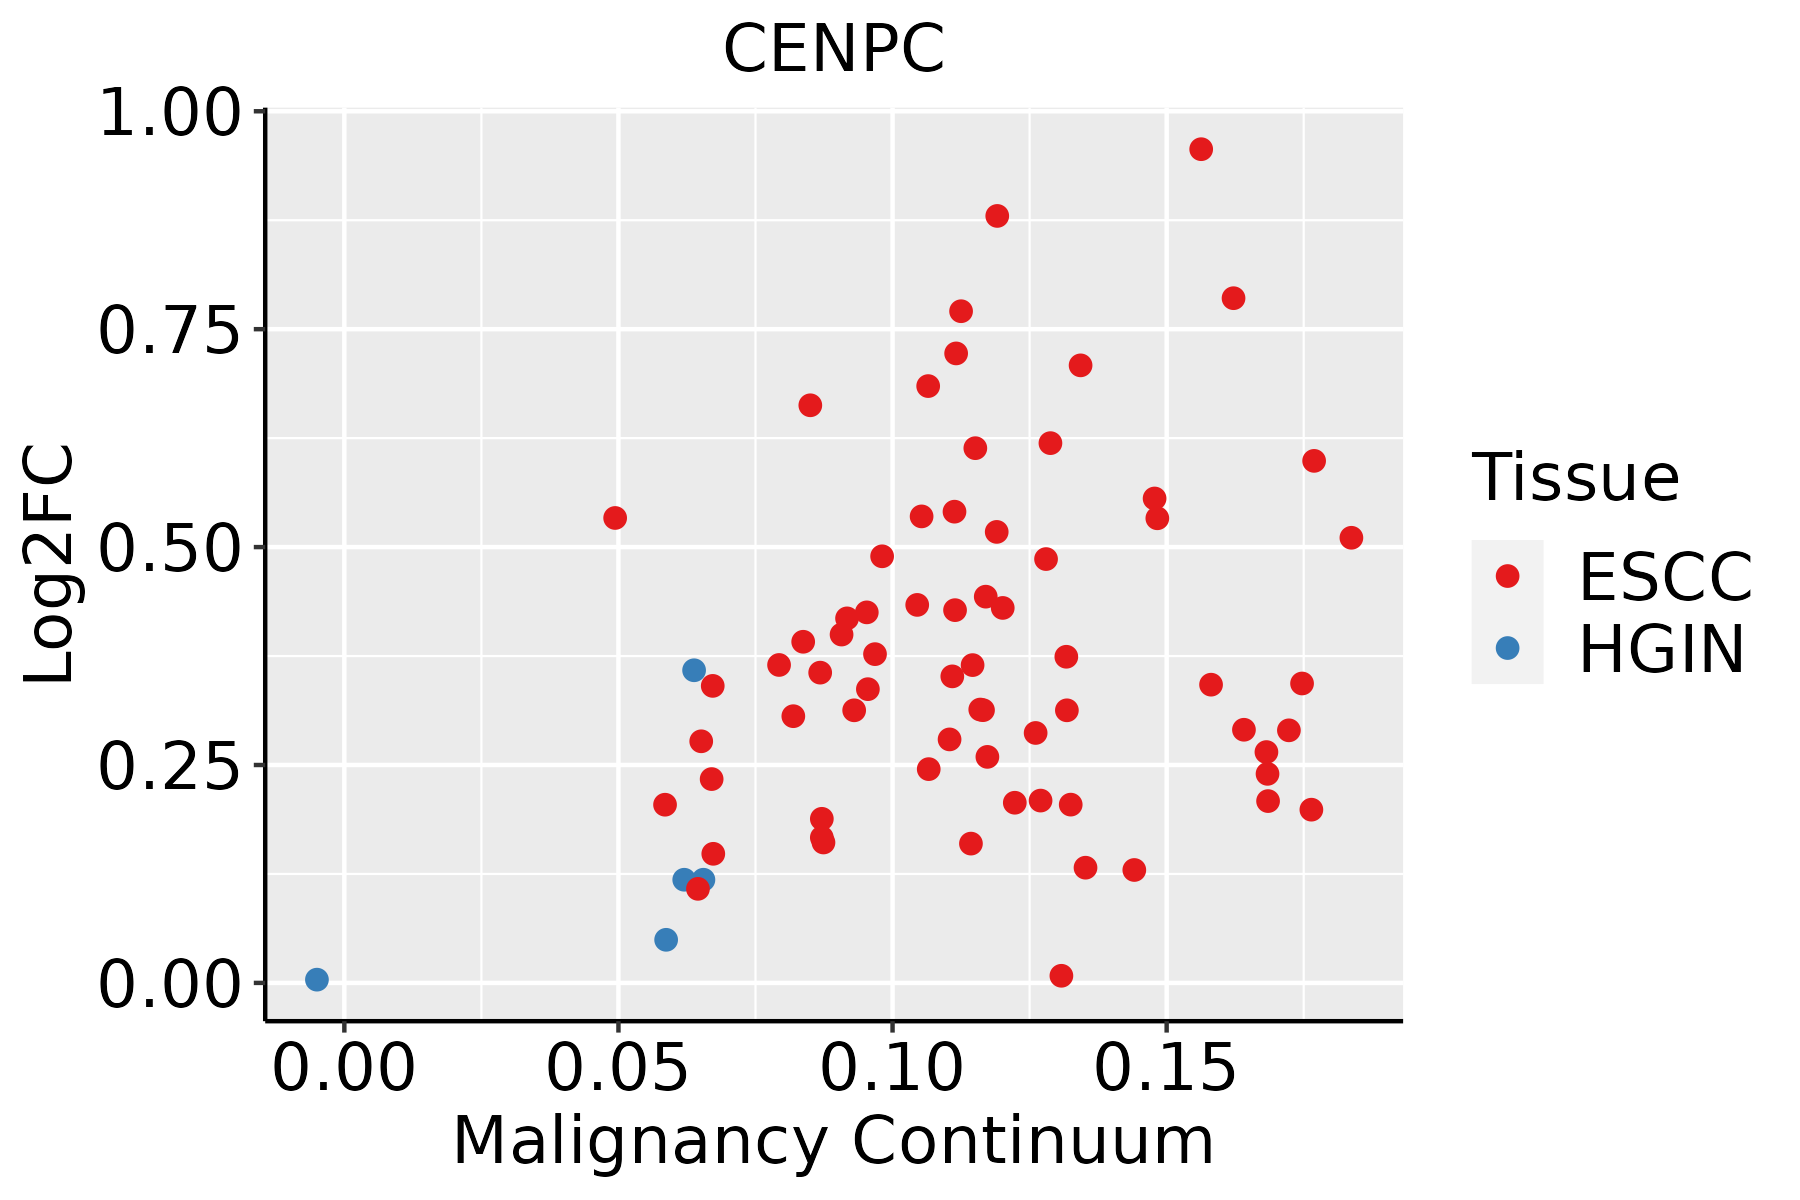 | ESCC: Esophageal squamous cell carcinoma |
| HGIN: High-grade intraepithelial neoplasias | ||
| LGIN: Low-grade intraepithelial neoplasias | ||
| Skin | 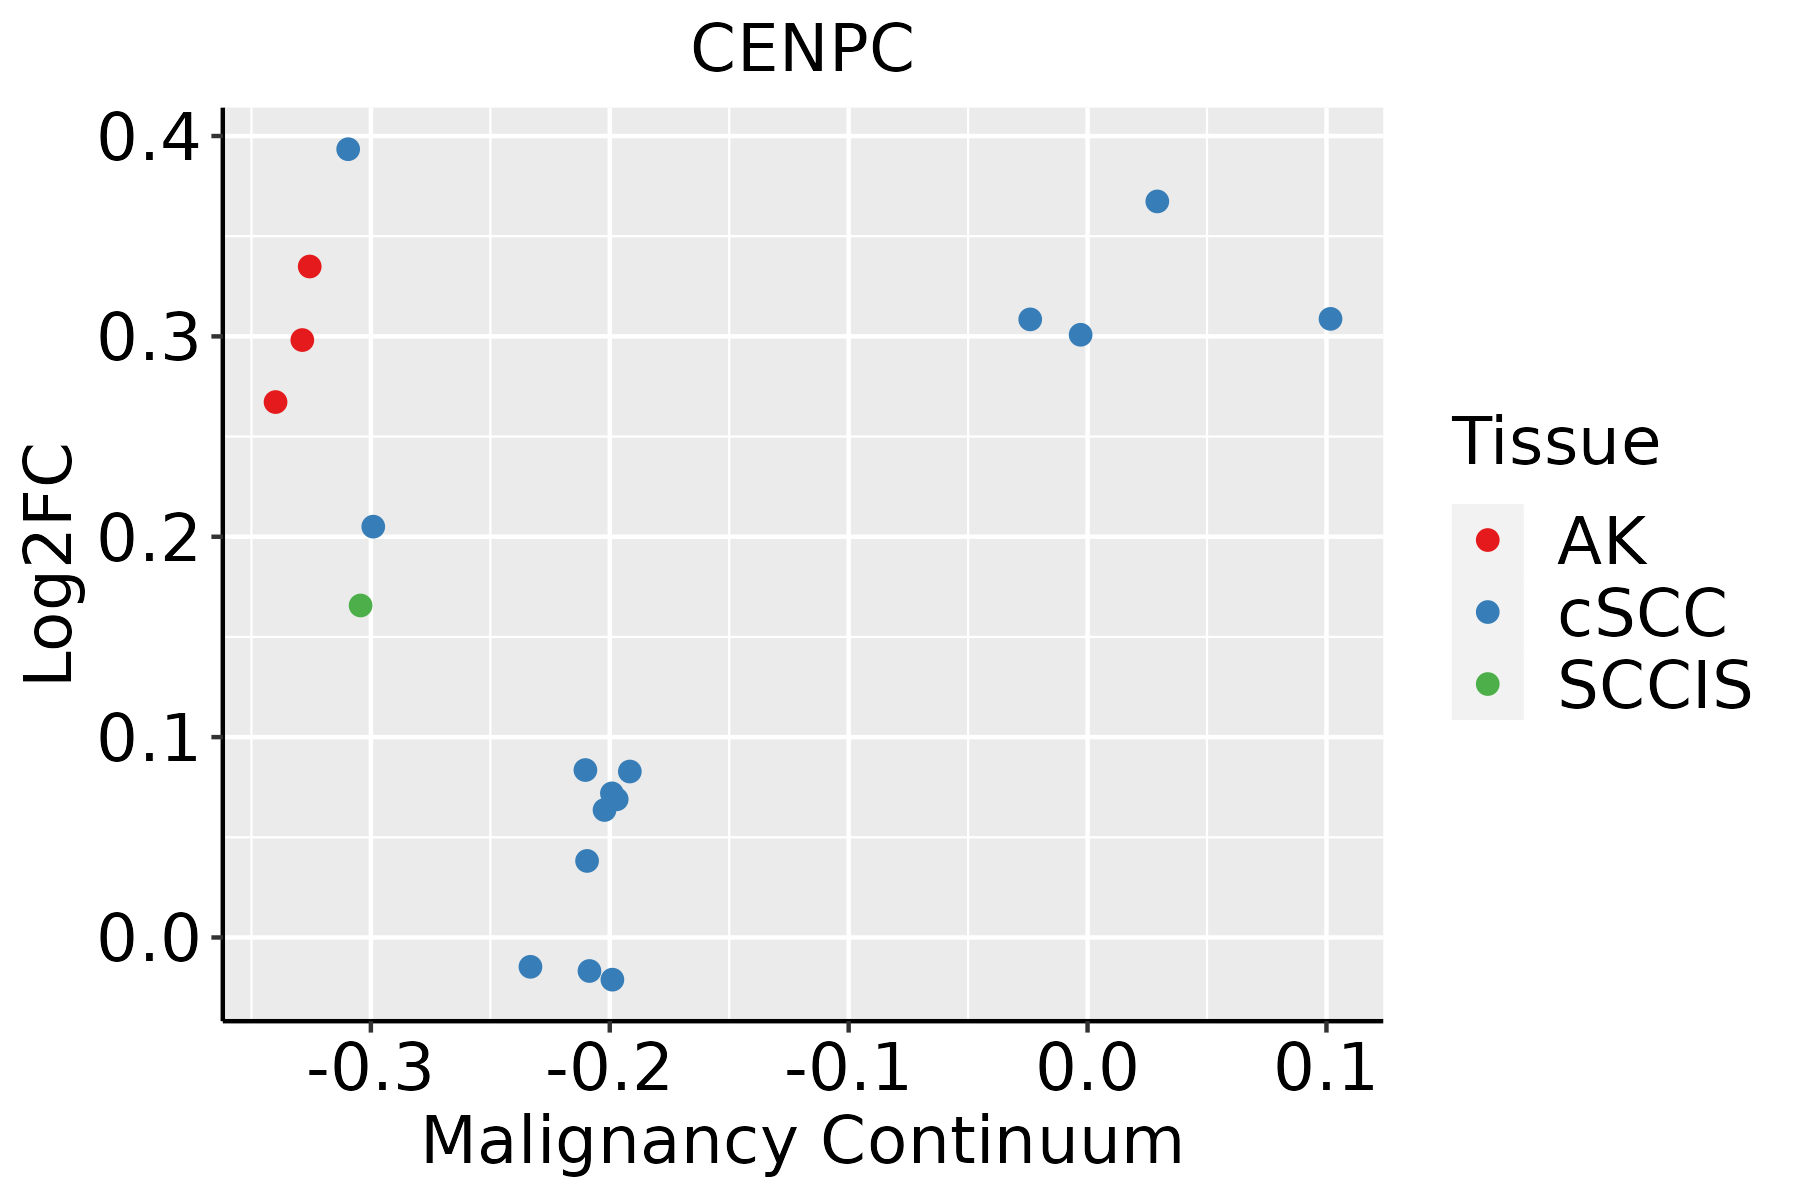 | AK: Actinic keratosis |
| cSCC: Cutaneous squamous cell carcinoma | ||
| SCCIS:squamous cell carcinoma in situ | ||
| Thyroid | 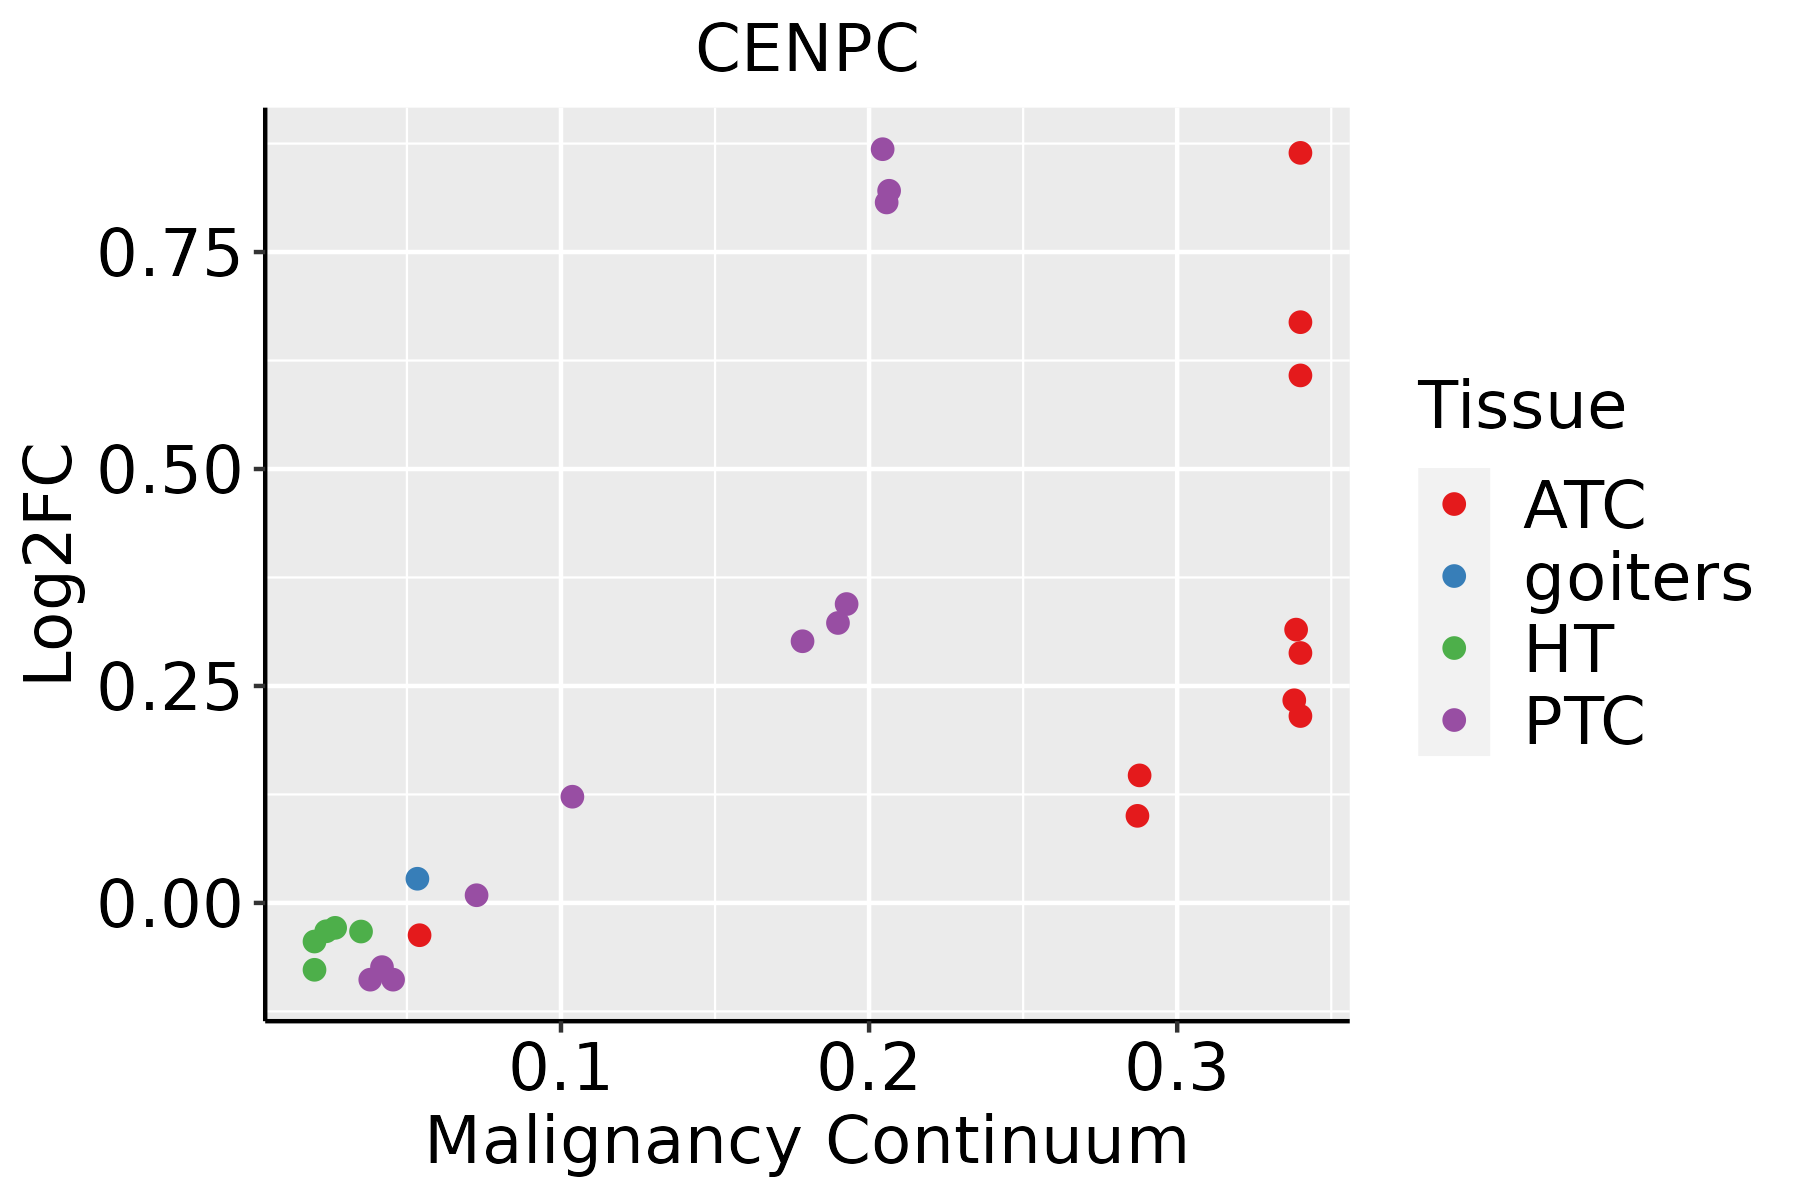 | ATC: Anaplastic thyroid cancer |
| HT: Hashimoto's thyroiditis | ||
| PTC: Papillary thyroid cancer |
| ∗log2FC in expression of this searched gene in stem-like cells from each diseased tissue sample relative to stem-like cells in normal samples in each tissue plotted against the malignancy continuum. Samples are colored based on if they are from different disease stage. |
Top |
Malignant transformation related pathway analysis |
| Find out the enriched GO biological processes and KEGG pathways involved in transition from healthy to precancer to cancer |
| Tissue | Disease Stage | Enriched GO biological Processes |
| Colorectum | AD |  |
| Colorectum | SER |  |
| Colorectum | MSS |  |
| Colorectum | MSI-H |  |
| Colorectum | FAP |  |
| ∗Top 15 enriched GO BP terms are showed in the bar plot of each disease state in each tissue. Each row represents a significant GO biological process which is colored according to the -log10(p.adjust). |
| Page: 1 2 3 4 5 6 7 8 9 |
| GO ID | Tissue | Disease Stage | Description | Gene Ratio | Bg Ratio | pvalue | p.adjust | Count |
| GO:014001414 | Esophagus | ESCC | mitotic nuclear division | 218/8552 | 287/18723 | 6.17e-26 | 1.78e-23 | 218 |
| GO:005165617 | Esophagus | ESCC | establishment of organelle localization | 273/8552 | 390/18723 | 9.13e-23 | 1.81e-20 | 273 |
| GO:000007011 | Esophagus | ESCC | mitotic sister chromatid segregation | 138/8552 | 168/18723 | 1.37e-22 | 2.63e-20 | 138 |
| GO:00008194 | Esophagus | ESCC | sister chromatid segregation | 157/8552 | 202/18723 | 8.41e-21 | 1.33e-18 | 157 |
| GO:000705911 | Esophagus | ESCC | chromosome segregation | 238/8552 | 346/18723 | 1.72e-18 | 1.82e-16 | 238 |
| GO:005131011 | Esophagus | ESCC | metaphase plate congression | 58/8552 | 65/18723 | 1.81e-13 | 8.63e-12 | 58 |
| GO:000708011 | Esophagus | ESCC | mitotic metaphase plate congression | 47/8552 | 50/18723 | 3.15e-13 | 1.47e-11 | 47 |
| GO:00482853 | Esophagus | ESCC | organelle fission | 301/8552 | 488/18723 | 4.64e-13 | 2.12e-11 | 301 |
| GO:00988133 | Esophagus | ESCC | nuclear chromosome segregation | 187/8552 | 281/18723 | 1.00e-12 | 4.36e-11 | 187 |
| GO:005130311 | Esophagus | ESCC | establishment of chromosome localization | 67/8552 | 80/18723 | 1.92e-12 | 8.09e-11 | 67 |
| GO:005000011 | Esophagus | ESCC | chromosome localization | 68/8552 | 82/18723 | 3.37e-12 | 1.32e-10 | 68 |
| GO:00002802 | Esophagus | ESCC | nuclear division | 270/8552 | 439/18723 | 1.17e-11 | 4.24e-10 | 270 |
| GO:00513831 | Esophagus | ESCC | kinetochore organization | 21/8552 | 23/18723 | 5.69e-06 | 5.90e-05 | 21 |
| GO:00086081 | Esophagus | ESCC | attachment of spindle microtubules to kinetochore | 29/8552 | 35/18723 | 6.61e-06 | 6.75e-05 | 29 |
| GO:00513151 | Esophagus | ESCC | attachment of mitotic spindle microtubules to kinetochore | 15/8552 | 15/18723 | 7.81e-06 | 7.69e-05 | 15 |
| GO:00345081 | Esophagus | ESCC | centromere complex assembly | 25/8552 | 30/18723 | 2.45e-05 | 2.09e-04 | 25 |
| GO:00513821 | Esophagus | ESCC | kinetochore assembly | 16/8552 | 18/18723 | 1.78e-04 | 1.15e-03 | 16 |
| GO:005165618 | Skin | AK | establishment of organelle localization | 69/1910 | 390/18723 | 3.69e-06 | 9.11e-05 | 69 |
| GO:00070594 | Skin | AK | chromosome segregation | 60/1910 | 346/18723 | 2.88e-05 | 4.98e-04 | 60 |
| GO:00008195 | Skin | AK | sister chromatid segregation | 37/1910 | 202/18723 | 3.10e-04 | 3.19e-03 | 37 |
| Page: 1 2 3 4 |
| Pathway ID | Tissue | Disease Stage | Description | Gene Ratio | Bg Ratio | pvalue | p.adjust | qvalue | Count |
| Page: 1 |
Top |
Cell-cell communication analysis |
| Identification of potential cell-cell interactions between two cell types and their ligand-receptor pairs for different disease states |
| Ligand | Receptor | LRpair | Pathway | Tissue | Disease Stage |
| Page: 1 |
Top |
Single-cell gene regulatory network inference analysis |
| Find out the significant the regulons (TFs) and the target genes of each regulon across cell types for different disease states |
| TF | Cell Type | Tissue | Disease Stage | Target Gene | RSS | Regulon Activity |
| ∗The dot plots of a searched regulon are shown for all cell subpopulations in each disease state of each tissue based on the regulon specific score inferred using pySCENIC and by calculating the average expression. |
| Page: 1 |
Top |
Somatic mutation of malignant transformation related genes |
| Annotation of somatic variants for genes involved in malignant transformation |
| Hugo Symbol | Variant Class | Variant Classification | dbSNP RS | HGVSc | HGVSp | HGVSp Short | SWISSPROT | BIOTYPE | SIFT | PolyPhen | Tumor Sample Barcode | Tissue | Histology | Sex | Age | Stage | Therapy Types | Drugs | Outcome |
| CENPC | SNV | Missense_Mutation | novel | c.2401N>T | p.Leu801Phe | p.L801F | Q03188 | protein_coding | tolerated(0.14) | probably_damaging(0.957) | TCGA-3C-AALI-01 | Breast | breast invasive carcinoma | Female | <65 | I/II | Unspecific | Poly E | Complete Response |
| CENPC | SNV | Missense_Mutation | rs184128058 | c.1496G>A | p.Arg499His | p.R499H | Q03188 | protein_coding | tolerated(1) | benign(0) | TCGA-A8-A09Z-01 | Breast | breast invasive carcinoma | Female | >=65 | I/II | Unknown | Unknown | SD |
| CENPC | SNV | Missense_Mutation | c.788N>T | p.Ser263Leu | p.S263L | Q03188 | protein_coding | deleterious(0) | probably_damaging(0.994) | TCGA-AC-A23H-01 | Breast | breast invasive carcinoma | Female | >=65 | I/II | Unknown | Unknown | PD | |
| CENPC | SNV | Missense_Mutation | rs267600207 | c.2333C>T | p.Ser778Leu | p.S778L | Q03188 | protein_coding | tolerated(0.07) | benign(0.223) | TCGA-AN-A046-01 | Breast | breast invasive carcinoma | Female | >=65 | I/II | Unknown | Unknown | SD |
| CENPC | SNV | Missense_Mutation | novel | c.648G>T | p.Lys216Asn | p.K216N | Q03188 | protein_coding | tolerated(0.2) | benign(0.031) | TCGA-AN-A046-01 | Breast | breast invasive carcinoma | Female | >=65 | I/II | Unknown | Unknown | SD |
| CENPC | SNV | Missense_Mutation | c.1804N>A | p.Gly602Ser | p.G602S | Q03188 | protein_coding | tolerated(0.65) | benign(0.205) | TCGA-D8-A1XA-01 | Breast | breast invasive carcinoma | Female | <65 | I/II | Unknown | Unknown | SD | |
| CENPC | SNV | Missense_Mutation | novel | c.1354G>A | p.Asp452Asn | p.D452N | Q03188 | protein_coding | tolerated(0.09) | benign(0.421) | TCGA-2W-A8YY-01 | Cervix | cervical & endocervical cancer | Female | <65 | I/II | Chemotherapy | cisplatin | CR |
| CENPC | SNV | Missense_Mutation | novel | c.815G>A | p.Arg272Gln | p.R272Q | Q03188 | protein_coding | deleterious(0.01) | possibly_damaging(0.778) | TCGA-2W-A8YY-01 | Cervix | cervical & endocervical cancer | Female | <65 | I/II | Chemotherapy | cisplatin | CR |
| CENPC | SNV | Missense_Mutation | c.651N>C | p.Lys217Asn | p.K217N | Q03188 | protein_coding | tolerated(0.19) | benign(0.007) | TCGA-FU-A3HZ-01 | Cervix | cervical & endocervical cancer | Female | <65 | I/II | Chemotherapy | cisplatin | CR | |
| CENPC | insertion | Frame_Shift_Ins | rs778937184 | c.2602dupT | p.Ser868PhefsTer28 | p.S868Ffs*28 | Q03188 | protein_coding | TCGA-2W-A8YY-01 | Cervix | cervical & endocervical cancer | Female | <65 | I/II | Chemotherapy | cisplatin | CR |
| Page: 1 2 3 4 5 6 7 8 9 10 11 12 13 |
Top |
Related drugs of malignant transformation related genes |
| Identification of chemicals and drugs interact with genes involved in malignant transfromation |
| (DGIdb 4.0) |
| Entrez ID | Symbol | Category | Interaction Types | Drug Claim Name | Drug Name | PMIDs |
| Page: 1 |

Copyright 2023-Present -The University of Texas Health Science Center at Houston |