
|
|||||
|
 | |
| |
| |
| |
| |
| |
|
Gene: CENPB |
Gene summary for CENPB |
| Gene information | Species | Human | Gene symbol | CENPB | Gene ID | 1059 |
| Gene name | centromere protein B | |
| Gene Alias | CENPB | |
| Cytomap | 20p13 | |
| Gene Type | protein-coding | GO ID | GO:0000775 | UniProtAcc | P07199 |
Top |
Malignant transformation analysis |
| Identification of the aberrant gene expression in precancerous and cancerous lesions by comparing the gene expression of stem-like cells in diseased tissues with normal stem cells |
| Entrez ID | Symbol | Replicates | Species | Organ | Tissue | Adj P-value | Log2FC | Malignancy |
| 1059 | CENPB | HTA11_3410_2000001011 | Human | Colorectum | AD | 3.93e-05 | 2.20e-01 | 0.0155 |
| 1059 | CENPB | HTA11_2487_2000001011 | Human | Colorectum | SER | 3.37e-14 | 5.14e-01 | -0.1808 |
| 1059 | CENPB | HTA11_2951_2000001011 | Human | Colorectum | AD | 2.08e-04 | 4.74e-01 | 0.0216 |
| 1059 | CENPB | HTA11_1938_2000001011 | Human | Colorectum | AD | 1.58e-14 | 6.01e-01 | -0.0811 |
| 1059 | CENPB | HTA11_78_2000001011 | Human | Colorectum | AD | 1.82e-04 | 2.64e-01 | -0.1088 |
| 1059 | CENPB | HTA11_347_2000001011 | Human | Colorectum | AD | 4.14e-11 | 3.97e-01 | -0.1954 |
| 1059 | CENPB | HTA11_411_2000001011 | Human | Colorectum | SER | 2.54e-04 | 5.60e-01 | -0.2602 |
| 1059 | CENPB | HTA11_3361_2000001011 | Human | Colorectum | AD | 3.10e-06 | 4.43e-01 | -0.1207 |
| 1059 | CENPB | HTA11_83_2000001011 | Human | Colorectum | SER | 2.74e-05 | 2.94e-01 | -0.1526 |
| 1059 | CENPB | HTA11_696_2000001011 | Human | Colorectum | AD | 9.86e-12 | 3.17e-01 | -0.1464 |
| 1059 | CENPB | HTA11_866_2000001011 | Human | Colorectum | AD | 1.30e-12 | 2.75e-01 | -0.1001 |
| 1059 | CENPB | HTA11_1391_2000001011 | Human | Colorectum | AD | 1.42e-19 | 6.57e-01 | -0.059 |
| 1059 | CENPB | HTA11_2992_2000001011 | Human | Colorectum | SER | 1.25e-06 | 5.05e-01 | -0.1706 |
| 1059 | CENPB | HTA11_546_2000001011 | Human | Colorectum | AD | 1.31e-05 | 4.40e-01 | -0.0842 |
| 1059 | CENPB | HTA11_866_3004761011 | Human | Colorectum | AD | 2.78e-21 | 5.40e-01 | 0.096 |
| 1059 | CENPB | HTA11_9408_2000001011 | Human | Colorectum | AD | 8.52e-03 | 5.72e-01 | 0.0451 |
| 1059 | CENPB | HTA11_10623_2000001011 | Human | Colorectum | AD | 1.94e-03 | 3.29e-01 | -0.0177 |
| 1059 | CENPB | HTA11_10711_2000001011 | Human | Colorectum | AD | 1.81e-05 | 3.05e-01 | 0.0338 |
| 1059 | CENPB | HTA11_7696_3000711011 | Human | Colorectum | AD | 3.06e-19 | 4.31e-01 | 0.0674 |
| 1059 | CENPB | HTA11_6818_2000001011 | Human | Colorectum | AD | 3.17e-05 | 4.01e-01 | 0.0112 |
| Page: 1 2 3 4 5 6 7 |
| Tissue | Expression Dynamics | Abbreviation |
| Colorectum (GSE201348) |  | FAP: Familial adenomatous polyposis |
| CRC: Colorectal cancer | ||
| Colorectum (HTA11) | 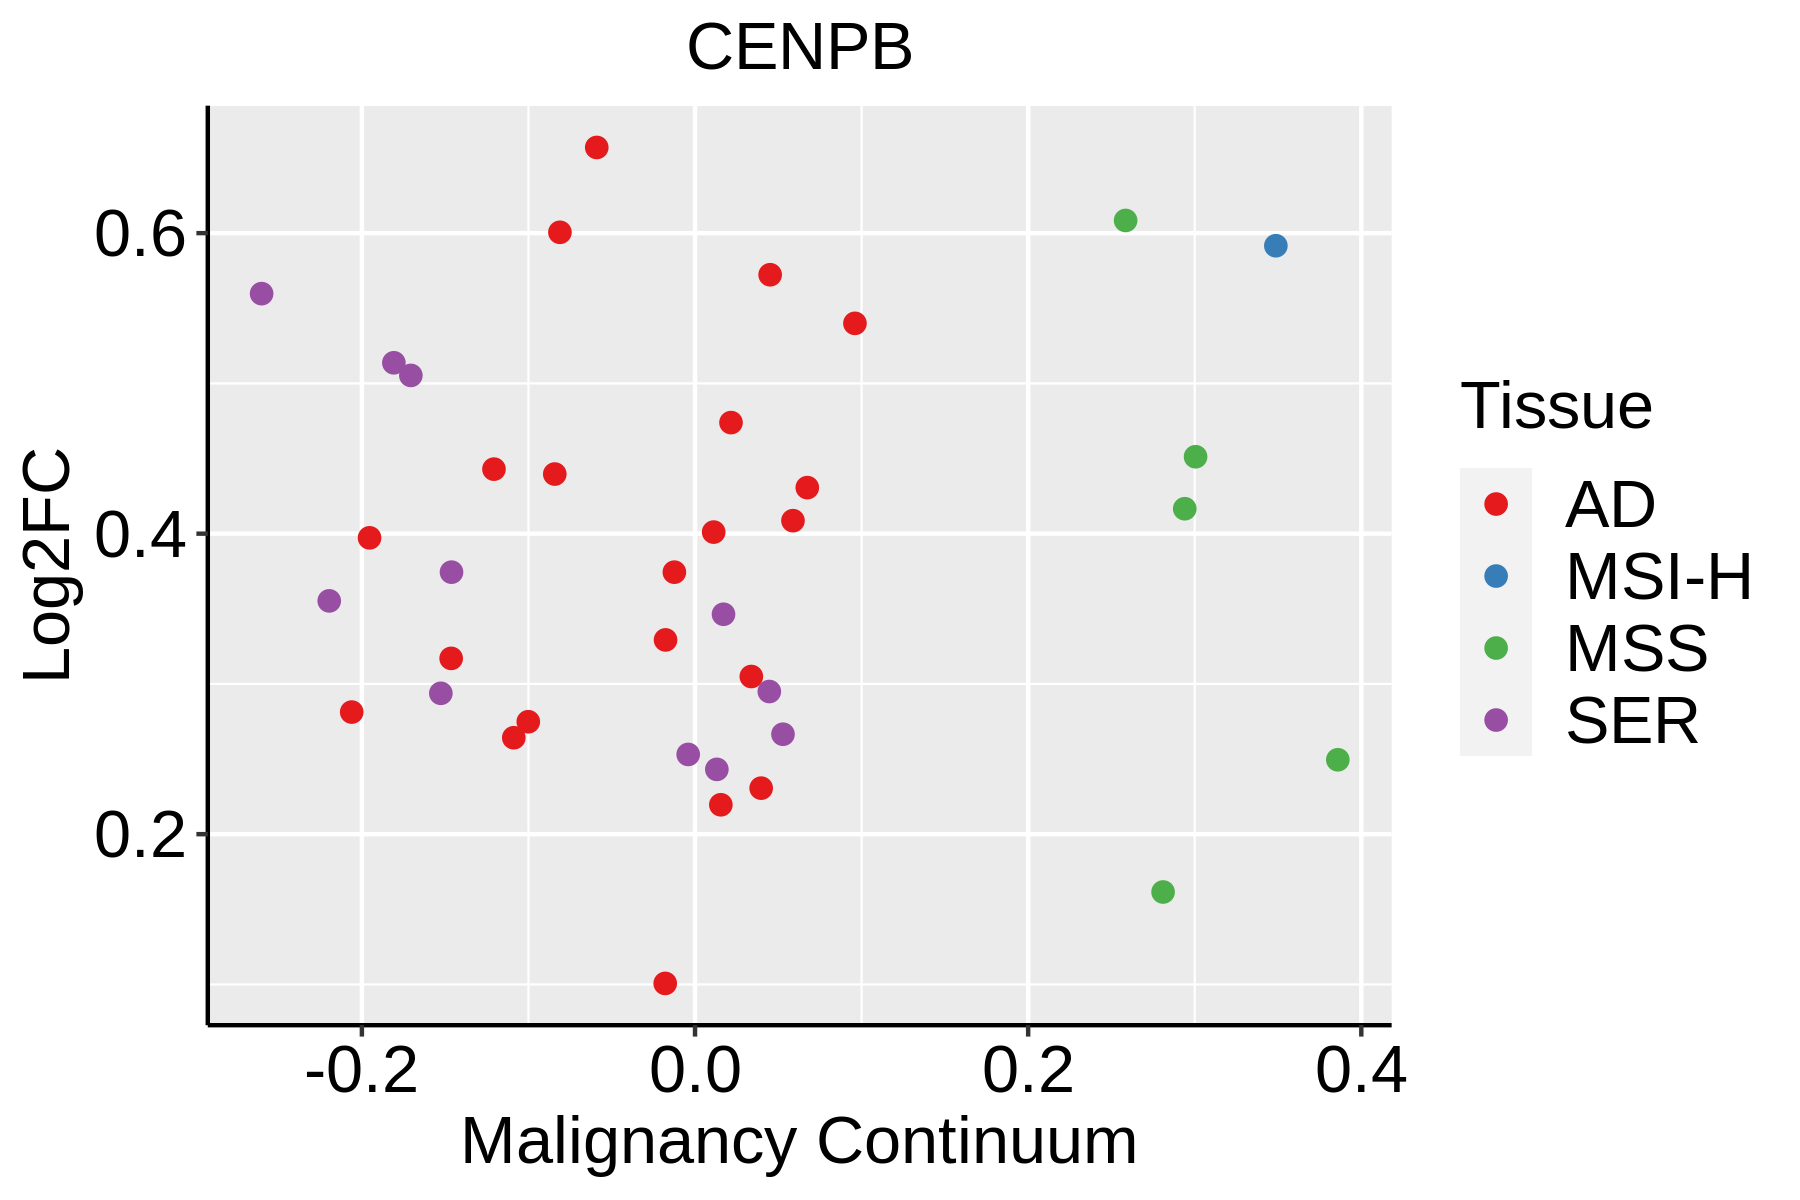 | AD: Adenomas |
| SER: Sessile serrated lesions | ||
| MSI-H: Microsatellite-high colorectal cancer | ||
| MSS: Microsatellite stable colorectal cancer | ||
| Esophagus |  | ESCC: Esophageal squamous cell carcinoma |
| HGIN: High-grade intraepithelial neoplasias | ||
| LGIN: Low-grade intraepithelial neoplasias | ||
| Liver | 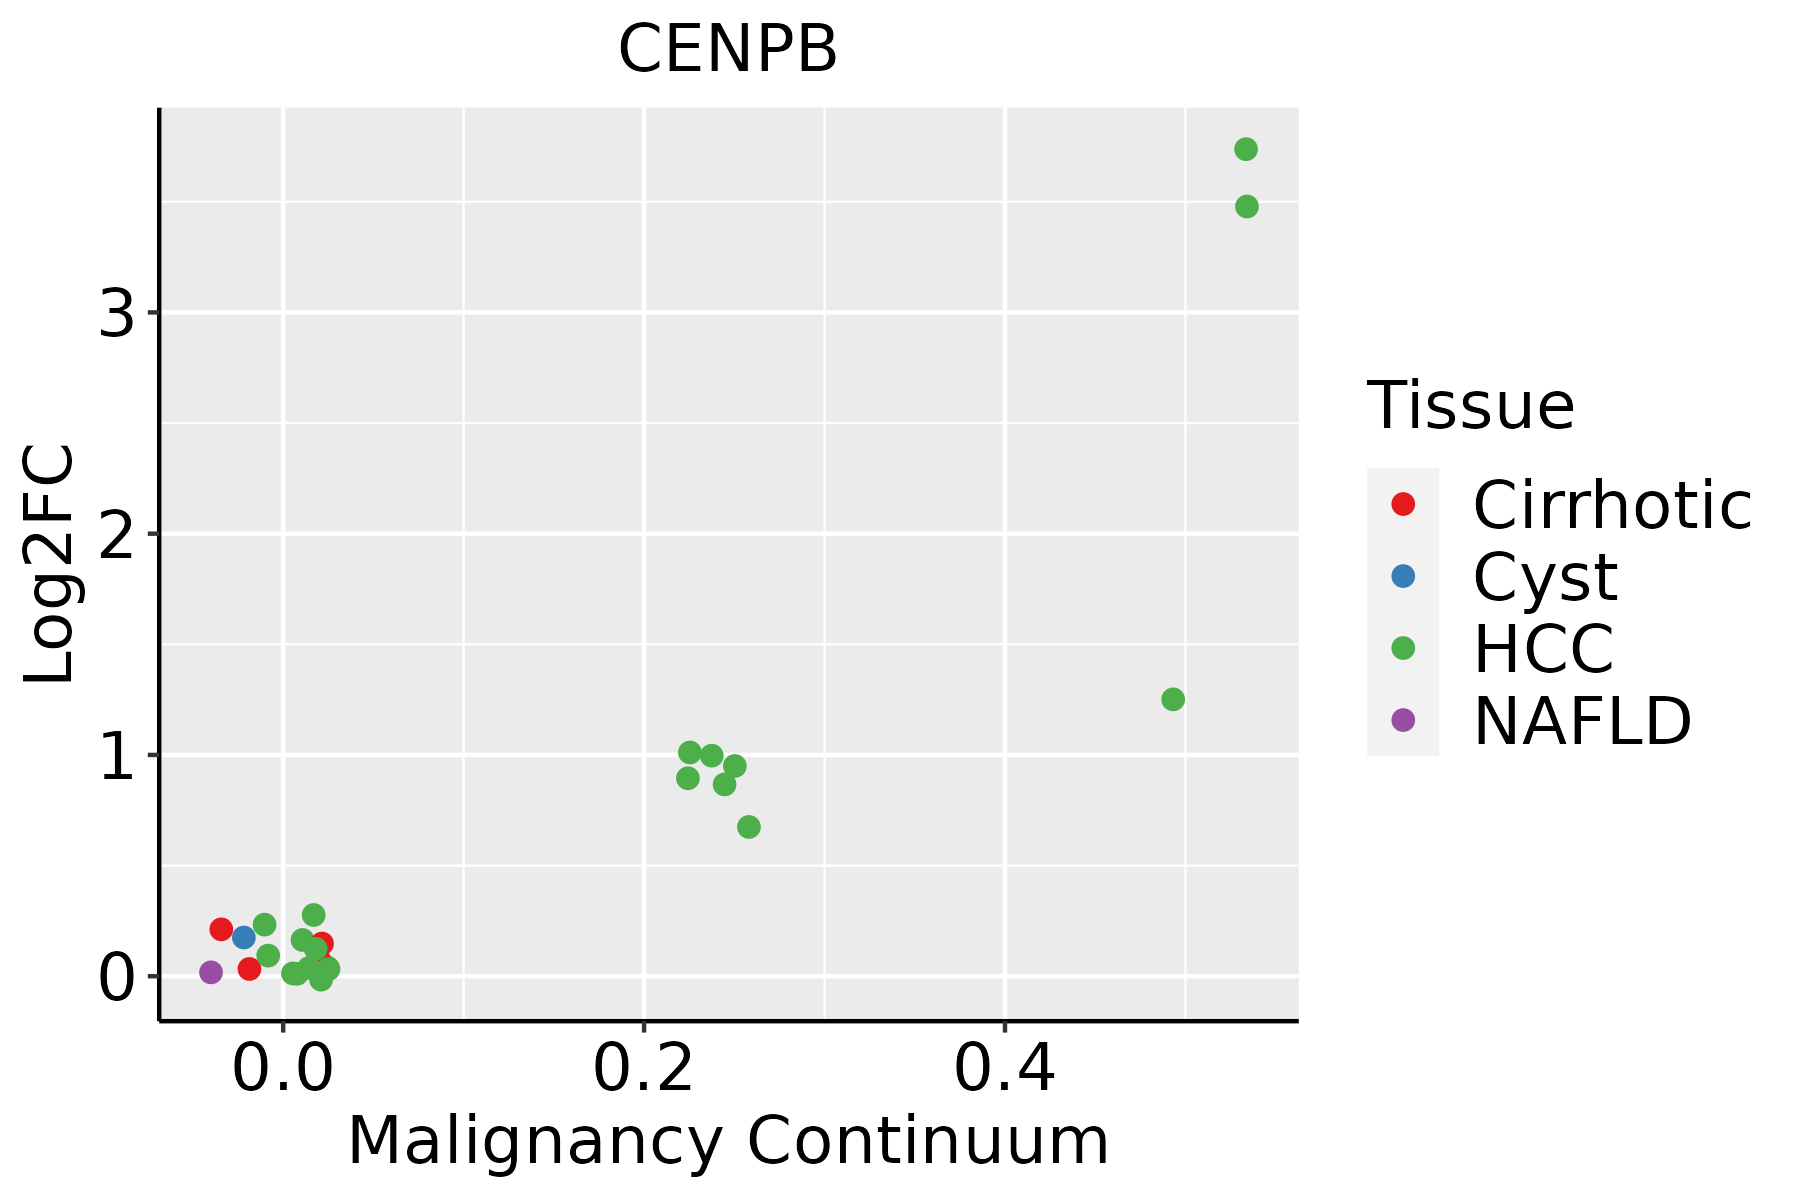 | HCC: Hepatocellular carcinoma |
| NAFLD: Non-alcoholic fatty liver disease | ||
| Oral Cavity | 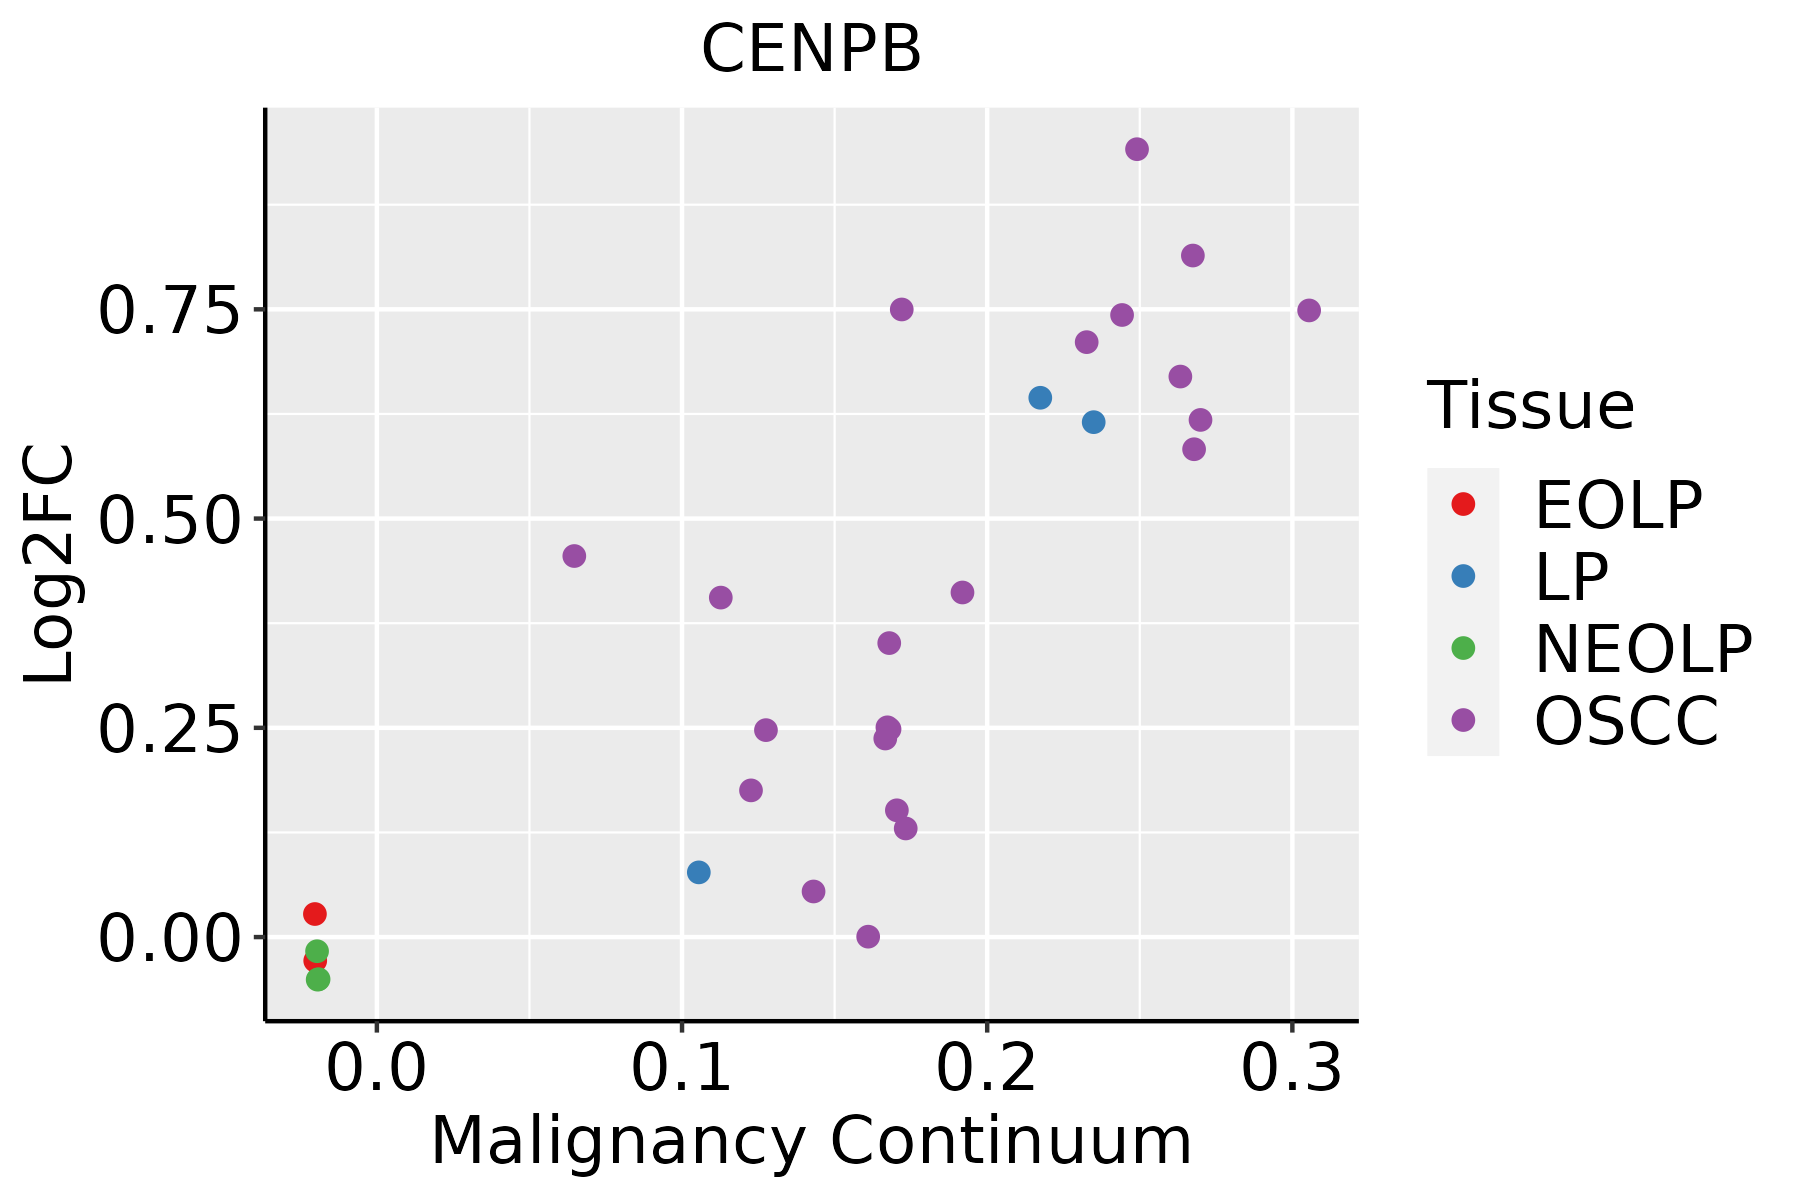 | EOLP: Erosive Oral lichen planus |
| LP: leukoplakia | ||
| NEOLP: Non-erosive oral lichen planus | ||
| OSCC: Oral squamous cell carcinoma | ||
| Skin |  | AK: Actinic keratosis |
| cSCC: Cutaneous squamous cell carcinoma | ||
| SCCIS:squamous cell carcinoma in situ | ||
| Thyroid |  | ATC: Anaplastic thyroid cancer |
| HT: Hashimoto's thyroiditis | ||
| PTC: Papillary thyroid cancer |
| ∗log2FC in expression of this searched gene in stem-like cells from each diseased tissue sample relative to stem-like cells in normal samples in each tissue plotted against the malignancy continuum. Samples are colored based on if they are from different disease stage. |
Top |
Malignant transformation related pathway analysis |
| Find out the enriched GO biological processes and KEGG pathways involved in transition from healthy to precancer to cancer |
| Tissue | Disease Stage | Enriched GO biological Processes |
| Colorectum | AD |  |
| Colorectum | SER |  |
| Colorectum | MSS |  |
| Colorectum | MSI-H |  |
| Colorectum | FAP |  |
| ∗Top 15 enriched GO BP terms are showed in the bar plot of each disease state in each tissue. Each row represents a significant GO biological process which is colored according to the -log10(p.adjust). |
| Page: 1 2 3 4 5 6 7 8 9 |
| GO ID | Tissue | Disease Stage | Description | Gene Ratio | Bg Ratio | pvalue | p.adjust | Count |
| Page: 1 |
| Pathway ID | Tissue | Disease Stage | Description | Gene Ratio | Bg Ratio | pvalue | p.adjust | qvalue | Count |
| Page: 1 |
Top |
Cell-cell communication analysis |
| Identification of potential cell-cell interactions between two cell types and their ligand-receptor pairs for different disease states |
| Ligand | Receptor | LRpair | Pathway | Tissue | Disease Stage |
| Page: 1 |
Top |
Single-cell gene regulatory network inference analysis |
| Find out the significant the regulons (TFs) and the target genes of each regulon across cell types for different disease states |
| TF | Cell Type | Tissue | Disease Stage | Target Gene | RSS | Regulon Activity |
| CENPB | PARI | Stomach | Healthy | YTHDF3,NBL1,RRM2, etc. | 2.68e-02 |  |
| ∗The dot plots of a searched regulon are shown for all cell subpopulations in each disease state of each tissue based on the regulon specific score inferred using pySCENIC and by calculating the average expression. |
| Page: 1 |
Top |
Somatic mutation of malignant transformation related genes |
| Annotation of somatic variants for genes involved in malignant transformation |
| Hugo Symbol | Variant Class | Variant Classification | dbSNP RS | HGVSc | HGVSp | HGVSp Short | SWISSPROT | BIOTYPE | SIFT | PolyPhen | Tumor Sample Barcode | Tissue | Histology | Sex | Age | Stage | Therapy Types | Drugs | Outcome |
| CENPB | SNV | Missense_Mutation | novel | c.1543N>A | p.Glu515Lys | p.E515K | P07199 | protein_coding | deleterious_low_confidence(0.02) | benign(0.052) | TCGA-E2-A14P-01 | Breast | breast invasive carcinoma | Female | >=65 | III/IV | Targeted Molecular therapy | trastuzumab | SD |
| CENPB | deletion | Frame_Shift_Del | novel | c.814delN | p.Gln272ArgfsTer7 | p.Q272Rfs*7 | P07199 | protein_coding | TCGA-D8-A27V-01 | Breast | breast invasive carcinoma | Female | <65 | I/II | Hormone Therapy | tamoxiphen | SD | ||
| CENPB | SNV | Missense_Mutation | novel | c.1612N>C | p.Glu538Gln | p.E538Q | P07199 | protein_coding | deleterious_low_confidence(0.02) | probably_damaging(0.992) | TCGA-VS-A953-01 | Cervix | cervical & endocervical cancer | Female | <65 | I/II | Unknown | Unknown | PD |
| CENPB | SNV | Missense_Mutation | novel | c.1369N>T | p.Asp457Tyr | p.D457Y | P07199 | protein_coding | tolerated_low_confidence(0.05) | benign(0.261) | TCGA-ZJ-AAXB-01 | Cervix | cervical & endocervical cancer | Female | <65 | I/II | Unknown | Unknown | SD |
| CENPB | deletion | In_Frame_Del | rs754367212 | c.1242_1256delAGAGGAGGAGGAAGA | p.Glu415_Glu419del | p.E415_E419del | P07199 | protein_coding | TCGA-EK-A3GM-01 | Cervix | cervical & endocervical cancer | Female | >=65 | I/II | Unknown | Unknown | SD | ||
| CENPB | SNV | Missense_Mutation | novel | c.869N>A | p.Arg290His | p.R290H | P07199 | protein_coding | deleterious(0) | probably_damaging(0.957) | TCGA-A6-3809-01 | Colorectum | colon adenocarcinoma | Female | >=65 | I/II | Unknown | Unknown | SD |
| CENPB | SNV | Missense_Mutation | novel | c.311C>T | p.Ala104Val | p.A104V | P07199 | protein_coding | deleterious(0) | probably_damaging(0.999) | TCGA-AA-3947-01 | Colorectum | colon adenocarcinoma | Female | <65 | I/II | Unknown | Unknown | SD |
| CENPB | SNV | Missense_Mutation | c.1130N>T | p.Pro377Leu | p.P377L | P07199 | protein_coding | deleterious(0.03) | possibly_damaging(0.83) | TCGA-AG-3881-01 | Colorectum | rectum adenocarcinoma | Female | >=65 | I/II | Unknown | Unknown | SD | |
| CENPB | SNV | Missense_Mutation | rs765081320 | c.1585G>A | p.Asp529Asn | p.D529N | P07199 | protein_coding | deleterious_low_confidence(0.01) | possibly_damaging(0.57) | TCGA-AG-3902-01 | Colorectum | rectum adenocarcinoma | Male | <65 | I/II | Unknown | Unknown | SD |
| CENPB | deletion | Frame_Shift_Del | rs772292203 | c.1312delN | p.Glu438LysfsTer43 | p.E438Kfs*43 | P07199 | protein_coding | TCGA-AZ-6598-01 | Colorectum | colon adenocarcinoma | Female | >=65 | I/II | Unknown | Unknown | SD |
| Page: 1 2 3 4 5 |
Top |
Related drugs of malignant transformation related genes |
| Identification of chemicals and drugs interact with genes involved in malignant transfromation |
| (DGIdb 4.0) |
| Entrez ID | Symbol | Category | Interaction Types | Drug Claim Name | Drug Name | PMIDs |
| Page: 1 |

Copyright 2023-Present -The University of Texas Health Science Center at Houston |