
|
|||||
|
 | |
| |
| |
| |
| |
| |
|
Gene: CEMIP2 |
Gene summary for CEMIP2 |
| Gene information | Species | Human | Gene symbol | CEMIP2 | Gene ID | 23670 |
| Gene name | cell migration inducing hyaluronidase 2 | |
| Gene Alias | TMEM2 | |
| Cytomap | 9q21.13 | |
| Gene Type | protein-coding | GO ID | GO:0001525 | UniProtAcc | Q9UHN6 |
Top |
Malignant transformation analysis |
| Identification of the aberrant gene expression in precancerous and cancerous lesions by comparing the gene expression of stem-like cells in diseased tissues with normal stem cells |
| Entrez ID | Symbol | Replicates | Species | Organ | Tissue | Adj P-value | Log2FC | Malignancy |
| 23670 | CEMIP2 | HTA11_1938_2000001011 | Human | Colorectum | AD | 6.64e-10 | 7.16e-01 | -0.0811 |
| 23670 | CEMIP2 | HTA11_347_2000001011 | Human | Colorectum | AD | 2.21e-02 | 4.02e-01 | -0.1954 |
| 23670 | CEMIP2 | HTA11_1391_2000001011 | Human | Colorectum | AD | 1.73e-03 | 6.33e-01 | -0.059 |
| 23670 | CEMIP2 | HTA11_99999970781_79442 | Human | Colorectum | MSS | 3.91e-47 | -8.38e-01 | 0.294 |
| 23670 | CEMIP2 | HTA11_99999965104_69814 | Human | Colorectum | MSS | 3.35e-19 | -8.38e-01 | 0.281 |
| 23670 | CEMIP2 | HTA11_99999971662_82457 | Human | Colorectum | MSS | 8.87e-46 | -8.38e-01 | 0.3859 |
| 23670 | CEMIP2 | HTA11_99999973899_84307 | Human | Colorectum | MSS | 6.01e-15 | -8.38e-01 | 0.2585 |
| 23670 | CEMIP2 | HTA11_99999974143_84620 | Human | Colorectum | MSS | 5.75e-49 | -8.38e-01 | 0.3005 |
| 23670 | CEMIP2 | F007 | Human | Colorectum | FAP | 3.99e-02 | 7.52e-02 | 0.1176 |
| 23670 | CEMIP2 | A002-C-010 | Human | Colorectum | FAP | 2.35e-09 | 3.09e-01 | 0.242 |
| 23670 | CEMIP2 | A001-C-207 | Human | Colorectum | FAP | 1.33e-02 | 1.95e-01 | 0.1278 |
| 23670 | CEMIP2 | A015-C-203 | Human | Colorectum | FAP | 5.56e-24 | -1.89e-01 | -0.1294 |
| 23670 | CEMIP2 | A015-C-204 | Human | Colorectum | FAP | 1.18e-04 | -2.30e-01 | -0.0228 |
| 23670 | CEMIP2 | A014-C-040 | Human | Colorectum | FAP | 2.40e-02 | -6.53e-02 | -0.1184 |
| 23670 | CEMIP2 | A002-C-201 | Human | Colorectum | FAP | 1.07e-10 | 2.68e-02 | 0.0324 |
| 23670 | CEMIP2 | A001-C-119 | Human | Colorectum | FAP | 5.43e-06 | -9.14e-02 | -0.1557 |
| 23670 | CEMIP2 | A001-C-108 | Human | Colorectum | FAP | 6.73e-13 | 9.04e-02 | -0.0272 |
| 23670 | CEMIP2 | A002-C-021 | Human | Colorectum | FAP | 1.71e-02 | 2.83e-01 | 0.1171 |
| 23670 | CEMIP2 | A002-C-205 | Human | Colorectum | FAP | 3.41e-20 | -9.62e-02 | -0.1236 |
| 23670 | CEMIP2 | A001-C-104 | Human | Colorectum | FAP | 3.89e-04 | 1.69e-01 | 0.0184 |
| Page: 1 2 3 4 5 6 7 8 9 |
| Tissue | Expression Dynamics | Abbreviation |
| Colorectum (GSE201348) |  | FAP: Familial adenomatous polyposis |
| CRC: Colorectal cancer | ||
| Colorectum (HTA11) |  | AD: Adenomas |
| SER: Sessile serrated lesions | ||
| MSI-H: Microsatellite-high colorectal cancer | ||
| MSS: Microsatellite stable colorectal cancer | ||
| Endometrium | 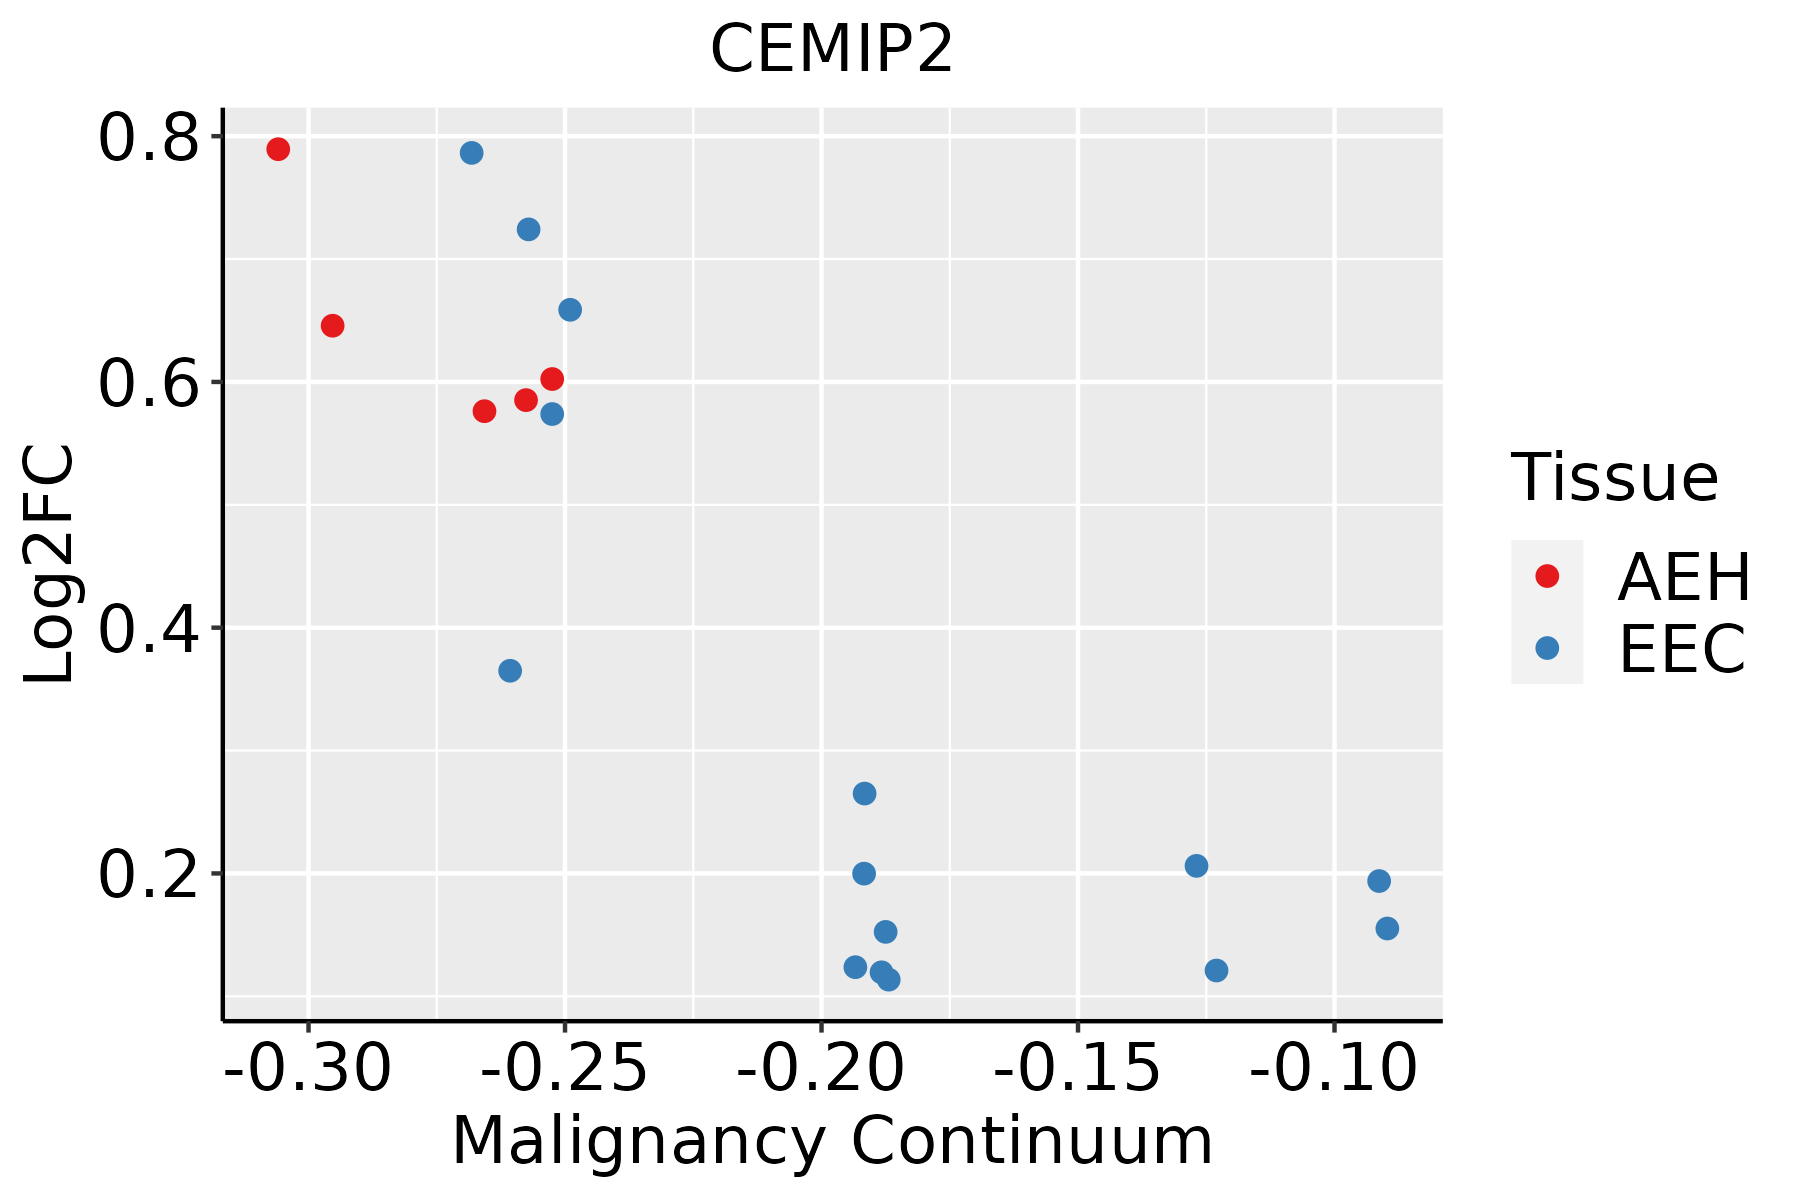 | AEH: Atypical endometrial hyperplasia |
| EEC: Endometrioid Cancer | ||
| Esophagus |  | ESCC: Esophageal squamous cell carcinoma |
| HGIN: High-grade intraepithelial neoplasias | ||
| LGIN: Low-grade intraepithelial neoplasias | ||
| GC | 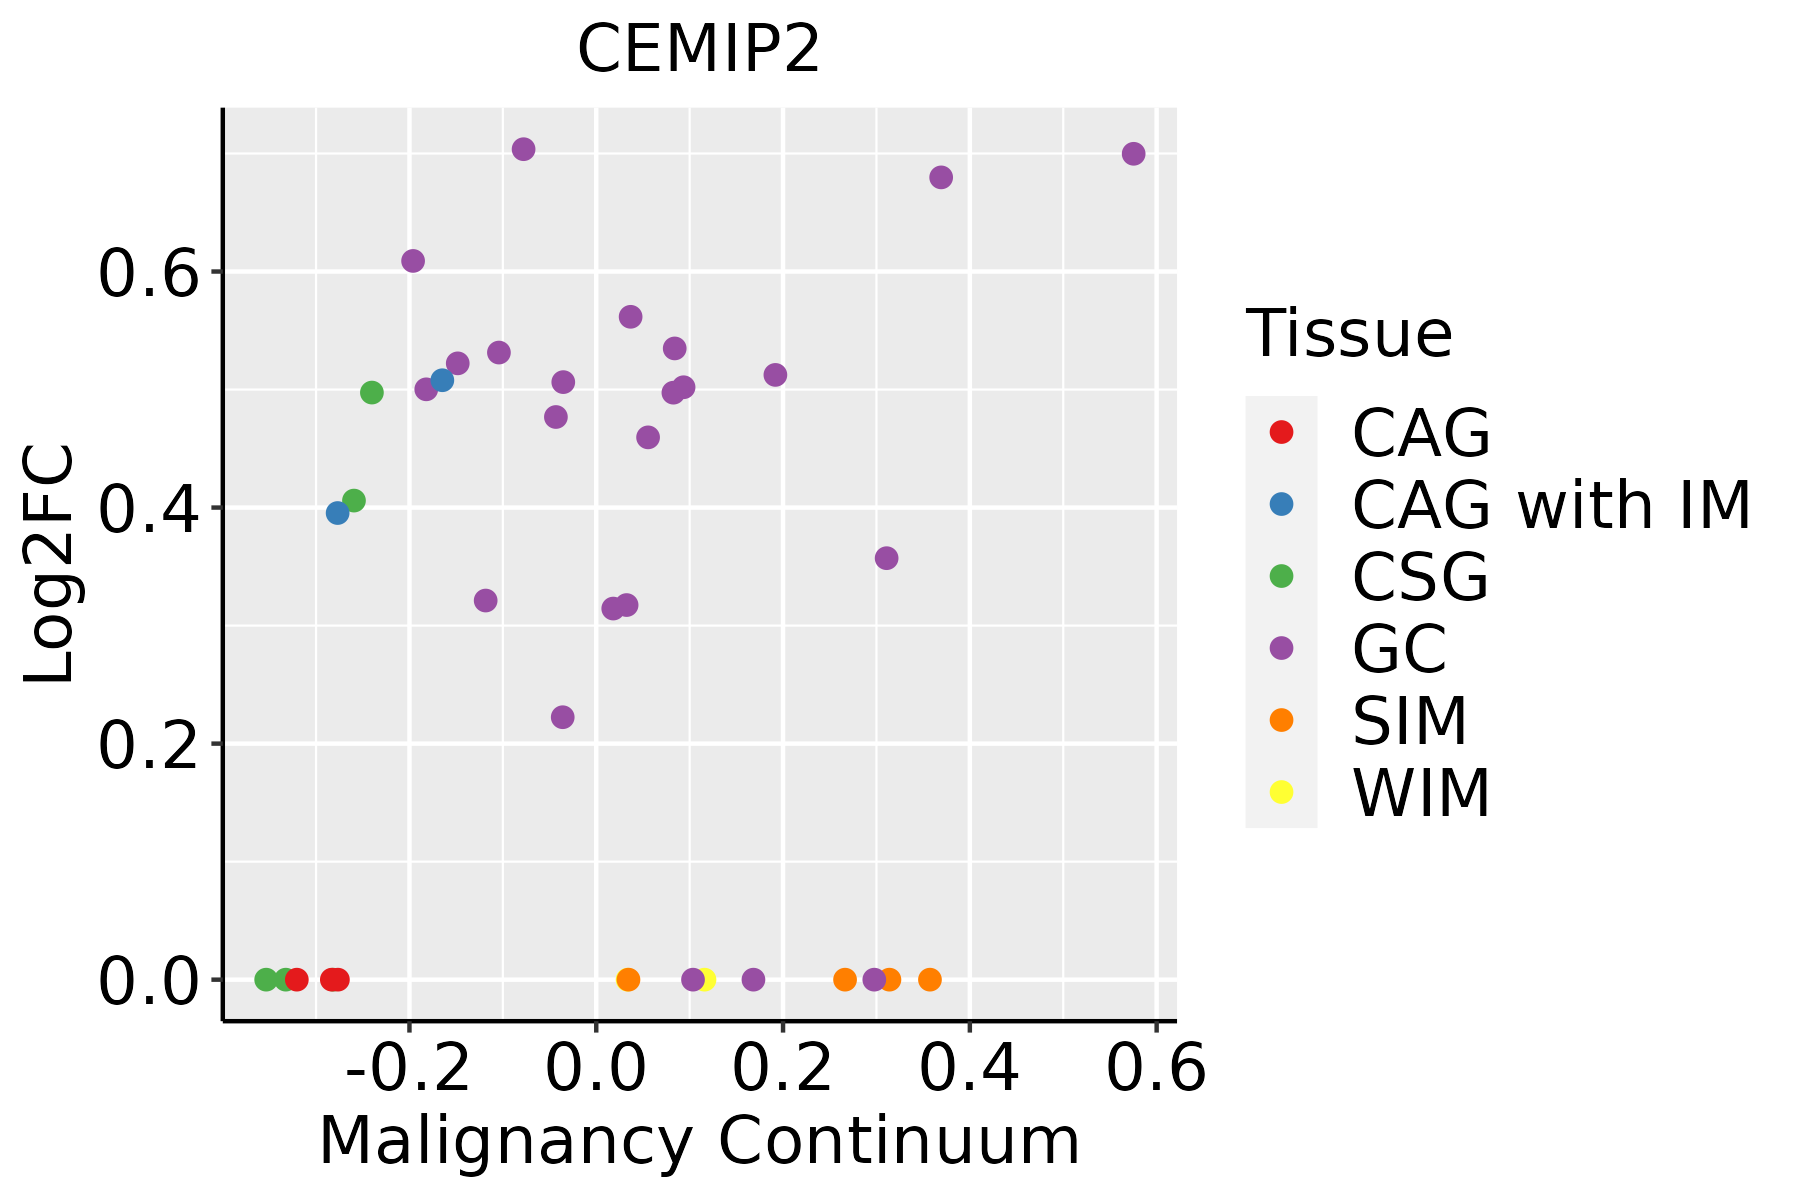 | CAG: Chronic atrophic gastritis |
| CAG with IM: Chronic atrophic gastritis with intestinal metaplasia | ||
| CSG: Chronic superficial gastritis | ||
| GC: Gastric cancer | ||
| SIM: Severe intestinal metaplasia | ||
| WIM: Wild intestinal metaplasia | ||
| Liver | 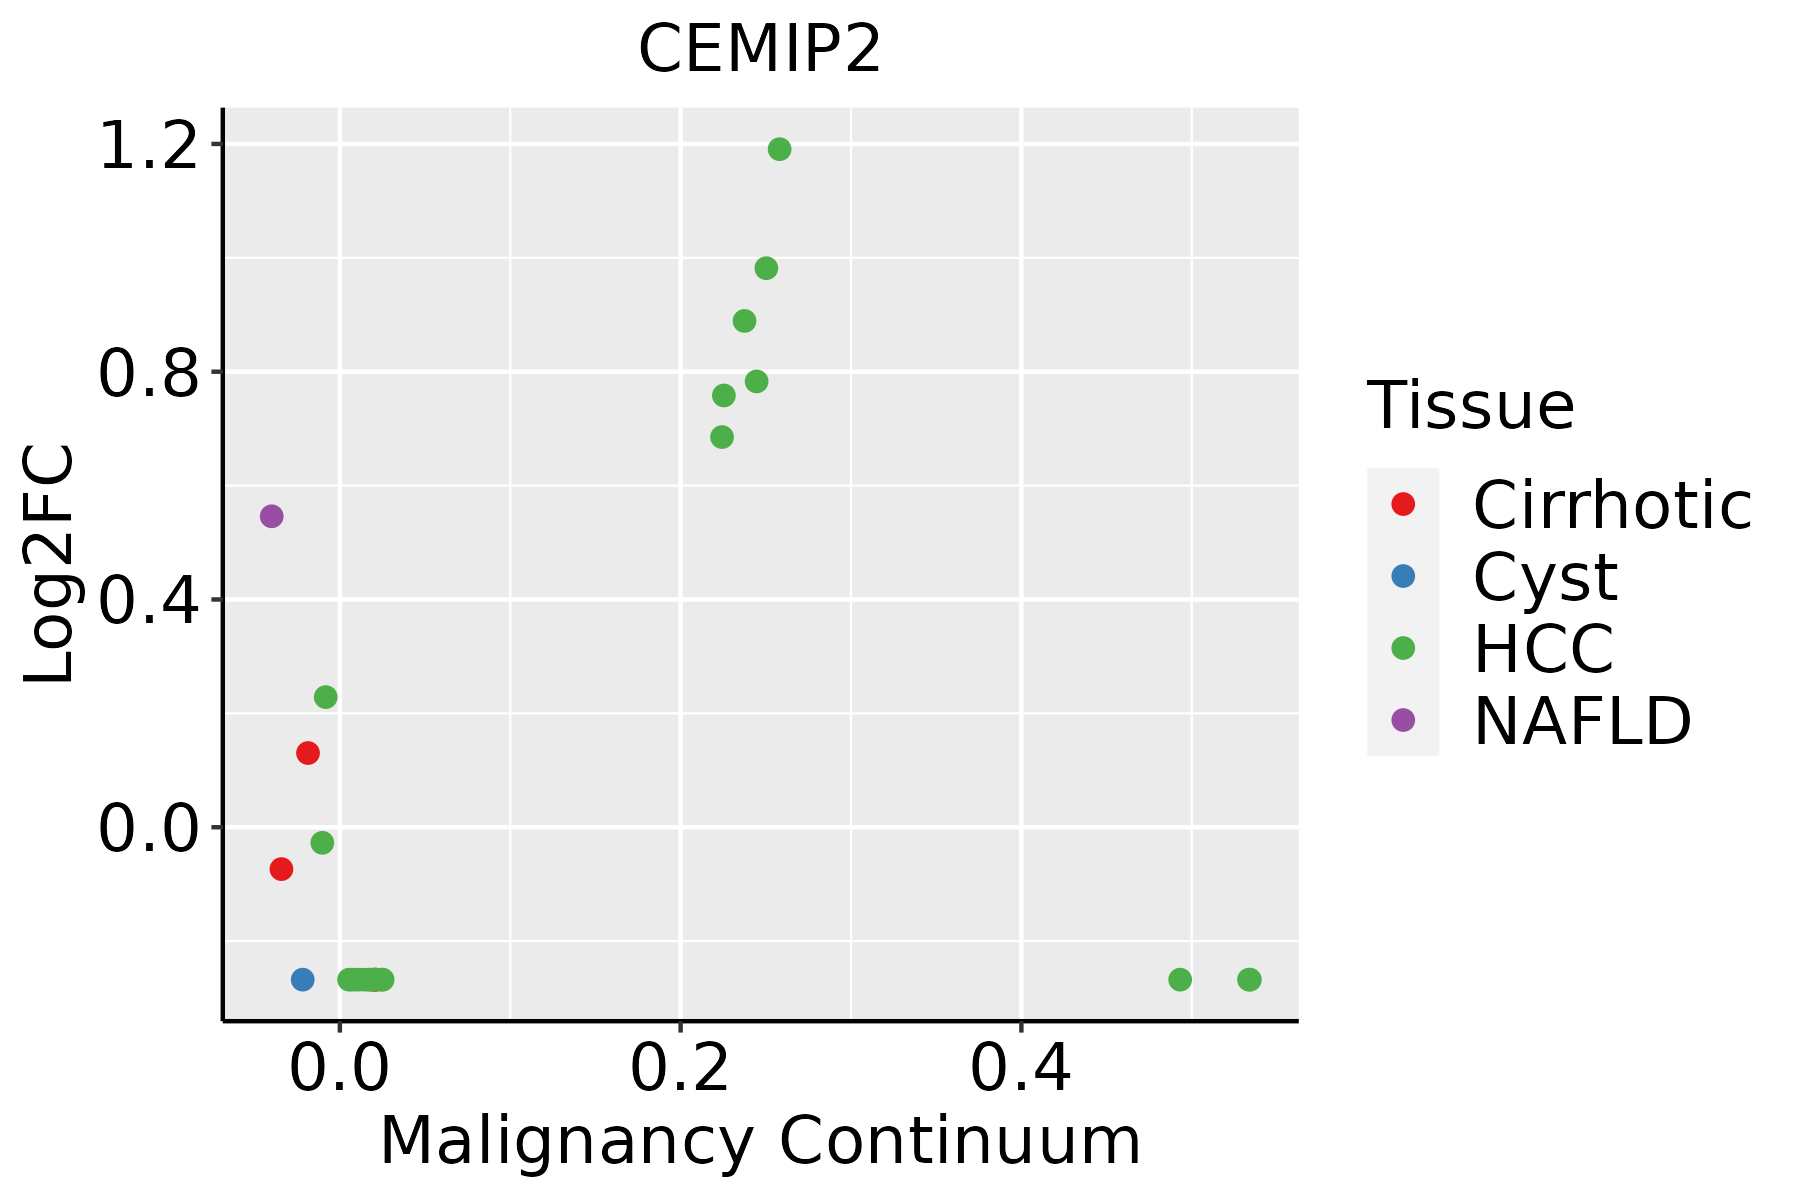 | HCC: Hepatocellular carcinoma |
| NAFLD: Non-alcoholic fatty liver disease | ||
| Lung | 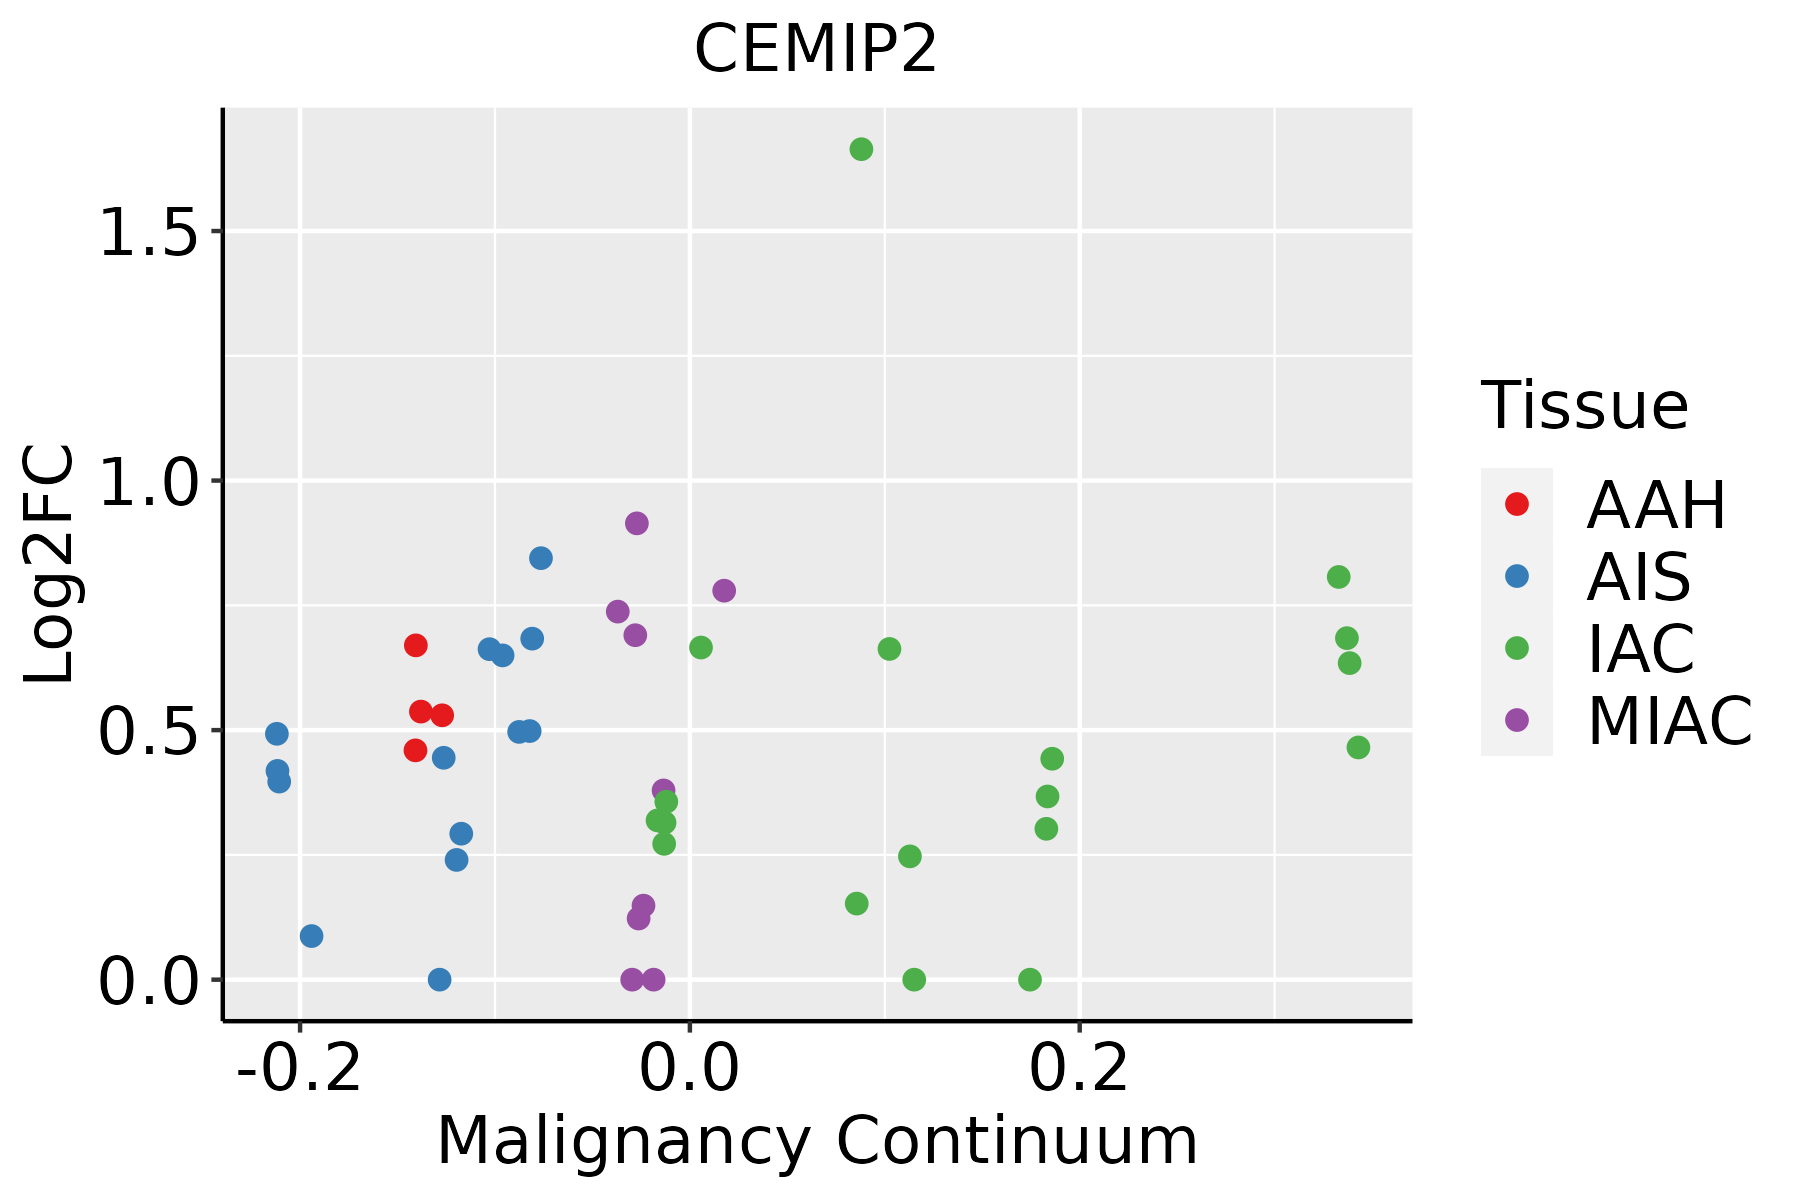 | AAH: Atypical adenomatous hyperplasia |
| AIS: Adenocarcinoma in situ | ||
| IAC: Invasive lung adenocarcinoma | ||
| MIA: Minimally invasive adenocarcinoma | ||
| Prostate | 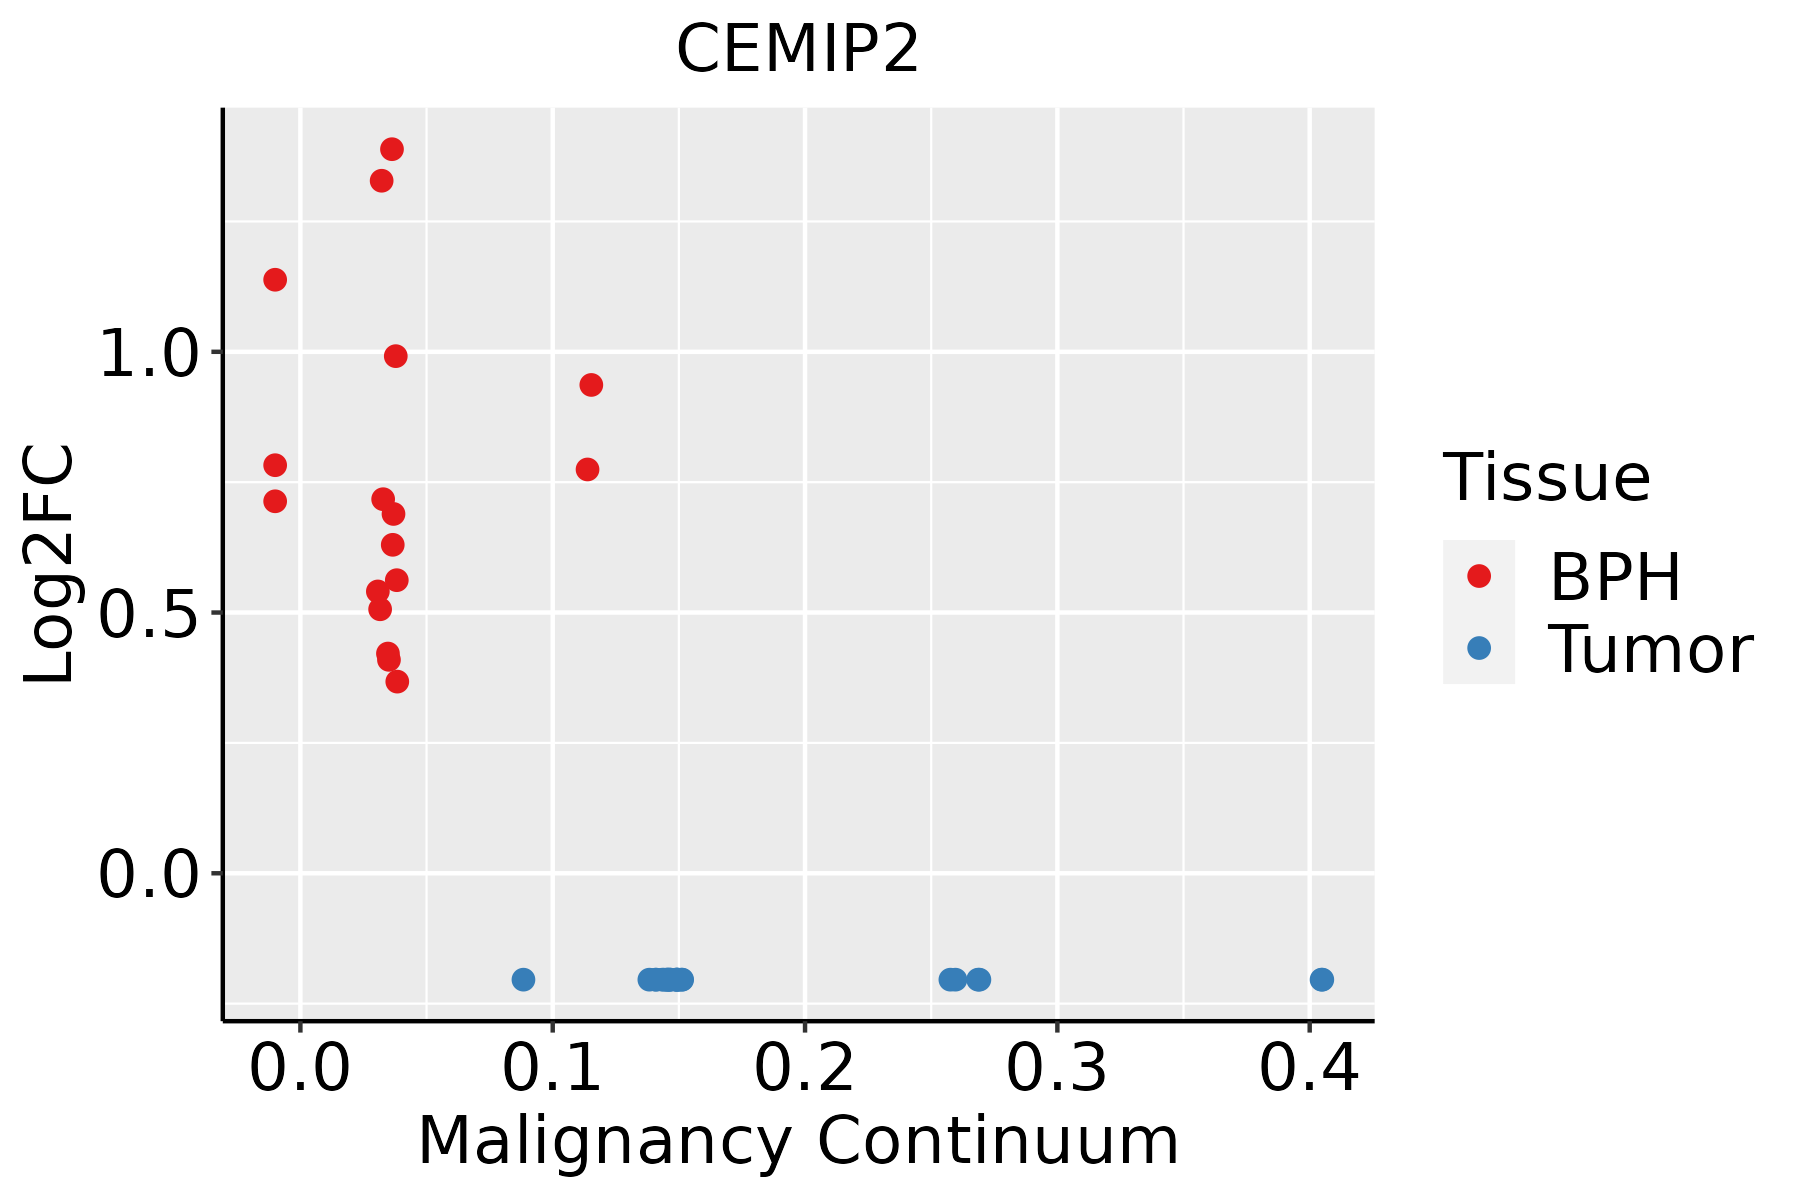 | BPH: Benign Prostatic Hyperplasia |
| Skin | 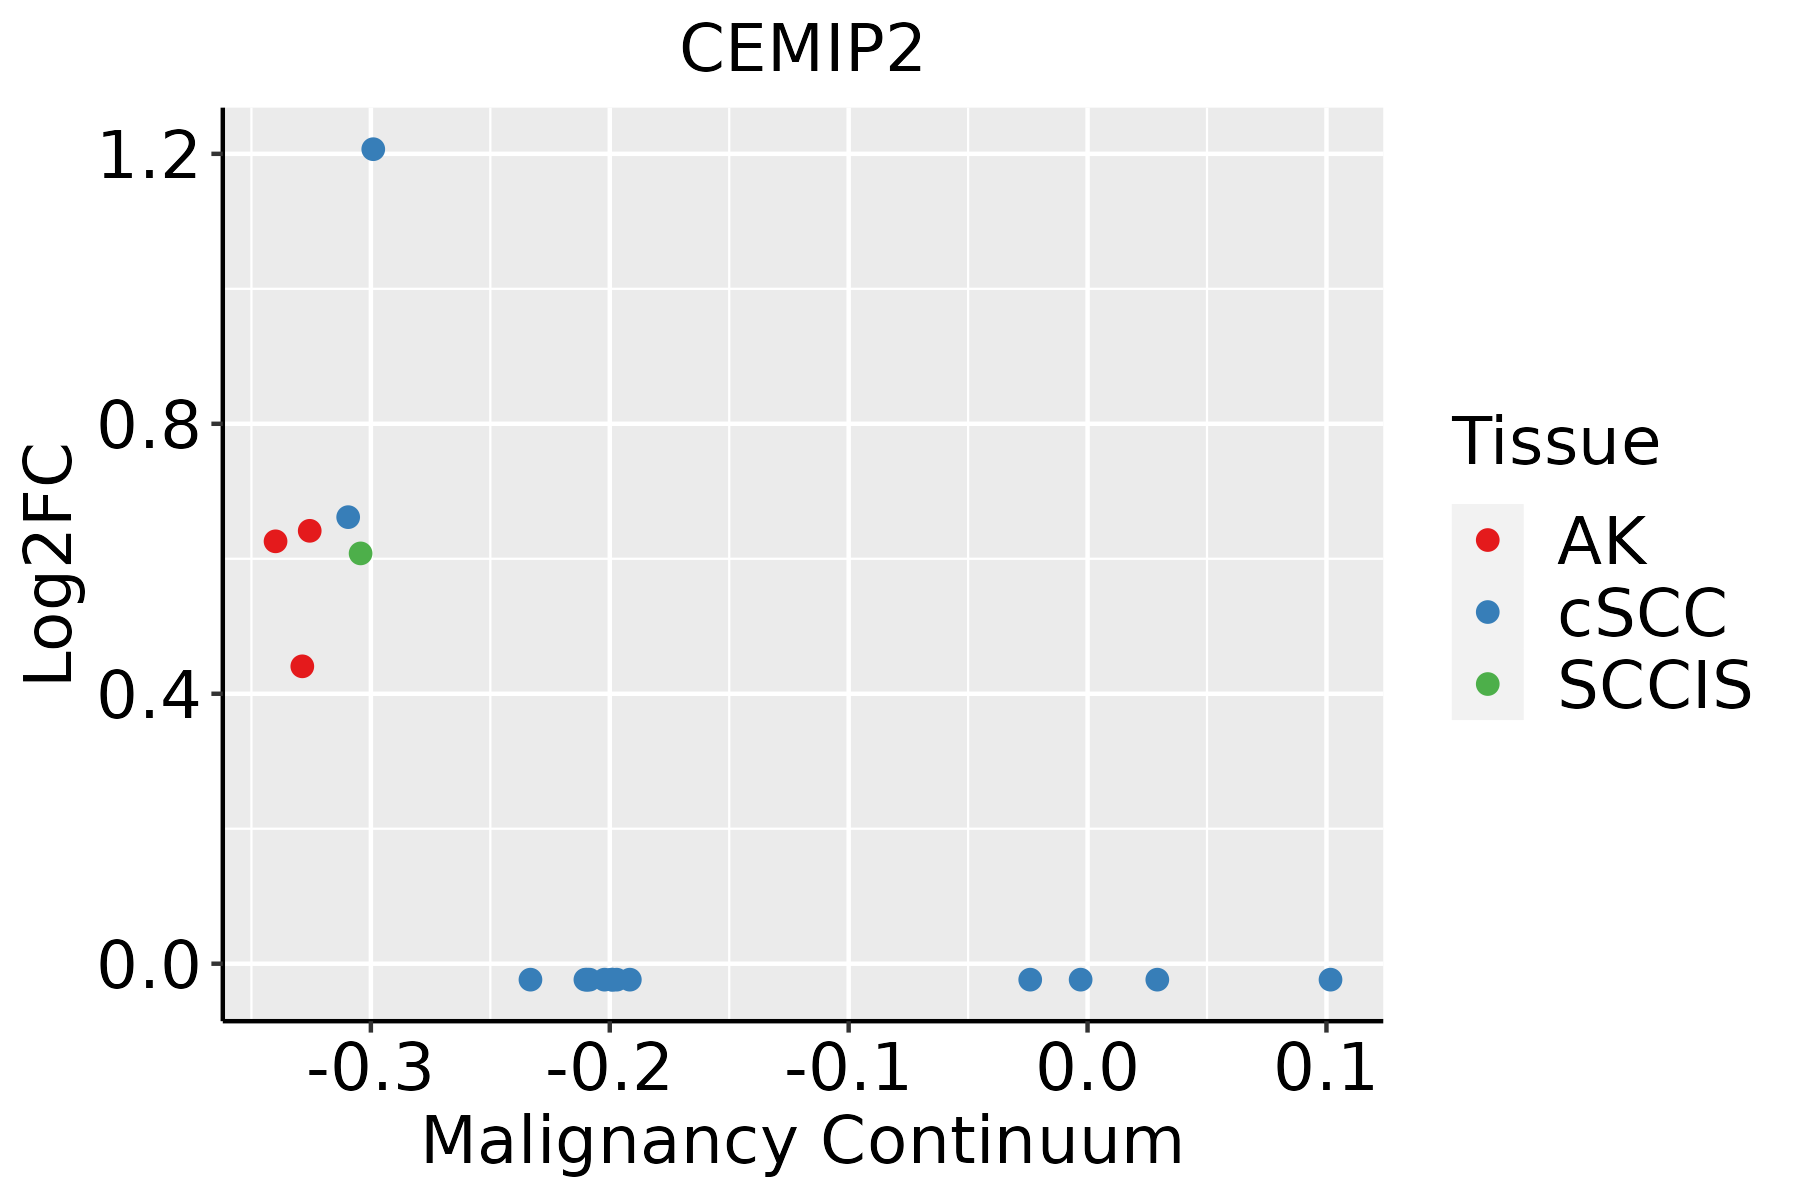 | AK: Actinic keratosis |
| cSCC: Cutaneous squamous cell carcinoma | ||
| SCCIS:squamous cell carcinoma in situ | ||
| Thyroid | 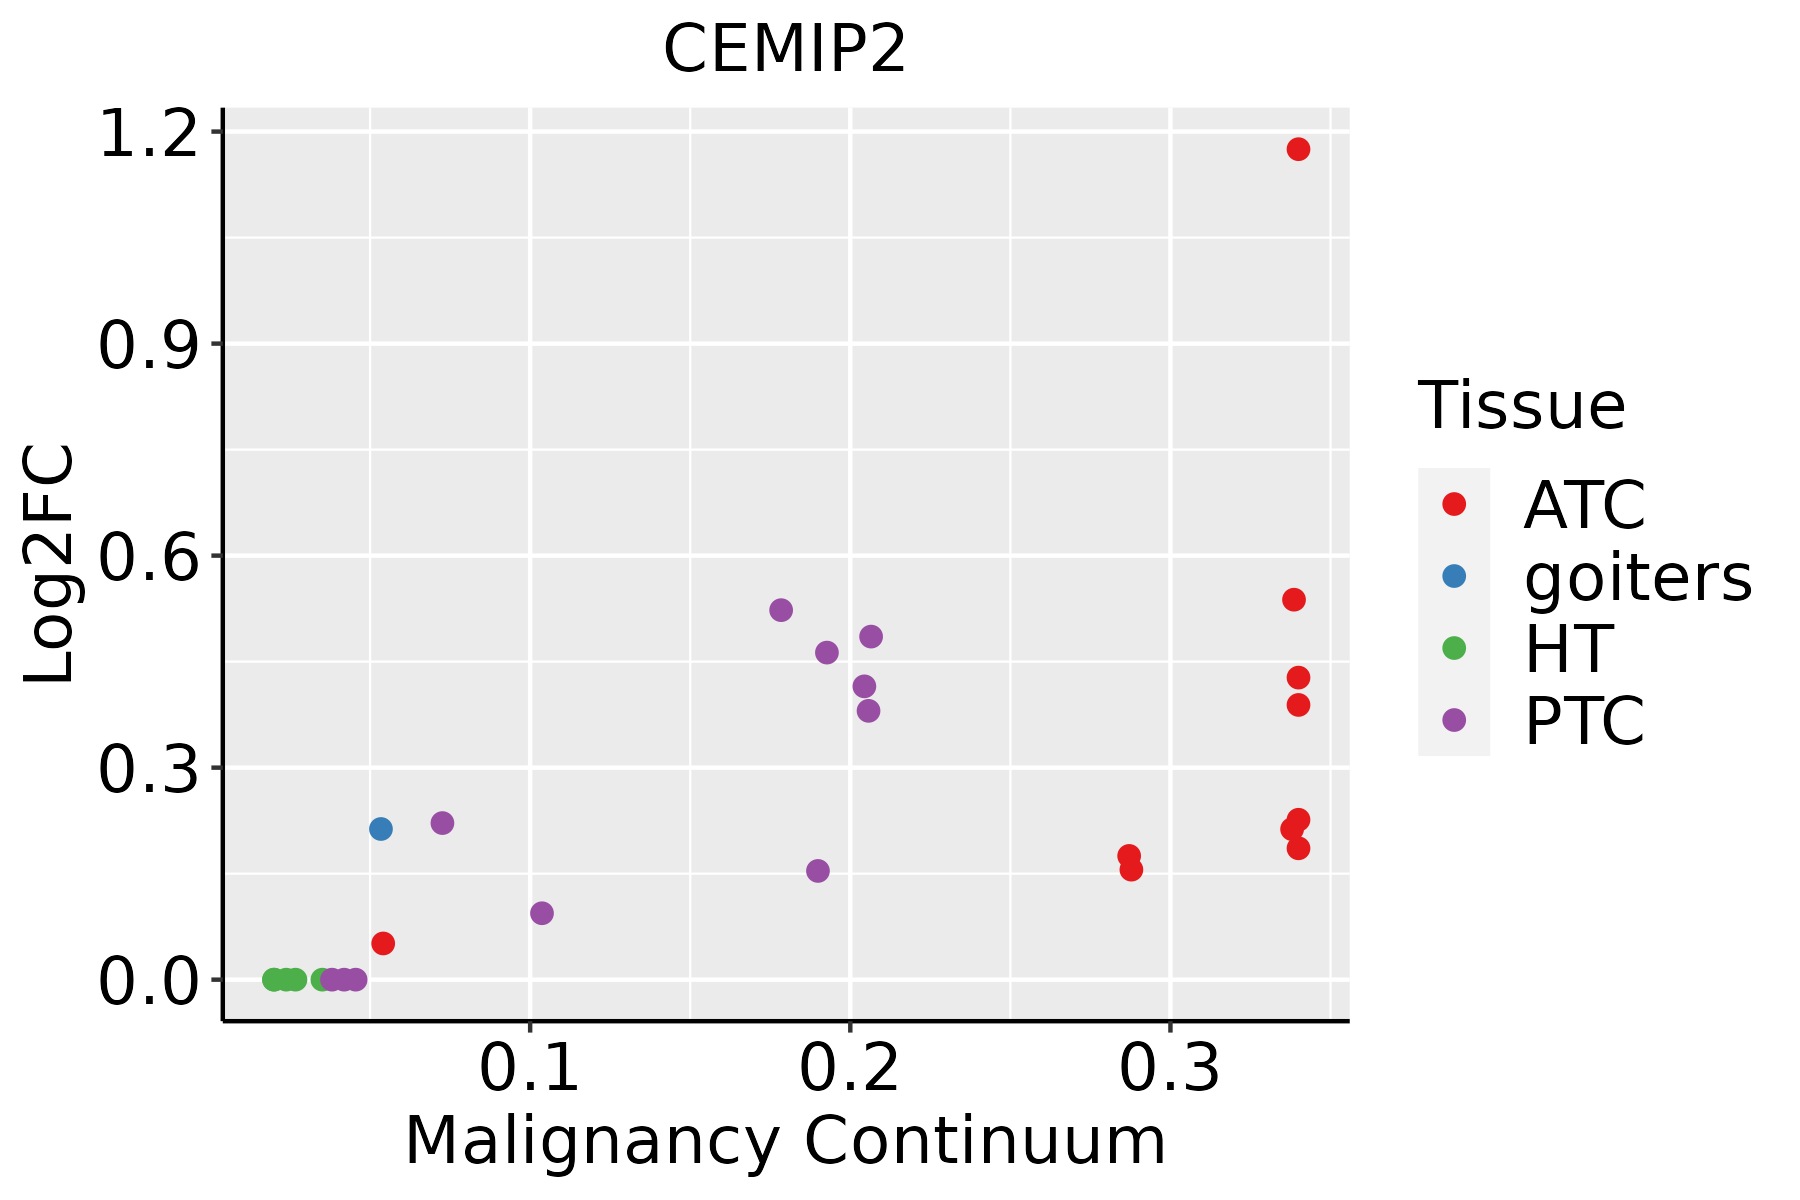 | ATC: Anaplastic thyroid cancer |
| HT: Hashimoto's thyroiditis | ||
| PTC: Papillary thyroid cancer |
| ∗log2FC in expression of this searched gene in stem-like cells from each diseased tissue sample relative to stem-like cells in normal samples in each tissue plotted against the malignancy continuum. Samples are colored based on if they are from different disease stage. |
Top |
Malignant transformation related pathway analysis |
| Find out the enriched GO biological processes and KEGG pathways involved in transition from healthy to precancer to cancer |
| Tissue | Disease Stage | Enriched GO biological Processes |
| Colorectum | AD |  |
| Colorectum | SER |  |
| Colorectum | MSS |  |
| Colorectum | MSI-H |  |
| Colorectum | FAP |  |
| ∗Top 15 enriched GO BP terms are showed in the bar plot of each disease state in each tissue. Each row represents a significant GO biological process which is colored according to the -log10(p.adjust). |
| Page: 1 2 3 4 5 6 7 8 9 |
| GO ID | Tissue | Disease Stage | Description | Gene Ratio | Bg Ratio | pvalue | p.adjust | Count |
| GO:19011362 | Esophagus | ESCC | carbohydrate derivative catabolic process | 99/8552 | 172/18723 | 1.11e-03 | 5.54e-03 | 99 |
| GO:1901136 | Liver | HCC | carbohydrate derivative catabolic process | 98/7958 | 172/18723 | 8.71e-05 | 7.62e-04 | 98 |
| GO:19013424 | Prostate | BPH | regulation of vasculature development | 78/3107 | 348/18723 | 2.76e-03 | 1.46e-02 | 78 |
| GO:00457654 | Prostate | BPH | regulation of angiogenesis | 76/3107 | 342/18723 | 3.90e-03 | 1.95e-02 | 76 |
| GO:190134212 | Prostate | Tumor | regulation of vasculature development | 79/3246 | 348/18723 | 5.84e-03 | 2.71e-02 | 79 |
| GO:004576512 | Prostate | Tumor | regulation of angiogenesis | 77/3246 | 342/18723 | 7.92e-03 | 3.52e-02 | 77 |
| GO:19013426 | Skin | SCCIS | regulation of vasculature development | 30/919 | 348/18723 | 2.05e-03 | 2.11e-02 | 30 |
| GO:00457656 | Skin | SCCIS | regulation of angiogenesis | 28/919 | 342/18723 | 5.77e-03 | 4.48e-02 | 28 |
| GO:00457657 | Thyroid | ATC | regulation of angiogenesis | 141/6293 | 342/18723 | 1.80e-03 | 8.85e-03 | 141 |
| GO:19013427 | Thyroid | ATC | regulation of vasculature development | 143/6293 | 348/18723 | 1.95e-03 | 9.44e-03 | 143 |
| GO:19011363 | Thyroid | ATC | carbohydrate derivative catabolic process | 73/6293 | 172/18723 | 9.43e-03 | 3.47e-02 | 73 |
| Page: 1 |
| Pathway ID | Tissue | Disease Stage | Description | Gene Ratio | Bg Ratio | pvalue | p.adjust | qvalue | Count |
| Page: 1 |
Top |
Cell-cell communication analysis |
| Identification of potential cell-cell interactions between two cell types and their ligand-receptor pairs for different disease states |
| Ligand | Receptor | LRpair | Pathway | Tissue | Disease Stage |
| Page: 1 |
Top |
Single-cell gene regulatory network inference analysis |
| Find out the significant the regulons (TFs) and the target genes of each regulon across cell types for different disease states |
| TF | Cell Type | Tissue | Disease Stage | Target Gene | RSS | Regulon Activity |
| ∗The dot plots of a searched regulon are shown for all cell subpopulations in each disease state of each tissue based on the regulon specific score inferred using pySCENIC and by calculating the average expression. |
| Page: 1 |
Top |
Somatic mutation of malignant transformation related genes |
| Annotation of somatic variants for genes involved in malignant transformation |
| Hugo Symbol | Variant Class | Variant Classification | dbSNP RS | HGVSc | HGVSp | HGVSp Short | SWISSPROT | BIOTYPE | SIFT | PolyPhen | Tumor Sample Barcode | Tissue | Histology | Sex | Age | Stage | Therapy Types | Drugs | Outcome |
| Page: 1 |
Top |
Related drugs of malignant transformation related genes |
| Identification of chemicals and drugs interact with genes involved in malignant transfromation |
| (DGIdb 4.0) |
| Entrez ID | Symbol | Category | Interaction Types | Drug Claim Name | Drug Name | PMIDs |
| Page: 1 |

Copyright 2023-Present -The University of Texas Health Science Center at Houston |