| Tissue | Expression Dynamics | Abbreviation |
| Cervix | 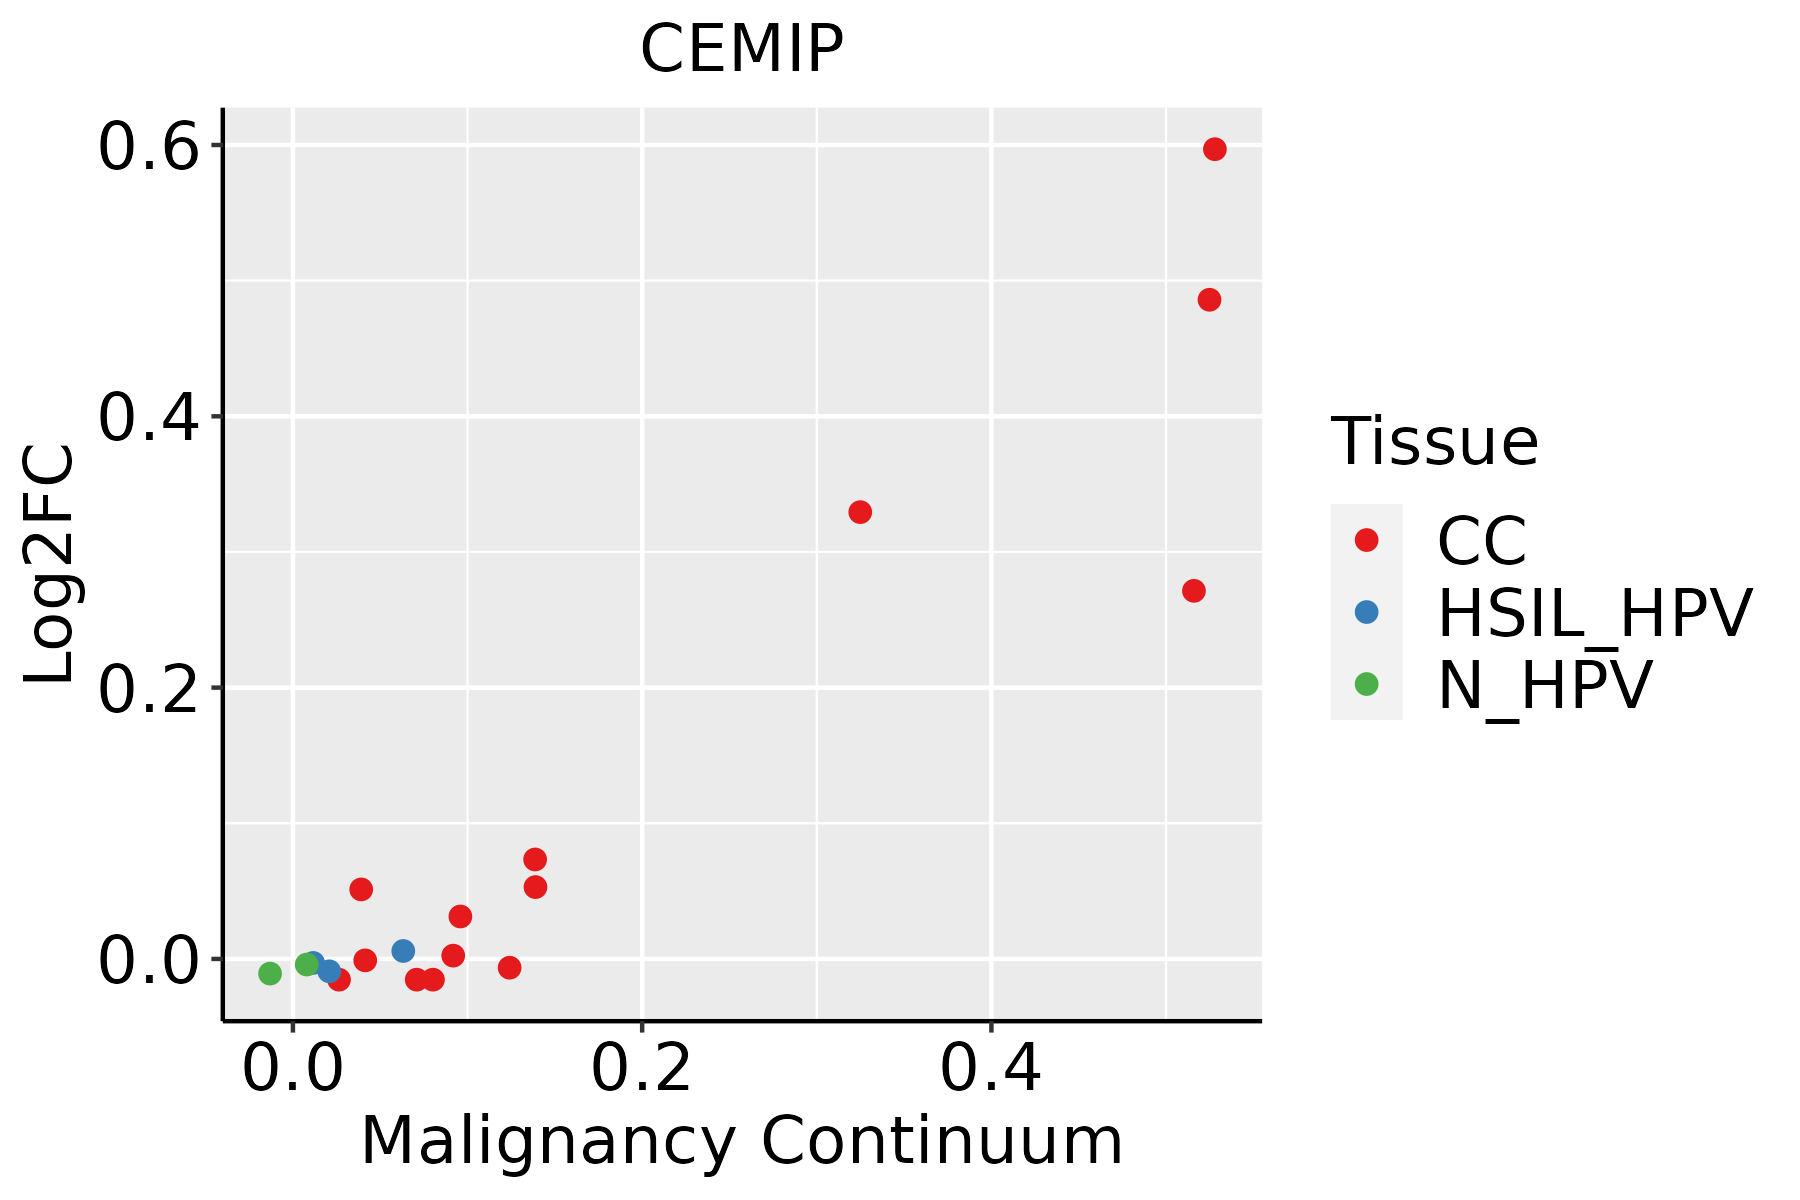 | CC: Cervix cancer |
| HSIL_HPV: HPV-infected high-grade squamous intraepithelial lesions |
| N_HPV: HPV-infected normal cervix |
| Colorectum (GSE201348) |  | FAP: Familial adenomatous polyposis |
| CRC: Colorectal cancer |
| Colorectum (HTA11) |  | AD: Adenomas |
| SER: Sessile serrated lesions |
| MSI-H: Microsatellite-high colorectal cancer |
| MSS: Microsatellite stable colorectal cancer |
| Esophagus | 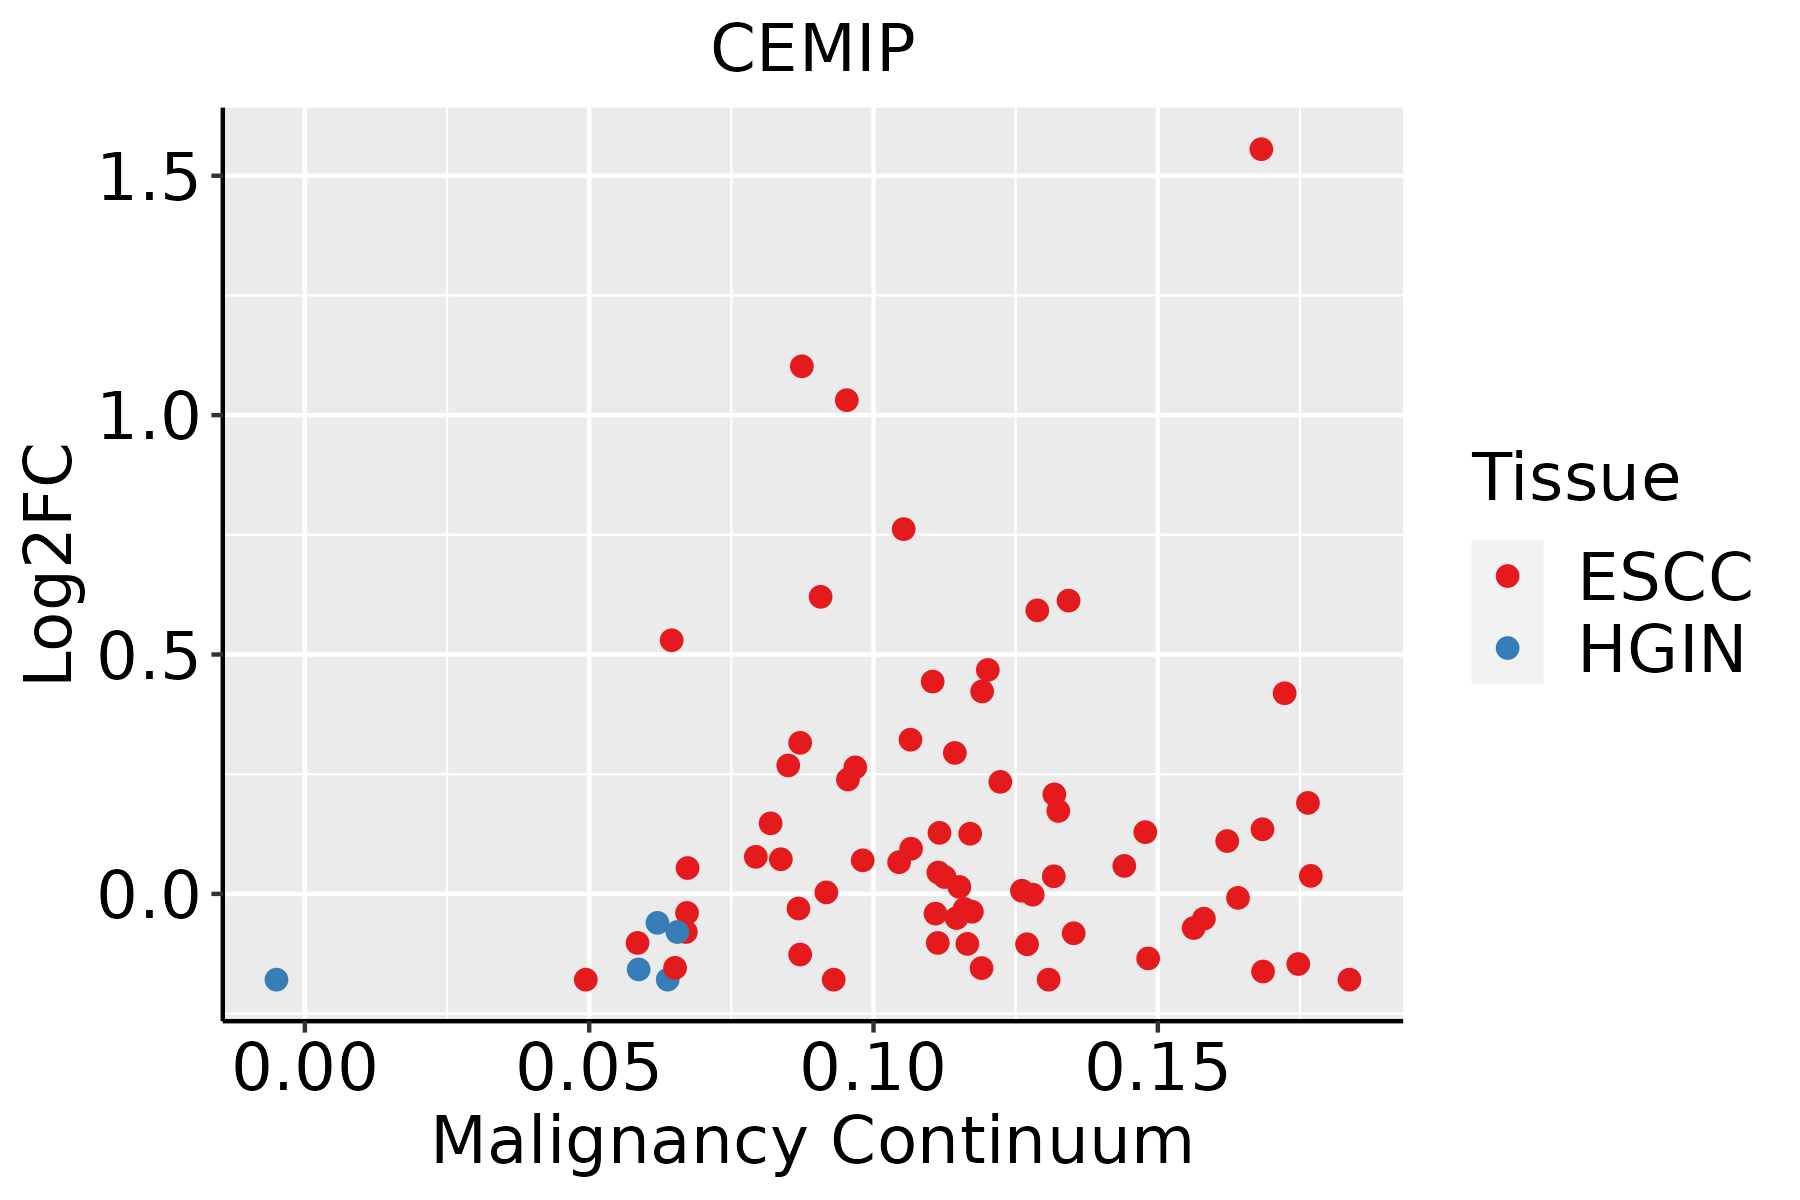 | ESCC: Esophageal squamous cell carcinoma |
| HGIN: High-grade intraepithelial neoplasias |
| LGIN: Low-grade intraepithelial neoplasias |
| Liver |  | HCC: Hepatocellular carcinoma |
| NAFLD: Non-alcoholic fatty liver disease |
| Lung |  | AAH: Atypical adenomatous hyperplasia |
| AIS: Adenocarcinoma in situ |
| IAC: Invasive lung adenocarcinoma |
| MIA: Minimally invasive adenocarcinoma |
| GO ID | Tissue | Disease Stage | Description | Gene Ratio | Bg Ratio | pvalue | p.adjust | Count |
| GO:190382910 | Cervix | CC | positive regulation of cellular protein localization | 72/2311 | 276/18723 | 3.20e-10 | 4.46e-08 | 72 |
| GO:00512359 | Cervix | CC | maintenance of location | 78/2311 | 327/18723 | 5.18e-09 | 4.92e-07 | 78 |
| GO:003367410 | Cervix | CC | positive regulation of kinase activity | 101/2311 | 467/18723 | 8.66e-09 | 7.22e-07 | 101 |
| GO:005122210 | Cervix | CC | positive regulation of protein transport | 72/2311 | 303/18723 | 2.36e-08 | 1.70e-06 | 72 |
| GO:00458608 | Cervix | CC | positive regulation of protein kinase activity | 85/2311 | 386/18723 | 5.61e-08 | 3.29e-06 | 85 |
| GO:005165110 | Cervix | CC | maintenance of location in cell | 55/2311 | 214/18723 | 6.63e-08 | 3.85e-06 | 55 |
| GO:190495110 | Cervix | CC | positive regulation of establishment of protein localization | 73/2311 | 319/18723 | 9.69e-08 | 5.25e-06 | 73 |
| GO:000660510 | Cervix | CC | protein targeting | 68/2311 | 314/18723 | 2.17e-06 | 6.55e-05 | 68 |
| GO:00719007 | Cervix | CC | regulation of protein serine/threonine kinase activity | 75/2311 | 359/18723 | 2.76e-06 | 8.02e-05 | 75 |
| GO:00903167 | Cervix | CC | positive regulation of intracellular protein transport | 41/2311 | 160/18723 | 3.24e-06 | 8.80e-05 | 41 |
| GO:00323868 | Cervix | CC | regulation of intracellular transport | 71/2311 | 337/18723 | 3.70e-06 | 9.74e-05 | 71 |
| GO:00331579 | Cervix | CC | regulation of intracellular protein transport | 52/2311 | 229/18723 | 8.16e-06 | 1.88e-04 | 52 |
| GO:00719025 | Cervix | CC | positive regulation of protein serine/threonine kinase activity | 46/2311 | 200/18723 | 1.87e-05 | 3.47e-04 | 46 |
| GO:19054778 | Cervix | CC | positive regulation of protein localization to membrane | 29/2311 | 106/18723 | 2.29e-05 | 4.01e-04 | 29 |
| GO:00323889 | Cervix | CC | positive regulation of intracellular transport | 46/2311 | 202/18723 | 2.45e-05 | 4.24e-04 | 46 |
| GO:00901509 | Cervix | CC | establishment of protein localization to membrane | 54/2311 | 260/18723 | 7.67e-05 | 1.05e-03 | 54 |
| GO:19054758 | Cervix | CC | regulation of protein localization to membrane | 36/2311 | 175/18723 | 1.33e-03 | 1.05e-02 | 36 |
| GO:00181076 | Cervix | CC | peptidyl-threonine phosphorylation | 25/2311 | 116/18723 | 3.59e-03 | 2.30e-02 | 25 |
| GO:19035334 | Cervix | CC | regulation of protein targeting | 19/2311 | 81/18723 | 3.96e-03 | 2.48e-02 | 19 |
| GO:00182106 | Cervix | CC | peptidyl-threonine modification | 26/2311 | 125/18723 | 4.98e-03 | 2.97e-02 | 26 |
| Hugo Symbol | Variant Class | Variant Classification | dbSNP RS | HGVSc | HGVSp | HGVSp Short | SWISSPROT | BIOTYPE | SIFT | PolyPhen | Tumor Sample Barcode | Tissue | Histology | Sex | Age | Stage | Therapy Types | Drugs | Outcome |
| CEMIP | SNV | Missense_Mutation | novel | c.2495A>T | p.Glu832Val | p.E832V | Q8WUJ3 | protein_coding | deleterious(0.03) | possibly_damaging(0.617) | TCGA-3C-AALJ-01 | Breast | breast invasive carcinoma | Female | <65 | I/II | Chemotherapy | doxorubicin | SD |
| CEMIP | SNV | Missense_Mutation | novel | c.1018G>T | p.Gly340Trp | p.G340W | Q8WUJ3 | protein_coding | tolerated(0.39) | benign(0.096) | TCGA-A7-A0DB-01 | Breast | breast invasive carcinoma | Female | <65 | I/II | Hormone Therapy | arimidex | SD |
| CEMIP | SNV | Missense_Mutation | | c.1352N>A | p.Ala451Glu | p.A451E | Q8WUJ3 | protein_coding | deleterious(0) | benign(0.422) | TCGA-A8-A08B-01 | Breast | breast invasive carcinoma | Female | <65 | I/II | Chemotherapy | 5-fluorouracil | CR |
| CEMIP | SNV | Missense_Mutation | | c.2273N>T | p.Ser758Leu | p.S758L | Q8WUJ3 | protein_coding | deleterious(0.03) | benign(0.086) | TCGA-D8-A27G-01 | Breast | breast invasive carcinoma | Female | >=65 | I/II | Unknown | Unknown | SD |
| CEMIP | SNV | Missense_Mutation | | c.2552N>G | p.Asp851Gly | p.D851G | Q8WUJ3 | protein_coding | tolerated(0.56) | possibly_damaging(0.73) | TCGA-E2-A1B0-01 | Breast | breast invasive carcinoma | Female | <65 | III/IV | Chemotherapy | cytoxan | SD |
| CEMIP | deletion | Frame_Shift_Del | rs779771025 | c.801delN | p.Pro268LeufsTer5 | p.P268Lfs*5 | Q8WUJ3 | protein_coding | | | TCGA-A2-A0T5-01 | Breast | breast invasive carcinoma | Female | <65 | I/II | Unspecific | Taxotere | SD |
| CEMIP | insertion | Nonsense_Mutation | novel | c.756_757insGATTCTAAGATGCATTATCATAAGAATCATTAACAGGTCAAT | p.Met252_Thr253insAspSerLysMetHisTyrHisLysAsnHisTerGlnValAsn | p.M252_T253insDSKMHYHKNH*QVN | Q8WUJ3 | protein_coding | | | TCGA-A8-A08H-01 | Breast | breast invasive carcinoma | Female | >=65 | I/II | Unknown | Unknown | SD |
| CEMIP | insertion | Frame_Shift_Ins | novel | c.304_305insCTCCTCTCTTCCATGGGAATGGTCCTGGCAGCCTTCC | p.Asp102AlafsTer40 | p.D102Afs*40 | Q8WUJ3 | protein_coding | | | TCGA-AN-A0FK-01 | Breast | breast invasive carcinoma | Female | >=65 | III/IV | Unknown | Unknown | SD |
| CEMIP | insertion | Frame_Shift_Ins | novel | c.2325_2326insTCTACTT | p.Arg776SerfsTer37 | p.R776Sfs*37 | Q8WUJ3 | protein_coding | | | TCGA-BH-A0EE-01 | Breast | breast invasive carcinoma | Female | >=65 | I/II | Chemotherapy | docetaxel | SD |
| CEMIP | deletion | Frame_Shift_Del | novel | c.3580delN | p.Pro1194ArgfsTer11 | p.P1194Rfs*11 | Q8WUJ3 | protein_coding | | | TCGA-EW-A2FV-01 | Breast | breast invasive carcinoma | Female | <65 | III/IV | Chemotherapy | docetaxel | SD |


