
|
|||||
|
 | |
| |
| |
| |
| |
| |
|
Gene: CELSR2 |
Gene summary for CELSR2 |
| Gene information | Species | Human | Gene symbol | CELSR2 | Gene ID | 1952 |
| Gene name | cadherin EGF LAG seven-pass G-type receptor 2 | |
| Gene Alias | ADGRC2 | |
| Cytomap | 1p13.3 | |
| Gene Type | protein-coding | GO ID | GO:0000902 | UniProtAcc | Q9HCU4 |
Top |
Malignant transformation analysis |
| Identification of the aberrant gene expression in precancerous and cancerous lesions by comparing the gene expression of stem-like cells in diseased tissues with normal stem cells |
| Entrez ID | Symbol | Replicates | Species | Organ | Tissue | Adj P-value | Log2FC | Malignancy |
| 1952 | CELSR2 | LZE2T | Human | Esophagus | ESCC | 2.58e-02 | 3.32e-01 | 0.082 |
| 1952 | CELSR2 | LZE20T | Human | Esophagus | ESCC | 1.21e-02 | 1.46e-01 | 0.0662 |
| 1952 | CELSR2 | LZE24T | Human | Esophagus | ESCC | 3.25e-04 | 2.30e-02 | 0.0596 |
| 1952 | CELSR2 | P1T-E | Human | Esophagus | ESCC | 1.73e-11 | 2.99e-01 | 0.0875 |
| 1952 | CELSR2 | P2T-E | Human | Esophagus | ESCC | 2.72e-28 | 4.23e-01 | 0.1177 |
| 1952 | CELSR2 | P4T-E | Human | Esophagus | ESCC | 8.86e-05 | 1.13e-01 | 0.1323 |
| 1952 | CELSR2 | P5T-E | Human | Esophagus | ESCC | 3.48e-08 | 1.39e-01 | 0.1327 |
| 1952 | CELSR2 | P8T-E | Human | Esophagus | ESCC | 7.94e-14 | 1.96e-01 | 0.0889 |
| 1952 | CELSR2 | P9T-E | Human | Esophagus | ESCC | 1.28e-03 | 3.85e-02 | 0.1131 |
| 1952 | CELSR2 | P10T-E | Human | Esophagus | ESCC | 1.77e-23 | 4.82e-01 | 0.116 |
| 1952 | CELSR2 | P11T-E | Human | Esophagus | ESCC | 2.02e-04 | 1.83e-01 | 0.1426 |
| 1952 | CELSR2 | P12T-E | Human | Esophagus | ESCC | 1.51e-30 | 5.87e-01 | 0.1122 |
| 1952 | CELSR2 | P15T-E | Human | Esophagus | ESCC | 1.75e-06 | 5.71e-02 | 0.1149 |
| 1952 | CELSR2 | P16T-E | Human | Esophagus | ESCC | 5.38e-20 | 1.41e-01 | 0.1153 |
| 1952 | CELSR2 | P17T-E | Human | Esophagus | ESCC | 1.17e-06 | 2.46e-01 | 0.1278 |
| 1952 | CELSR2 | P20T-E | Human | Esophagus | ESCC | 2.57e-06 | 1.01e-01 | 0.1124 |
| 1952 | CELSR2 | P21T-E | Human | Esophagus | ESCC | 1.14e-05 | 6.54e-02 | 0.1617 |
| 1952 | CELSR2 | P22T-E | Human | Esophagus | ESCC | 4.58e-12 | 9.43e-02 | 0.1236 |
| 1952 | CELSR2 | P23T-E | Human | Esophagus | ESCC | 1.23e-12 | 1.73e-01 | 0.108 |
| 1952 | CELSR2 | P24T-E | Human | Esophagus | ESCC | 1.48e-04 | 6.61e-02 | 0.1287 |
| Page: 1 2 3 4 |
| Tissue | Expression Dynamics | Abbreviation |
| Esophagus | 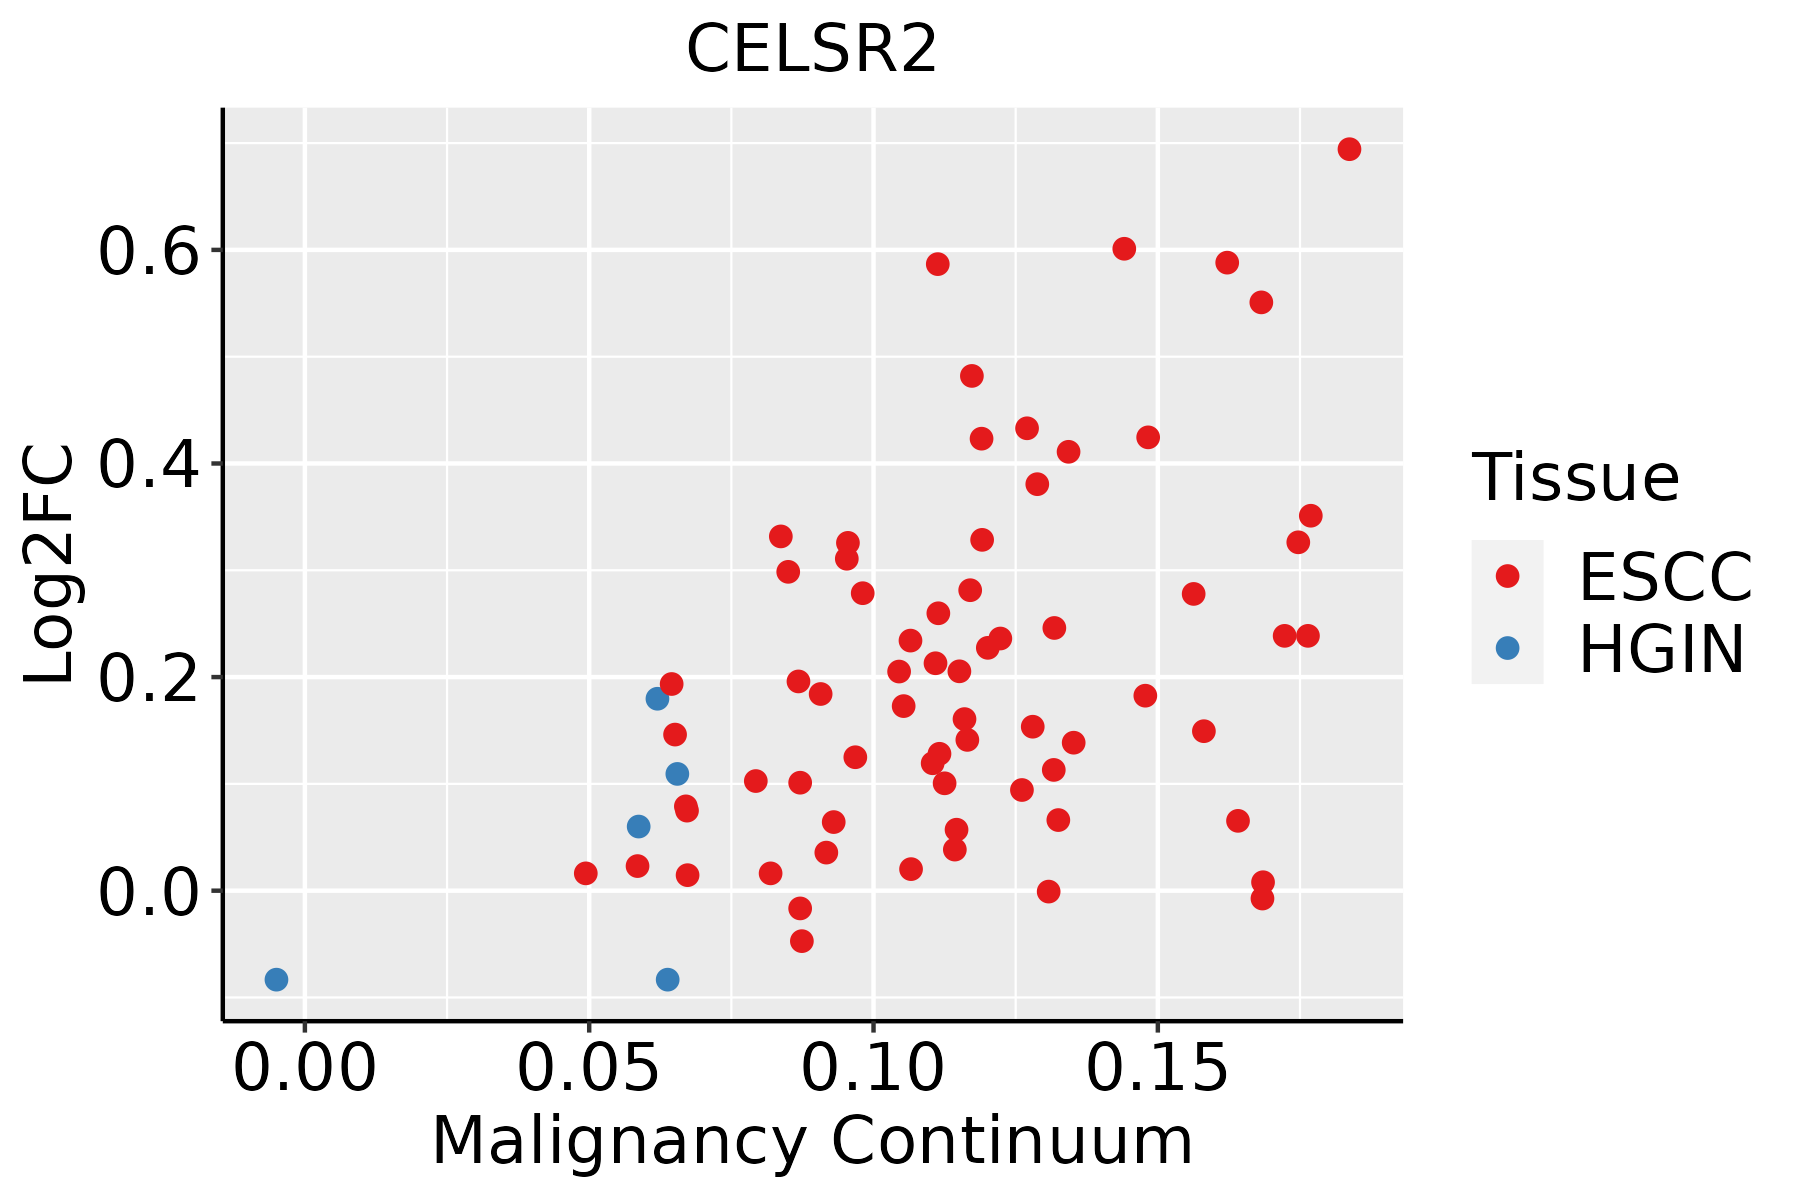 | ESCC: Esophageal squamous cell carcinoma |
| HGIN: High-grade intraepithelial neoplasias | ||
| LGIN: Low-grade intraepithelial neoplasias | ||
| Oral Cavity | 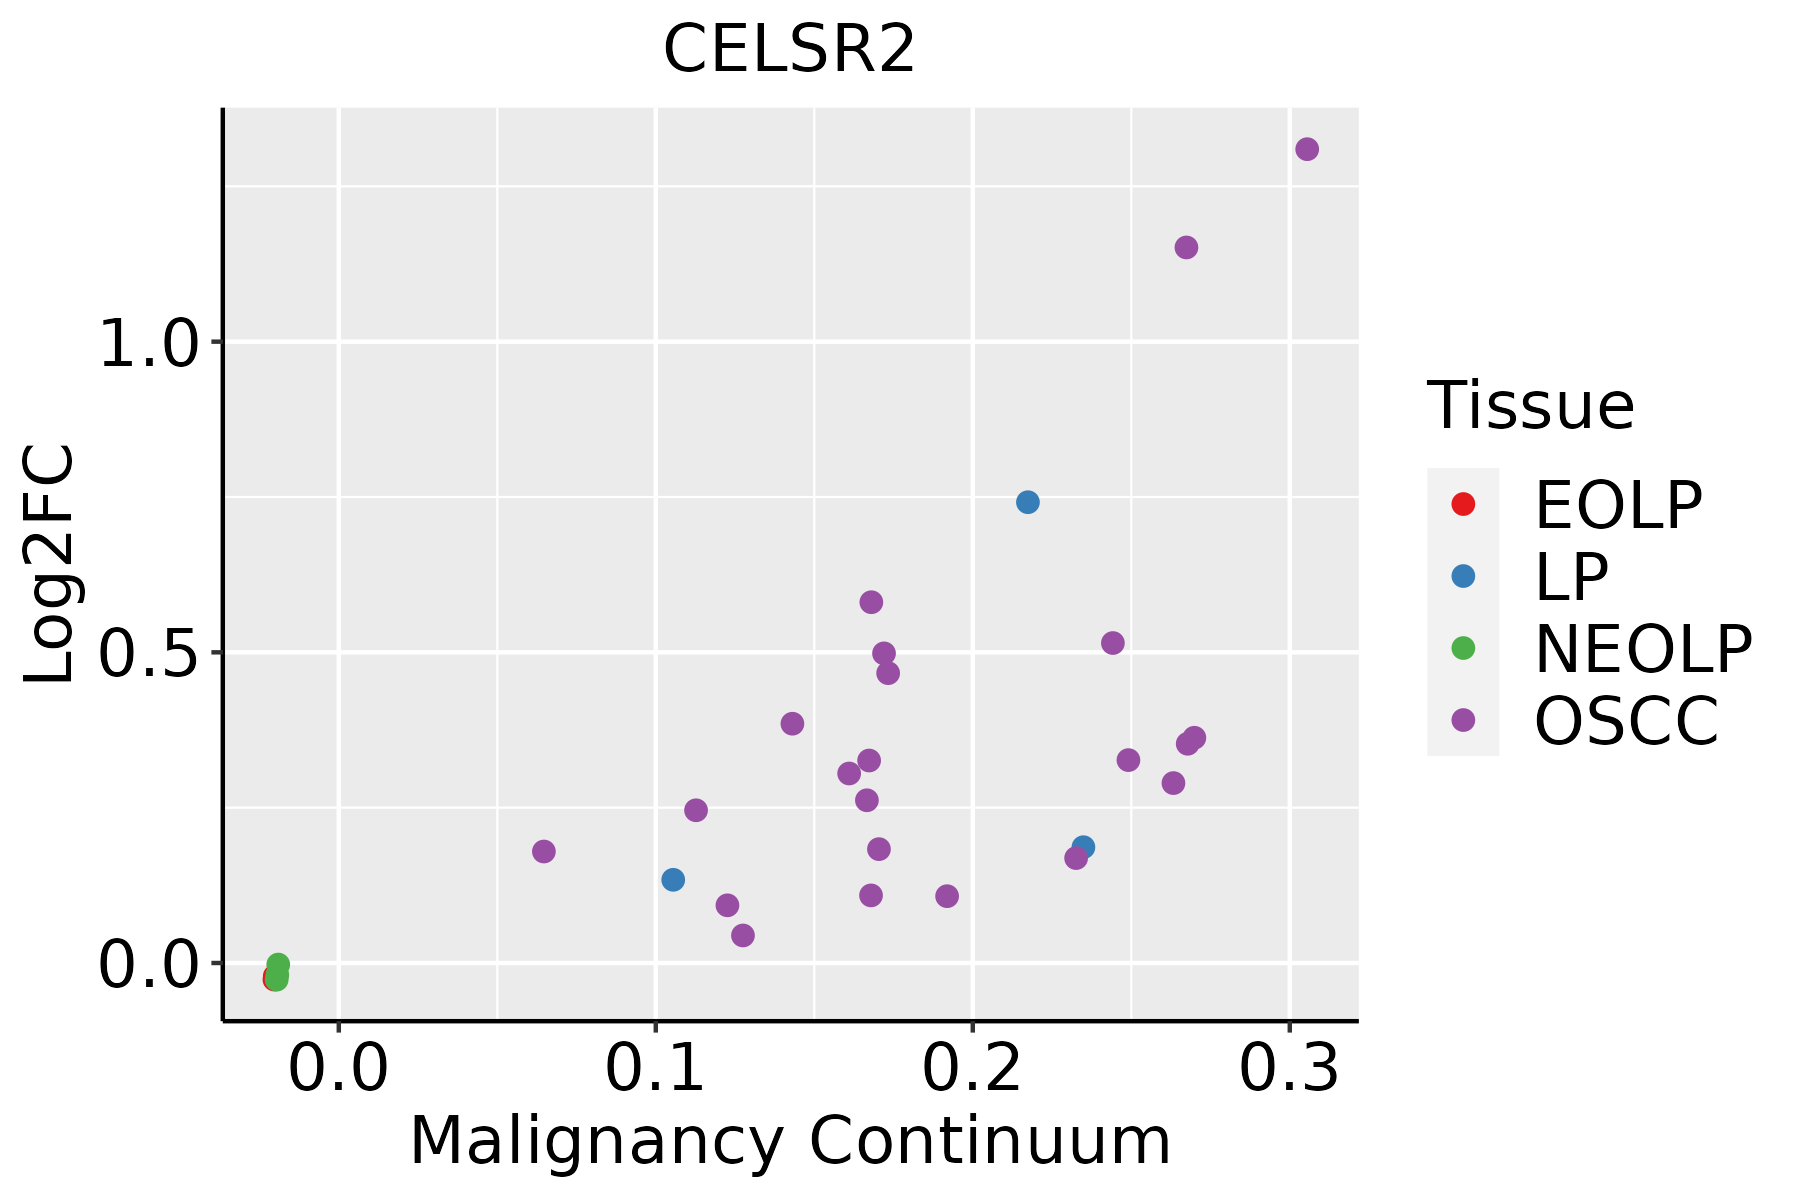 | EOLP: Erosive Oral lichen planus |
| LP: leukoplakia | ||
| NEOLP: Non-erosive oral lichen planus | ||
| OSCC: Oral squamous cell carcinoma | ||
| Thyroid | 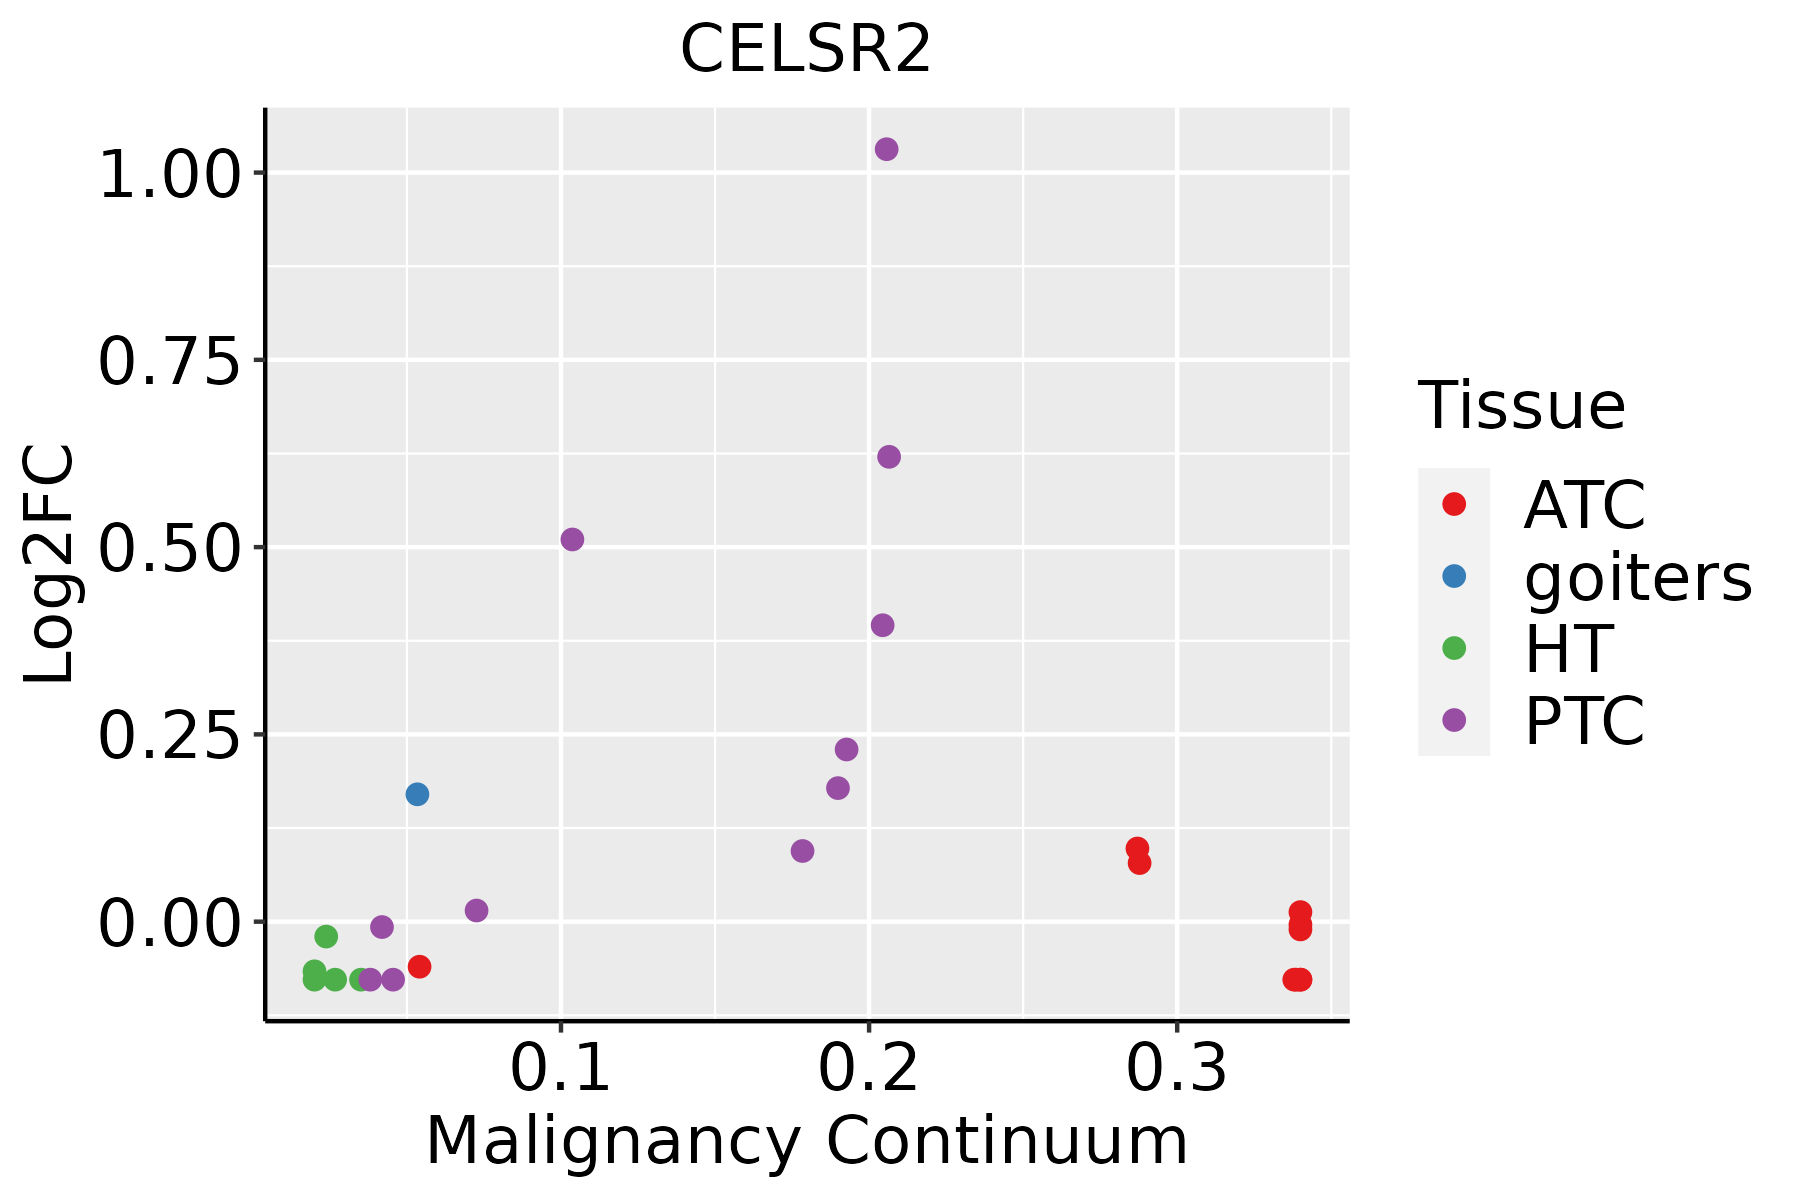 | ATC: Anaplastic thyroid cancer |
| HT: Hashimoto's thyroiditis | ||
| PTC: Papillary thyroid cancer |
| ∗log2FC in expression of this searched gene in stem-like cells from each diseased tissue sample relative to stem-like cells in normal samples in each tissue plotted against the malignancy continuum. Samples are colored based on if they are from different disease stage. |
Top |
Malignant transformation related pathway analysis |
| Find out the enriched GO biological processes and KEGG pathways involved in transition from healthy to precancer to cancer |
| Tissue | Disease Stage | Enriched GO biological Processes |
| Colorectum | AD |  |
| Colorectum | SER |  |
| Colorectum | MSS |  |
| Colorectum | MSI-H |  |
| Colorectum | FAP |  |
| ∗Top 15 enriched GO BP terms are showed in the bar plot of each disease state in each tissue. Each row represents a significant GO biological process which is colored according to the -log10(p.adjust). |
| Page: 1 2 3 4 5 6 7 8 9 |
| GO ID | Tissue | Disease Stage | Description | Gene Ratio | Bg Ratio | pvalue | p.adjust | Count |
| GO:001605517 | Esophagus | ESCC | Wnt signaling pathway | 268/8552 | 444/18723 | 2.32e-10 | 6.58e-09 | 268 |
| GO:019873817 | Esophagus | ESCC | cell-cell signaling by wnt | 269/8552 | 446/18723 | 2.41e-10 | 6.79e-09 | 269 |
| GO:00017387 | Esophagus | ESCC | morphogenesis of a polarized epithelium | 63/8552 | 94/18723 | 2.34e-05 | 2.00e-04 | 63 |
| GO:00600714 | Esophagus | ESCC | Wnt signaling pathway, planar cell polarity pathway | 36/8552 | 52/18723 | 5.05e-04 | 2.79e-03 | 36 |
| GO:002240720 | Esophagus | ESCC | regulation of cell-cell adhesion | 239/8552 | 448/18723 | 5.88e-04 | 3.19e-03 | 239 |
| GO:00901753 | Esophagus | ESCC | regulation of establishment of planar polarity | 37/8552 | 56/18723 | 1.65e-03 | 7.65e-03 | 37 |
| GO:00017361 | Esophagus | ESCC | establishment of planar polarity | 45/8552 | 72/18723 | 2.97e-03 | 1.24e-02 | 45 |
| GO:00071641 | Esophagus | ESCC | establishment of tissue polarity | 45/8552 | 72/18723 | 2.97e-03 | 1.24e-02 | 45 |
| GO:00355671 | Esophagus | ESCC | non-canonical Wnt signaling pathway | 45/8552 | 72/18723 | 2.97e-03 | 1.24e-02 | 45 |
| GO:20000274 | Esophagus | ESCC | regulation of animal organ morphogenesis | 71/8552 | 125/18723 | 7.97e-03 | 2.84e-02 | 71 |
| GO:001635816 | Esophagus | ESCC | dendrite development | 130/8552 | 243/18723 | 8.33e-03 | 2.95e-02 | 130 |
| GO:001605510 | Oral cavity | OSCC | Wnt signaling pathway | 227/7305 | 444/18723 | 1.10e-07 | 1.87e-06 | 227 |
| GO:019873810 | Oral cavity | OSCC | cell-cell signaling by wnt | 227/7305 | 446/18723 | 1.75e-07 | 2.86e-06 | 227 |
| GO:002240718 | Oral cavity | OSCC | regulation of cell-cell adhesion | 218/7305 | 448/18723 | 1.71e-05 | 1.68e-04 | 218 |
| GO:005087819 | Oral cavity | OSCC | regulation of body fluid levels | 179/7305 | 379/18723 | 6.19e-04 | 3.50e-03 | 179 |
| GO:0021591 | Oral cavity | OSCC | ventricular system development | 18/7305 | 29/18723 | 1.00e-02 | 3.49e-02 | 18 |
| GO:001635810 | Oral cavity | OSCC | dendrite development | 113/7305 | 243/18723 | 1.00e-02 | 3.49e-02 | 113 |
| GO:001605515 | Oral cavity | LP | Wnt signaling pathway | 140/4623 | 444/18723 | 5.80e-04 | 5.35e-03 | 140 |
| GO:019873815 | Oral cavity | LP | cell-cell signaling by wnt | 140/4623 | 446/18723 | 7.12e-04 | 6.38e-03 | 140 |
| GO:0016055110 | Thyroid | PTC | Wnt signaling pathway | 217/5968 | 444/18723 | 3.71e-14 | 2.30e-12 | 217 |
| Page: 1 2 |
| Pathway ID | Tissue | Disease Stage | Description | Gene Ratio | Bg Ratio | pvalue | p.adjust | qvalue | Count |
| Page: 1 |
Top |
Cell-cell communication analysis |
| Identification of potential cell-cell interactions between two cell types and their ligand-receptor pairs for different disease states |
| Ligand | Receptor | LRpair | Pathway | Tissue | Disease Stage |
| Page: 1 |
Top |
Single-cell gene regulatory network inference analysis |
| Find out the significant the regulons (TFs) and the target genes of each regulon across cell types for different disease states |
| TF | Cell Type | Tissue | Disease Stage | Target Gene | RSS | Regulon Activity |
| ∗The dot plots of a searched regulon are shown for all cell subpopulations in each disease state of each tissue based on the regulon specific score inferred using pySCENIC and by calculating the average expression. |
| Page: 1 |
Top |
Somatic mutation of malignant transformation related genes |
| Annotation of somatic variants for genes involved in malignant transformation |
| Hugo Symbol | Variant Class | Variant Classification | dbSNP RS | HGVSc | HGVSp | HGVSp Short | SWISSPROT | BIOTYPE | SIFT | PolyPhen | Tumor Sample Barcode | Tissue | Histology | Sex | Age | Stage | Therapy Types | Drugs | Outcome |
| CELSR2 | SNV | Missense_Mutation | novel | c.8248G>A | p.Glu2750Lys | p.E2750K | Q9HCU4 | protein_coding | tolerated_low_confidence(0.17) | benign(0) | TCGA-A2-A0T0-01 | Breast | breast invasive carcinoma | Female | <65 | I/II | Chemotherapy | taxotere | SD |
| CELSR2 | SNV | Missense_Mutation | c.1400N>T | p.Thr467Ile | p.T467I | Q9HCU4 | protein_coding | tolerated(0.2) | benign(0.003) | TCGA-A2-A0YJ-01 | Breast | breast invasive carcinoma | Female | <65 | III/IV | Chemotherapy | cytoxan | PD | |
| CELSR2 | SNV | Missense_Mutation | c.4428G>C | p.Glu1476Asp | p.E1476D | Q9HCU4 | protein_coding | tolerated(0.69) | benign(0.012) | TCGA-AC-A23H-01 | Breast | breast invasive carcinoma | Female | >=65 | I/II | Unknown | Unknown | PD | |
| CELSR2 | SNV | Missense_Mutation | novel | c.5233N>T | p.Gly1745Cys | p.G1745C | Q9HCU4 | protein_coding | deleterious(0) | probably_damaging(1) | TCGA-BH-A0BF-01 | Breast | breast invasive carcinoma | Female | <65 | I/II | Unknown | Unknown | SD |
| CELSR2 | SNV | Missense_Mutation | c.4276N>T | p.Val1426Phe | p.V1426F | Q9HCU4 | protein_coding | deleterious(0) | possibly_damaging(0.903) | TCGA-D8-A147-01 | Breast | breast invasive carcinoma | Female | <65 | I/II | Chemotherapy | doxorubicine | SD | |
| CELSR2 | SNV | Missense_Mutation | c.2203A>G | p.Ser735Gly | p.S735G | Q9HCU4 | protein_coding | deleterious(0.03) | probably_damaging(0.955) | TCGA-D8-A1XQ-01 | Breast | breast invasive carcinoma | Female | >=65 | I/II | Unknown | Unknown | SD | |
| CELSR2 | SNV | Missense_Mutation | rs774715293 | c.511N>T | p.Arg171Trp | p.R171W | Q9HCU4 | protein_coding | tolerated(0.19) | benign(0.001) | TCGA-E2-A1IN-01 | Breast | breast invasive carcinoma | Female | <65 | I/II | Hormone Therapy | arimidex | SD |
| CELSR2 | SNV | Missense_Mutation | c.7660N>C | p.Glu2554Gln | p.E2554Q | Q9HCU4 | protein_coding | tolerated(0.07) | probably_damaging(0.984) | TCGA-EW-A1J5-01 | Breast | breast invasive carcinoma | Female | <65 | I/II | Chemotherapy | adriamycin | SD | |
| CELSR2 | SNV | Missense_Mutation | c.7984N>C | p.Ser2662Pro | p.S2662P | Q9HCU4 | protein_coding | deleterious(0.01) | probably_damaging(0.998) | TCGA-EW-A1P5-01 | Breast | breast invasive carcinoma | Female | >=65 | I/II | Hormone Therapy | anastrozole | SD | |
| CELSR2 | SNV | Missense_Mutation | novel | c.2020G>C | p.Asp674His | p.D674H | Q9HCU4 | protein_coding | deleterious(0) | probably_damaging(1) | TCGA-PE-A5DE-01 | Breast | breast invasive carcinoma | Female | <65 | I/II | Chemotherapy | taxotere | CR |
| Page: 1 2 3 4 5 6 7 8 9 10 11 12 13 14 15 16 17 18 19 20 21 22 23 24 25 26 27 28 |
Top |
Related drugs of malignant transformation related genes |
| Identification of chemicals and drugs interact with genes involved in malignant transfromation |
| (DGIdb 4.0) |
| Entrez ID | Symbol | Category | Interaction Types | Drug Claim Name | Drug Name | PMIDs |
| 1952 | CELSR2 | G PROTEIN COUPLED RECEPTOR, DRUGGABLE GENOME | hmg coa reductase inhibitors | 25350695 |
| Page: 1 |

Copyright 2023-Present -The University of Texas Health Science Center at Houston |