| Tissue | Expression Dynamics | Abbreviation |
| Breast |  | IDC: Invasive ductal carcinoma |
| DCIS: Ductal carcinoma in situ |
| Precancer(BRCA1-mut): Precancerous lesion from BRCA1 mutation carriers |
| Cervix | 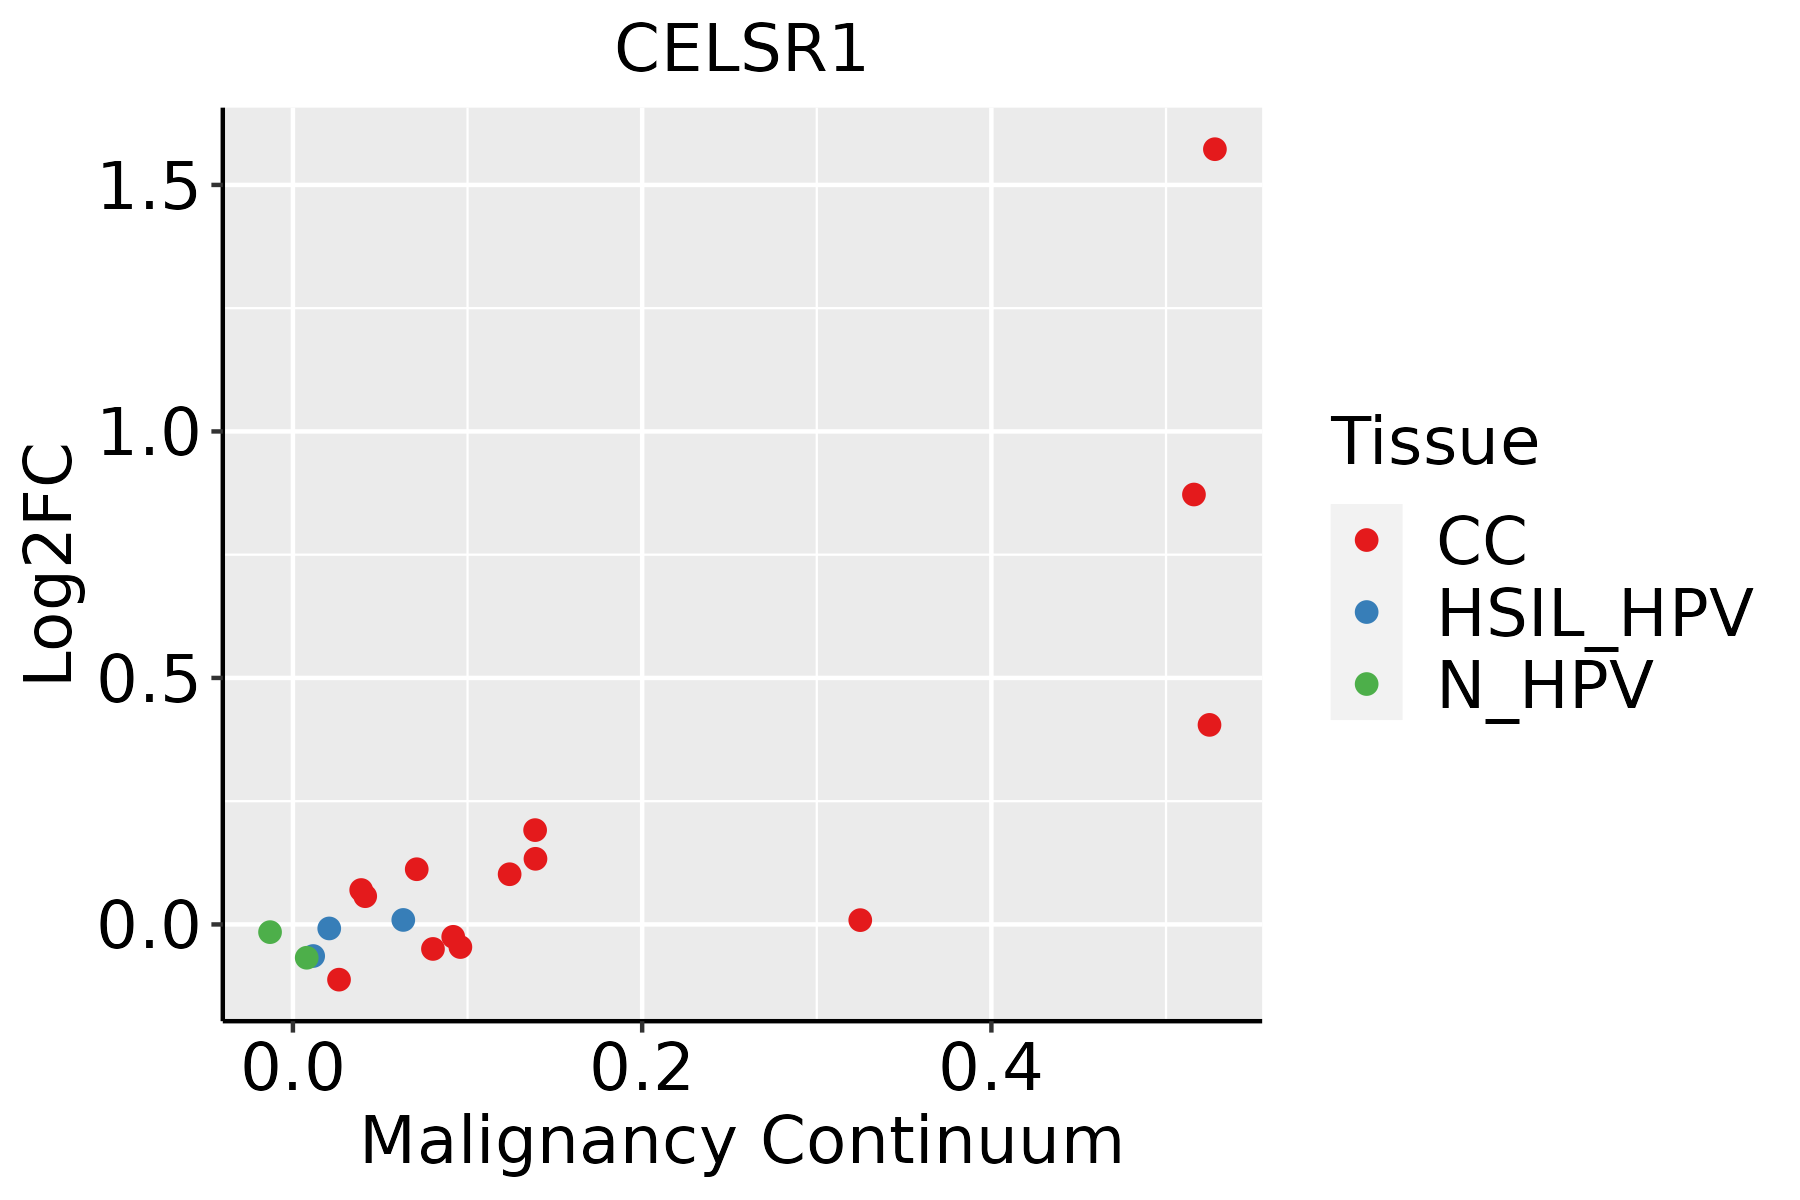 | CC: Cervix cancer |
| HSIL_HPV: HPV-infected high-grade squamous intraepithelial lesions |
| N_HPV: HPV-infected normal cervix |
| Endometrium | 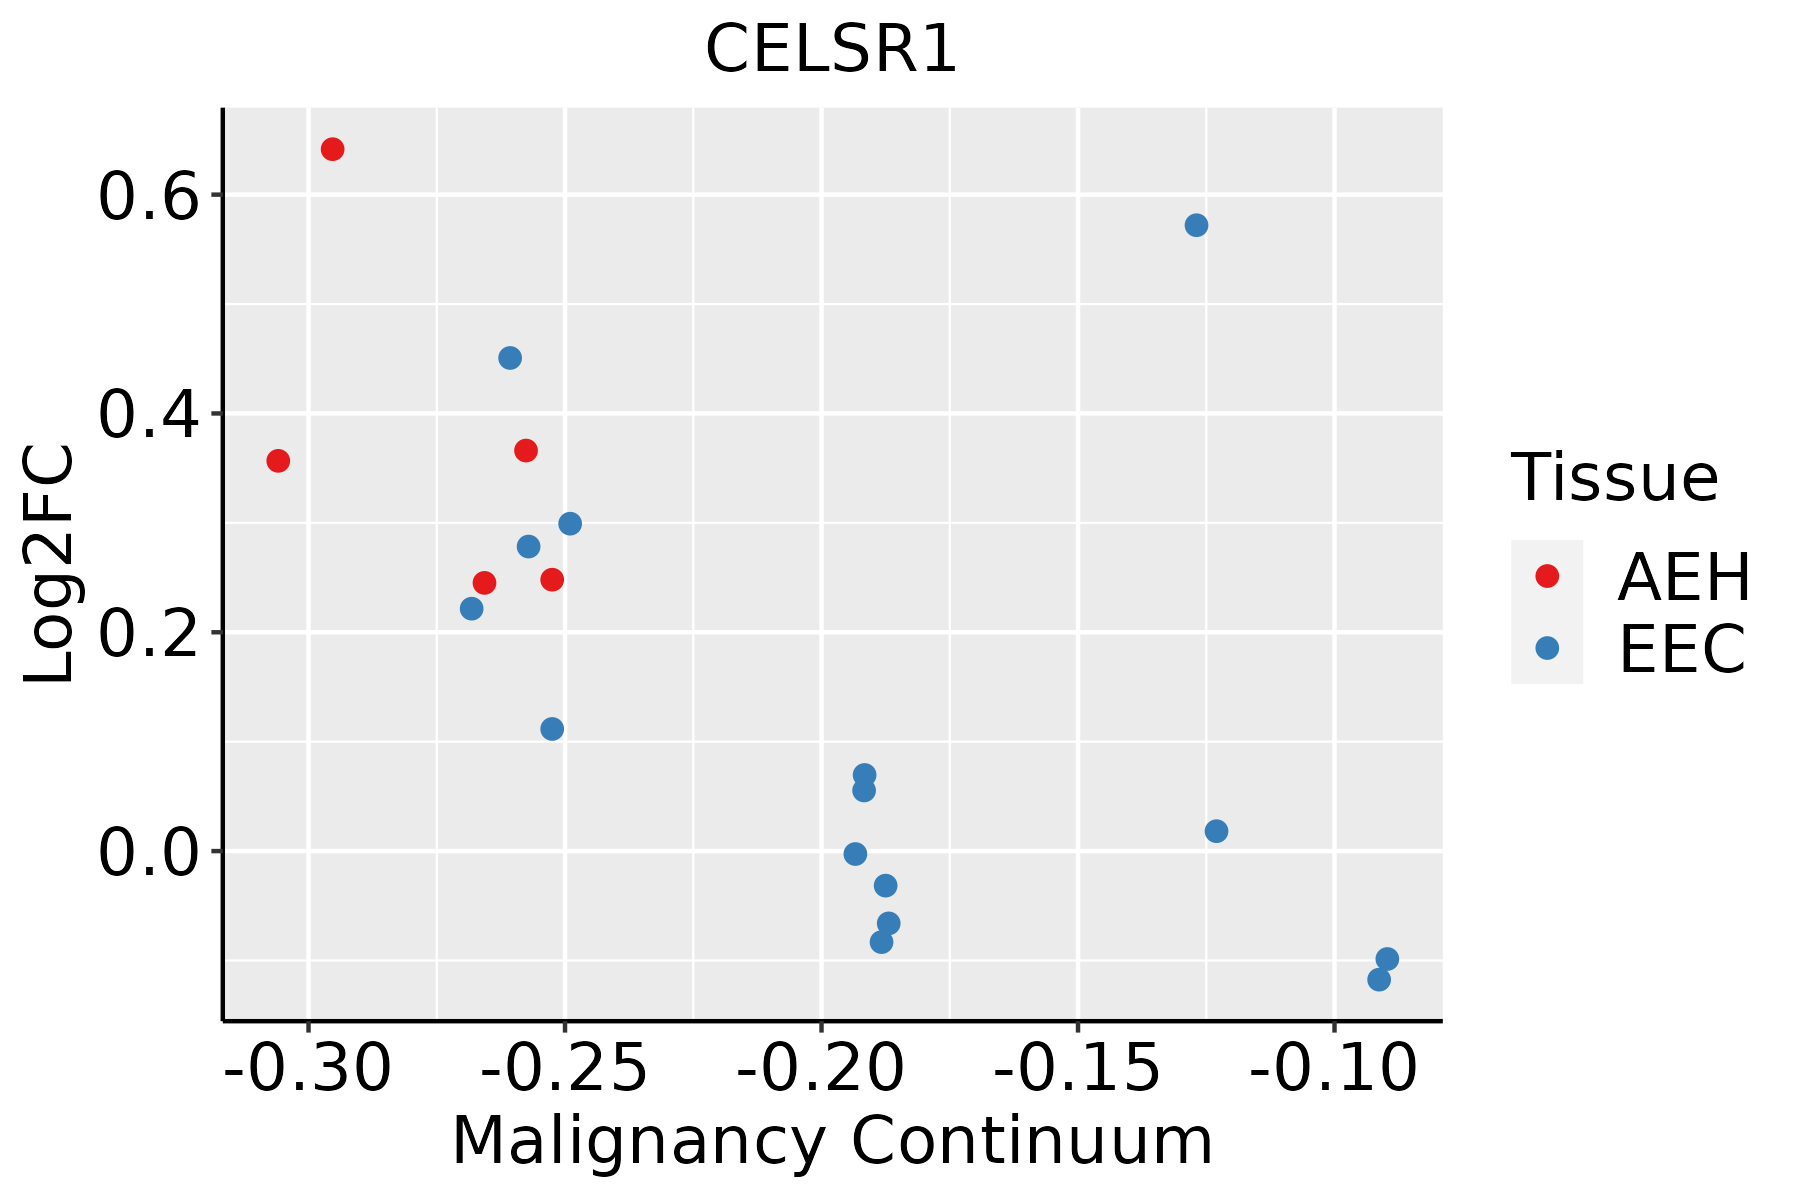 | AEH: Atypical endometrial hyperplasia |
| EEC: Endometrioid Cancer |
| Esophagus | 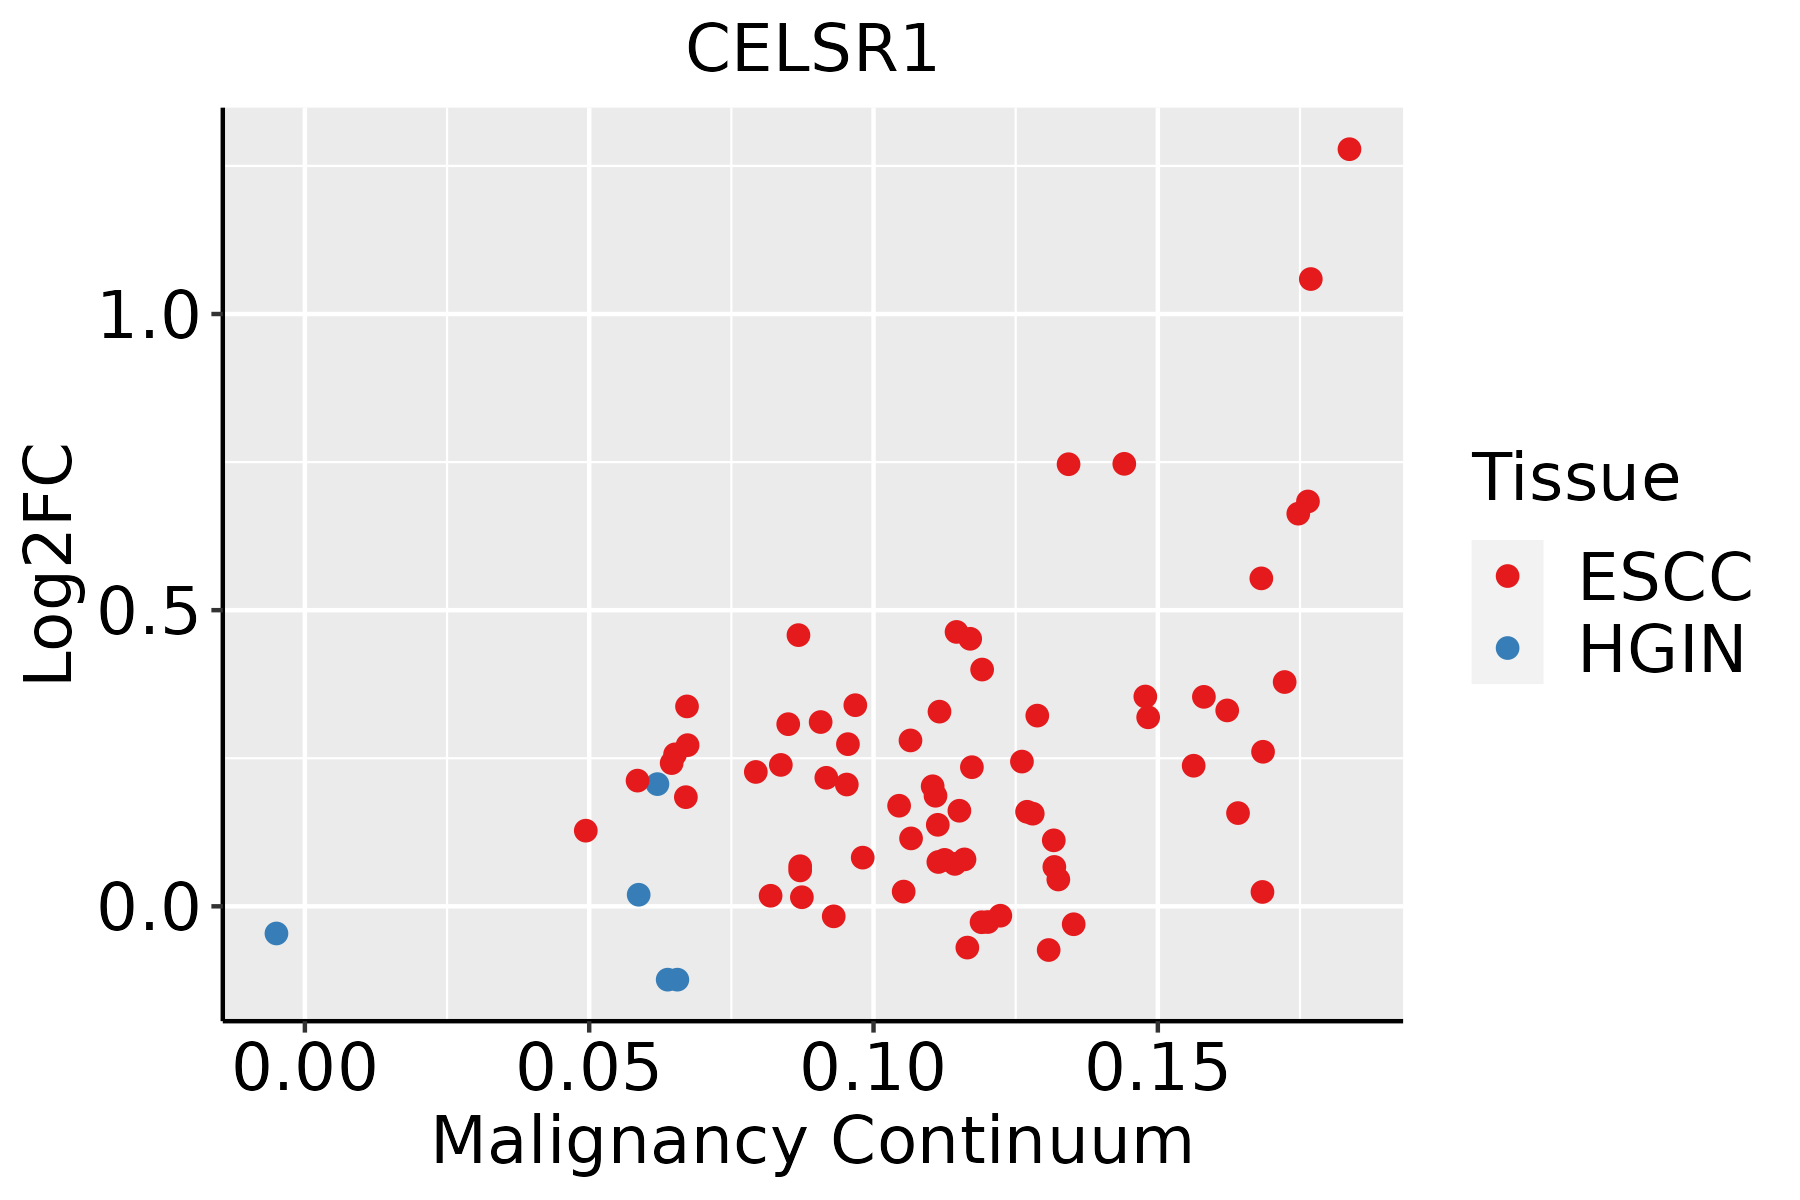 | ESCC: Esophageal squamous cell carcinoma |
| HGIN: High-grade intraepithelial neoplasias |
| LGIN: Low-grade intraepithelial neoplasias |
| Lung | 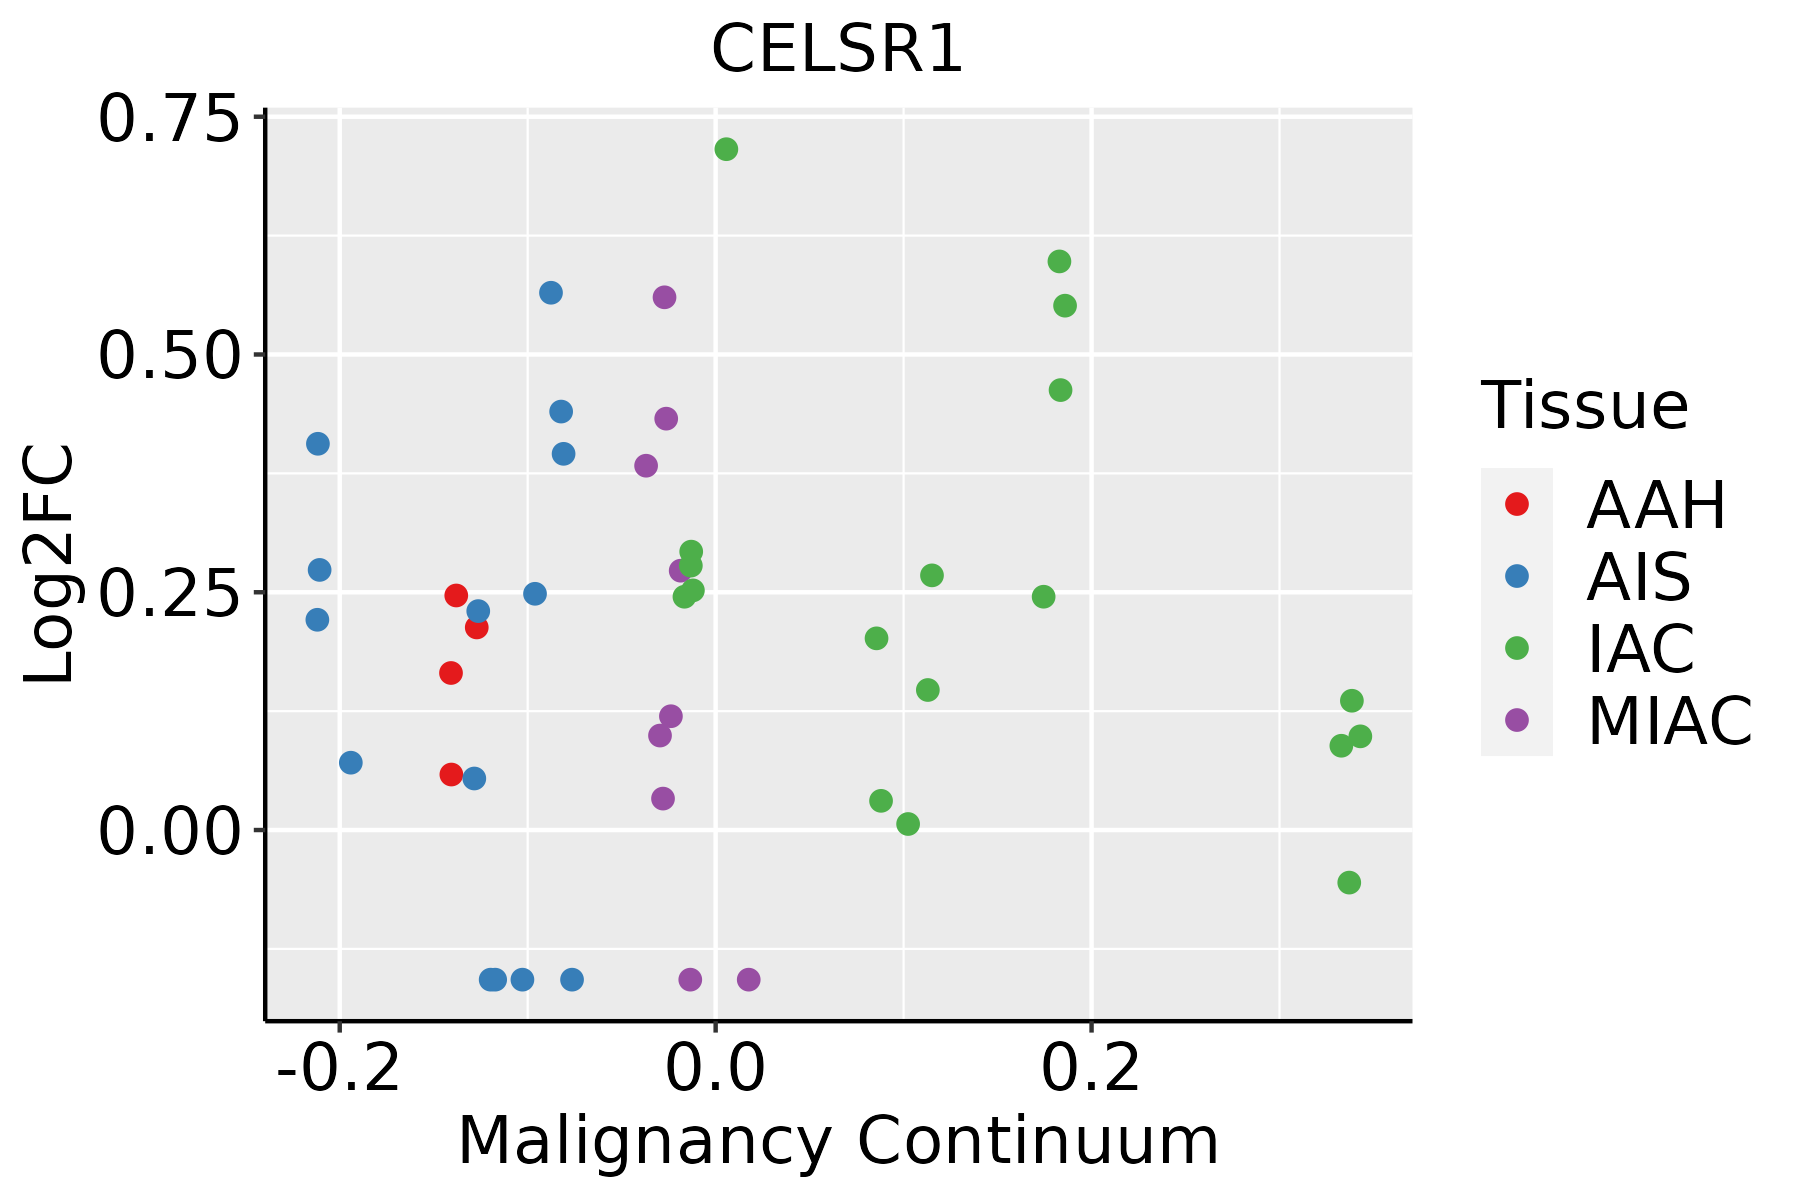 | AAH: Atypical adenomatous hyperplasia |
| AIS: Adenocarcinoma in situ |
| IAC: Invasive lung adenocarcinoma |
| MIA: Minimally invasive adenocarcinoma |
| Oral Cavity | 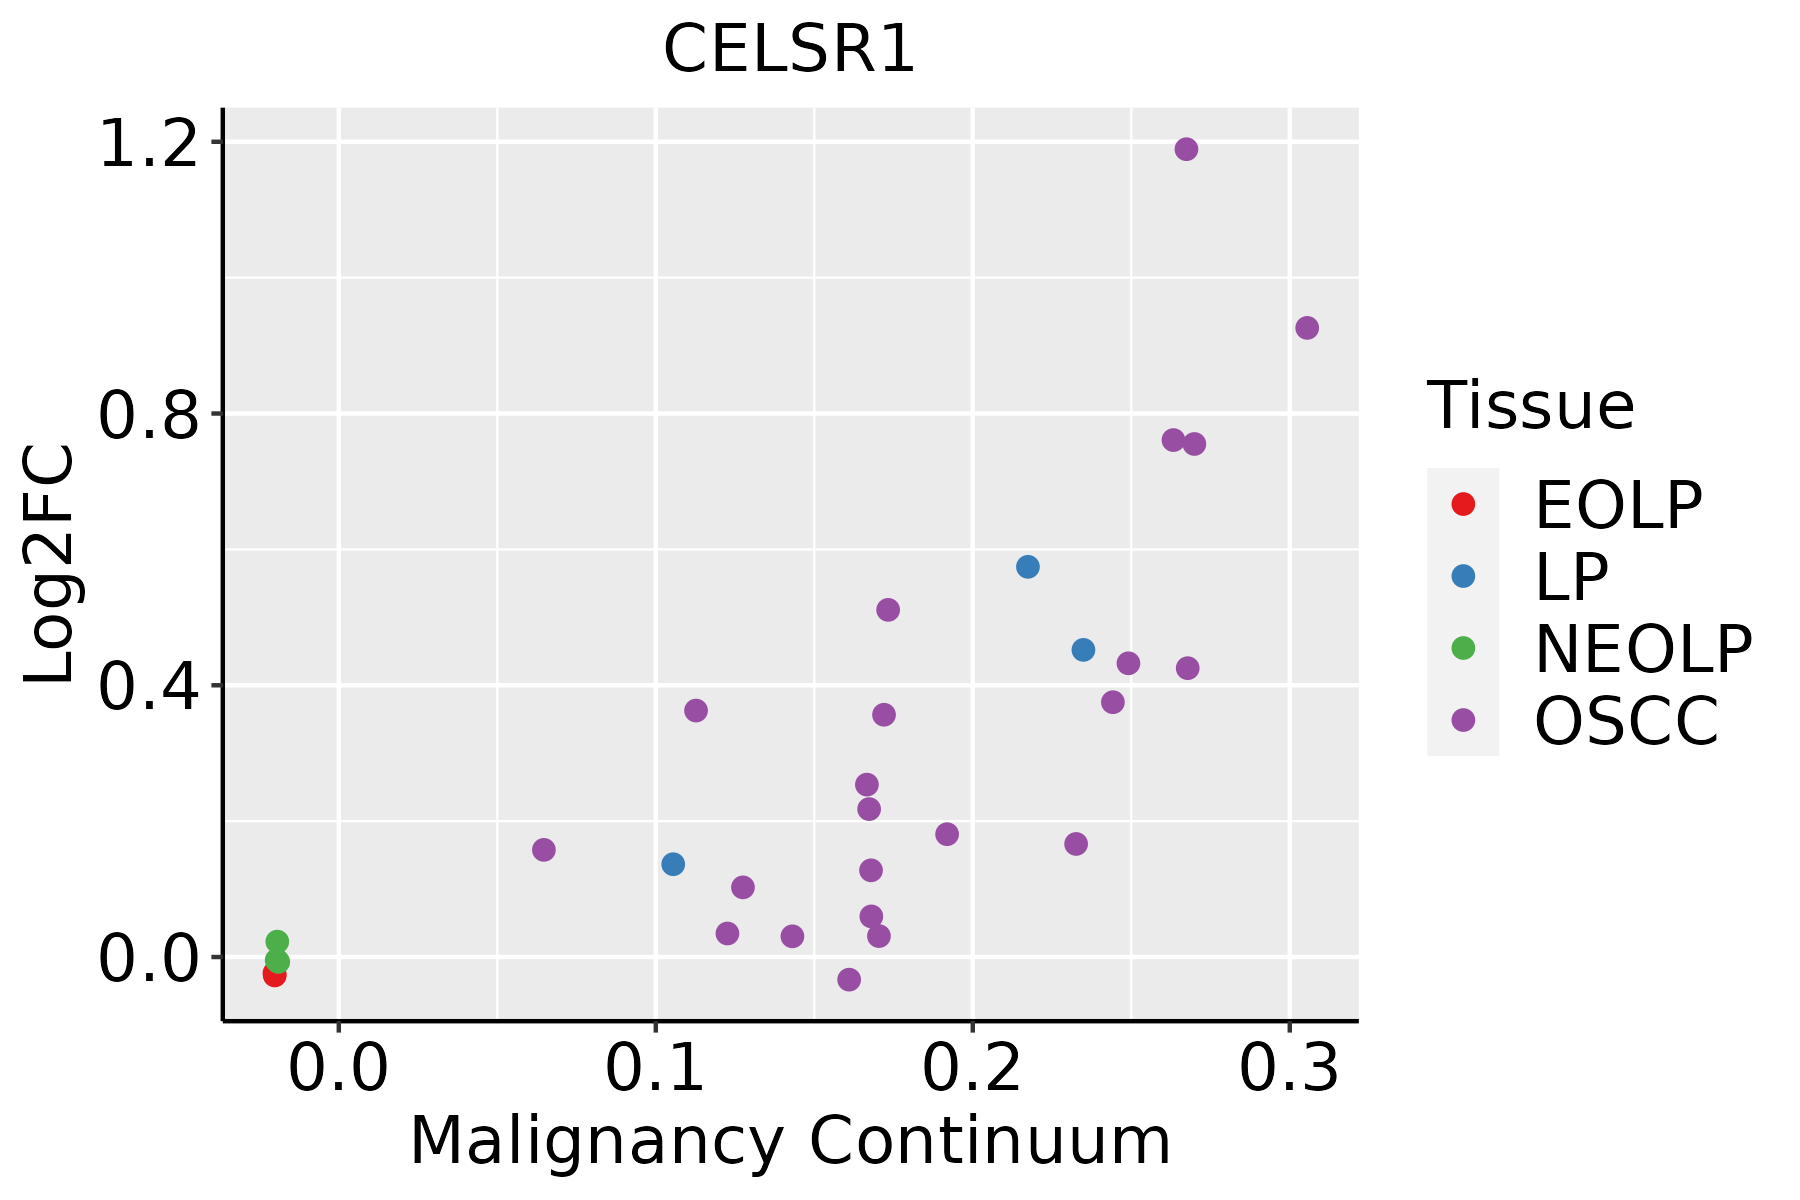 | EOLP: Erosive Oral lichen planus |
| LP: leukoplakia |
| NEOLP: Non-erosive oral lichen planus |
| OSCC: Oral squamous cell carcinoma |
| Skin | 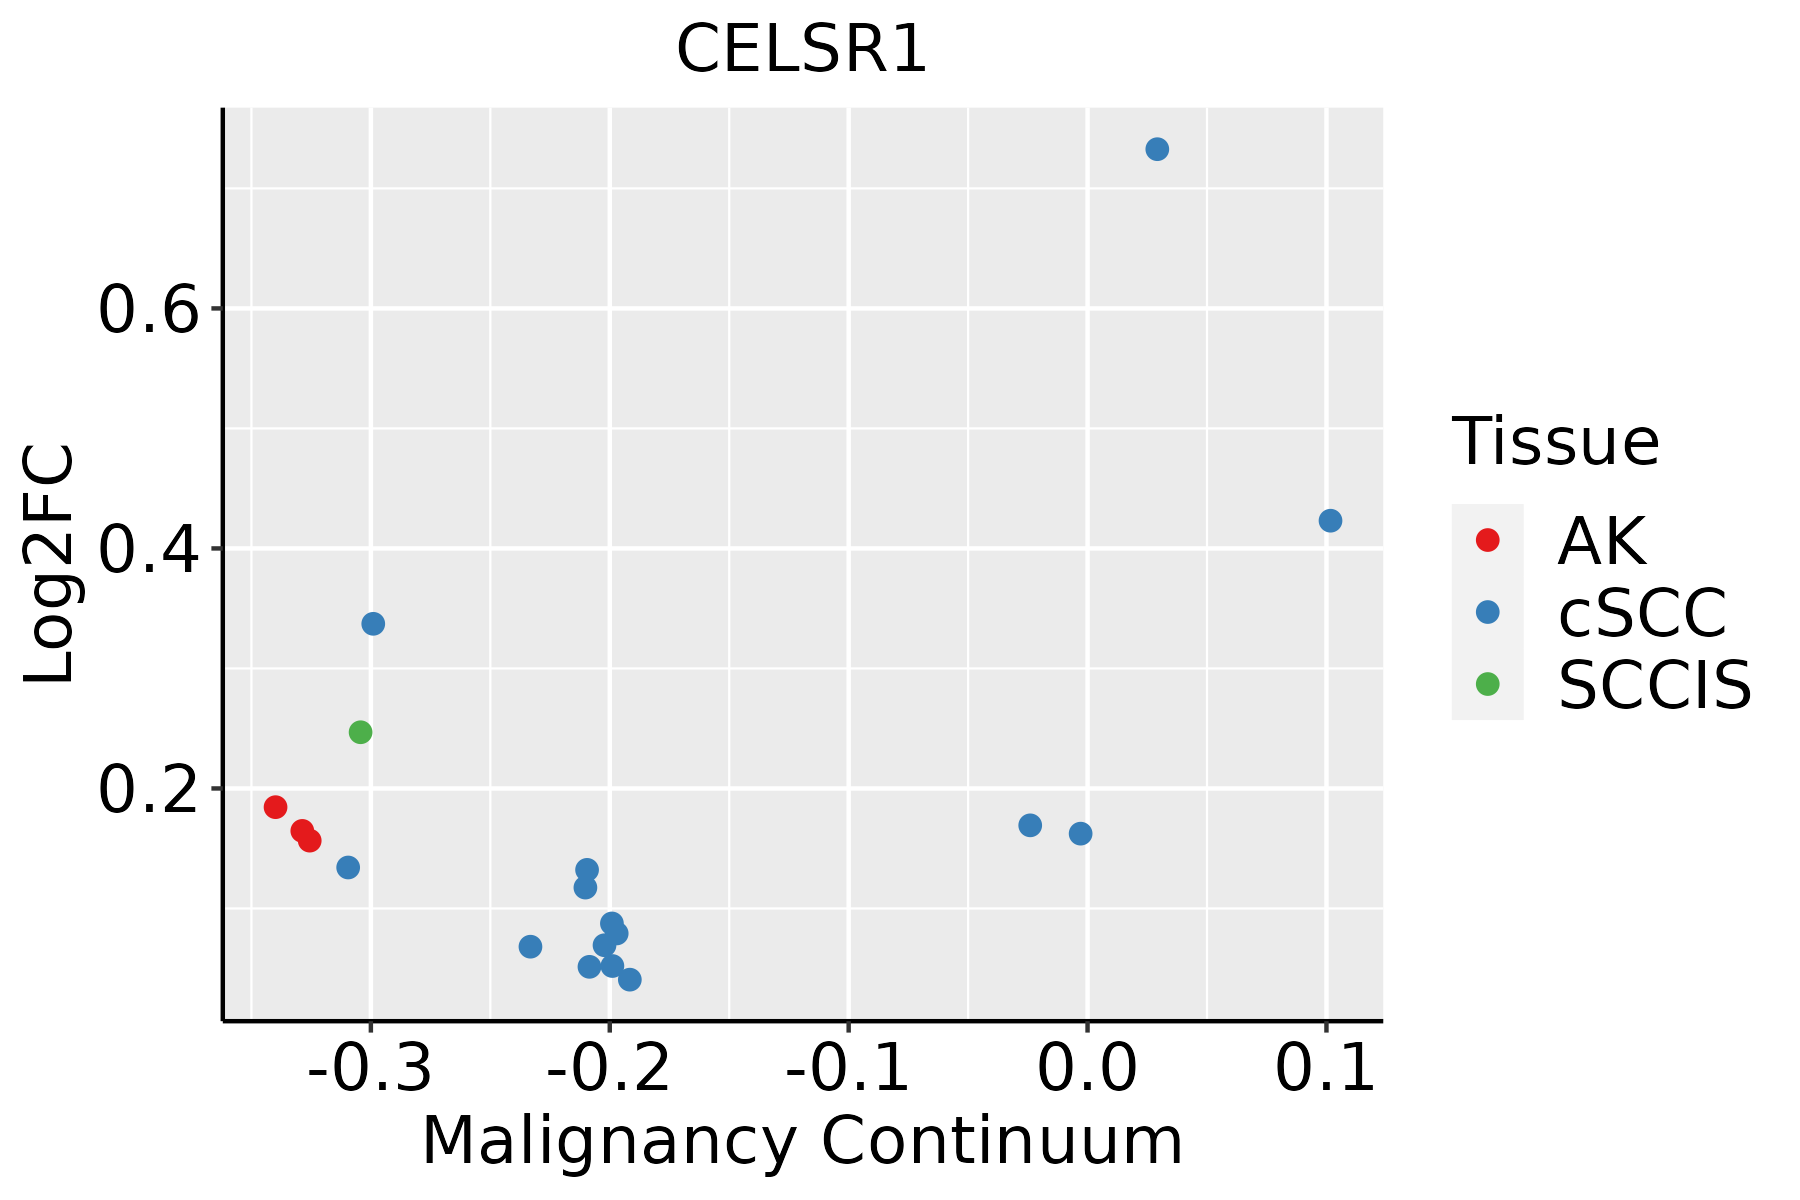 | AK: Actinic keratosis |
| cSCC: Cutaneous squamous cell carcinoma |
| SCCIS:squamous cell carcinoma in situ |
| GO ID | Tissue | Disease Stage | Description | Gene Ratio | Bg Ratio | pvalue | p.adjust | Count |
| GO:003297014 | Breast | IDC | regulation of actin filament-based process | 56/1434 | 397/18723 | 6.37e-06 | 1.99e-04 | 56 |
| GO:003295614 | Breast | IDC | regulation of actin cytoskeleton organization | 48/1434 | 358/18723 | 1.03e-04 | 1.96e-03 | 48 |
| GO:006056212 | Breast | IDC | epithelial tube morphogenesis | 44/1434 | 325/18723 | 1.58e-04 | 2.73e-03 | 44 |
| GO:00303244 | Breast | IDC | lung development | 28/1434 | 177/18723 | 1.90e-04 | 3.15e-03 | 28 |
| GO:00303234 | Breast | IDC | respiratory tube development | 28/1434 | 181/18723 | 2.78e-04 | 4.26e-03 | 28 |
| GO:00611383 | Breast | IDC | morphogenesis of a branching epithelium | 28/1434 | 182/18723 | 3.05e-04 | 4.60e-03 | 28 |
| GO:00605412 | Breast | IDC | respiratory system development | 30/1434 | 203/18723 | 3.85e-04 | 5.40e-03 | 30 |
| GO:00017635 | Breast | IDC | morphogenesis of a branching structure | 29/1434 | 196/18723 | 4.68e-04 | 6.26e-03 | 29 |
| GO:003514812 | Breast | IDC | tube formation | 23/1434 | 148/18723 | 8.79e-04 | 1.02e-02 | 23 |
| GO:000183812 | Breast | IDC | embryonic epithelial tube formation | 19/1434 | 121/18723 | 2.10e-03 | 1.97e-02 | 19 |
| GO:0048754 | Breast | IDC | branching morphogenesis of an epithelial tube | 22/1434 | 151/18723 | 2.61e-03 | 2.34e-02 | 22 |
| GO:0060441 | Breast | IDC | epithelial tube branching involved in lung morphogenesis | 7/1434 | 29/18723 | 5.31e-03 | 3.94e-02 | 7 |
| GO:00721756 | Breast | IDC | epithelial tube formation | 19/1434 | 132/18723 | 5.63e-03 | 4.08e-02 | 19 |
| GO:003297024 | Breast | DCIS | regulation of actin filament-based process | 56/1390 | 397/18723 | 2.50e-06 | 8.74e-05 | 56 |
| GO:003295624 | Breast | DCIS | regulation of actin cytoskeleton organization | 48/1390 | 358/18723 | 4.82e-05 | 9.92e-04 | 48 |
| GO:003032413 | Breast | DCIS | lung development | 27/1390 | 177/18723 | 2.73e-04 | 4.09e-03 | 27 |
| GO:003032313 | Breast | DCIS | respiratory tube development | 27/1390 | 181/18723 | 3.93e-04 | 5.41e-03 | 27 |
| GO:006056221 | Breast | DCIS | epithelial tube morphogenesis | 41/1390 | 325/18723 | 5.98e-04 | 7.60e-03 | 41 |
| GO:006054111 | Breast | DCIS | respiratory system development | 28/1390 | 203/18723 | 1.10e-03 | 1.19e-02 | 28 |
| GO:006113811 | Breast | DCIS | morphogenesis of a branching epithelium | 25/1390 | 182/18723 | 2.08e-03 | 1.94e-02 | 25 |
| Hugo Symbol | Variant Class | Variant Classification | dbSNP RS | HGVSc | HGVSp | HGVSp Short | SWISSPROT | BIOTYPE | SIFT | PolyPhen | Tumor Sample Barcode | Tissue | Histology | Sex | Age | Stage | Therapy Types | Drugs | Outcome |
| CELSR1 | SNV | Missense_Mutation | rs73888514 | c.4171N>A | p.Glu1391Lys | p.E1391K | Q9NYQ6 | protein_coding | tolerated(0.08) | benign(0.425) | TCGA-3C-AALI-01 | Breast | breast invasive carcinoma | Female | <65 | I/II | Unspecific | Poly E | Complete Response |
| CELSR1 | SNV | Missense_Mutation | novel | c.8630G>A | p.Ser2877Asn | p.S2877N | Q9NYQ6 | protein_coding | tolerated(0.32) | benign(0.05) | TCGA-A2-A4RW-01 | Breast | breast invasive carcinoma | Female | <65 | III/IV | Unknown | Unknown | SD |
| CELSR1 | SNV | Missense_Mutation | | c.6920C>T | p.Thr2307Ile | p.T2307I | Q9NYQ6 | protein_coding | tolerated(0.42) | benign(0.216) | TCGA-A8-A08R-01 | Breast | breast invasive carcinoma | Female | <65 | I/II | Unknown | Unknown | SD |
| CELSR1 | SNV | Missense_Mutation | rs146465806 | c.8269N>A | p.Glu2757Lys | p.E2757K | Q9NYQ6 | protein_coding | tolerated(0.09) | possibly_damaging(0.636) | TCGA-AC-A8OQ-01 | Breast | breast invasive carcinoma | Female | >=65 | I/II | Unknown | Unknown | SD |
| CELSR1 | SNV | Missense_Mutation | rs143915949 | c.8410N>A | p.Asp2804Asn | p.D2804N | Q9NYQ6 | protein_coding | deleterious(0.01) | possibly_damaging(0.871) | TCGA-C8-A27B-01 | Breast | breast invasive carcinoma | Female | <65 | I/II | Chemotherapy | 5-fluorouracil | CR |
| CELSR1 | SNV | Missense_Mutation | rs775423517 | c.8191G>A | p.Ala2731Thr | p.A2731T | Q9NYQ6 | protein_coding | tolerated(0.11) | benign(0.157) | TCGA-D8-A1XK-01 | Breast | breast invasive carcinoma | Female | <65 | I/II | Chemotherapy | doxorubicine+cyclophosphamide | SD |
| CELSR1 | SNV | Missense_Mutation | novel | c.3998N>G | p.Ser1333Cys | p.S1333C | Q9NYQ6 | protein_coding | deleterious(0) | probably_damaging(0.993) | TCGA-E9-A3QA-01 | Breast | breast invasive carcinoma | Female | <65 | I/II | Unknown | Unknown | SD |
| CELSR1 | SNV | Missense_Mutation | | c.860T>C | p.Leu287Pro | p.L287P | Q9NYQ6 | protein_coding | deleterious(0.02) | probably_damaging(0.995) | TCGA-EW-A1P0-01 | Breast | breast invasive carcinoma | Female | <65 | I/II | Hormone Therapy | arimidex | PD |
| CELSR1 | insertion | Nonsense_Mutation | novel | c.5926_5927insTCGTGTCTCCAGAAATGCACACGCGTTCTCAGTGCAGACTCTAGGGA | p.Pro1976LeufsTer15 | p.P1976Lfs*15 | Q9NYQ6 | protein_coding | | | TCGA-BH-A0HF-01 | Breast | breast invasive carcinoma | Female | >=65 | I/II | Hormone Therapy | arimidex | SD |
| CELSR1 | insertion | Frame_Shift_Ins | novel | c.5313_5314insC | p.Gly1772ArgfsTer14 | p.G1772Rfs*14 | Q9NYQ6 | protein_coding | | | TCGA-C8-A1HK-01 | Breast | breast invasive carcinoma | Female | <65 | I/II | Unknown | Unknown | SD |


