
|
|||||
|
 | |
| |
| |
| |
| |
| |
|
Gene: CELF4 |
Gene summary for CELF4 |
| Gene information | Species | Human | Gene symbol | CELF4 | Gene ID | 56853 |
| Gene name | CUGBP Elav-like family member 4 | |
| Gene Alias | BRUNOL4 | |
| Cytomap | 18q12.2 | |
| Gene Type | protein-coding | GO ID | GO:0000003 | UniProtAcc | Q9BZC1 |
Top |
Malignant transformation analysis |
| Identification of the aberrant gene expression in precancerous and cancerous lesions by comparing the gene expression of stem-like cells in diseased tissues with normal stem cells |
| Entrez ID | Symbol | Replicates | Species | Organ | Tissue | Adj P-value | Log2FC | Malignancy |
| 56853 | CELF4 | HTA12-15-2 | Human | Pancreas | PDAC | 2.25e-02 | 3.57e-01 | 0.2315 |
| 56853 | CELF4 | HTA12-23-1 | Human | Pancreas | PDAC | 6.77e-03 | 5.48e-01 | 0.3405 |
| 56853 | CELF4 | HTA12-25-1 | Human | Pancreas | PDAC | 2.43e-03 | 4.69e-01 | 0.313 |
| 56853 | CELF4 | HTA12-26-1 | Human | Pancreas | PDAC | 3.93e-15 | 8.25e-01 | 0.3728 |
| 56853 | CELF4 | HTA12-29-1 | Human | Pancreas | PDAC | 5.15e-35 | 7.73e-01 | 0.3722 |
| 56853 | CELF4 | male-WTA | Human | Thyroid | PTC | 2.29e-02 | 1.10e-01 | 0.1037 |
| 56853 | CELF4 | PTC01 | Human | Thyroid | PTC | 5.96e-08 | 2.03e-01 | 0.1899 |
| 56853 | CELF4 | PTC03 | Human | Thyroid | PTC | 9.48e-05 | 1.82e-01 | 0.1784 |
| 56853 | CELF4 | PTC05 | Human | Thyroid | PTC | 1.21e-08 | 5.37e-01 | 0.2065 |
| 56853 | CELF4 | PTC06 | Human | Thyroid | PTC | 2.22e-22 | 6.46e-01 | 0.2057 |
| 56853 | CELF4 | PTC07 | Human | Thyroid | PTC | 2.80e-17 | 3.61e-01 | 0.2044 |
| Page: 1 |
| Tissue | Expression Dynamics | Abbreviation |
| Thyroid | 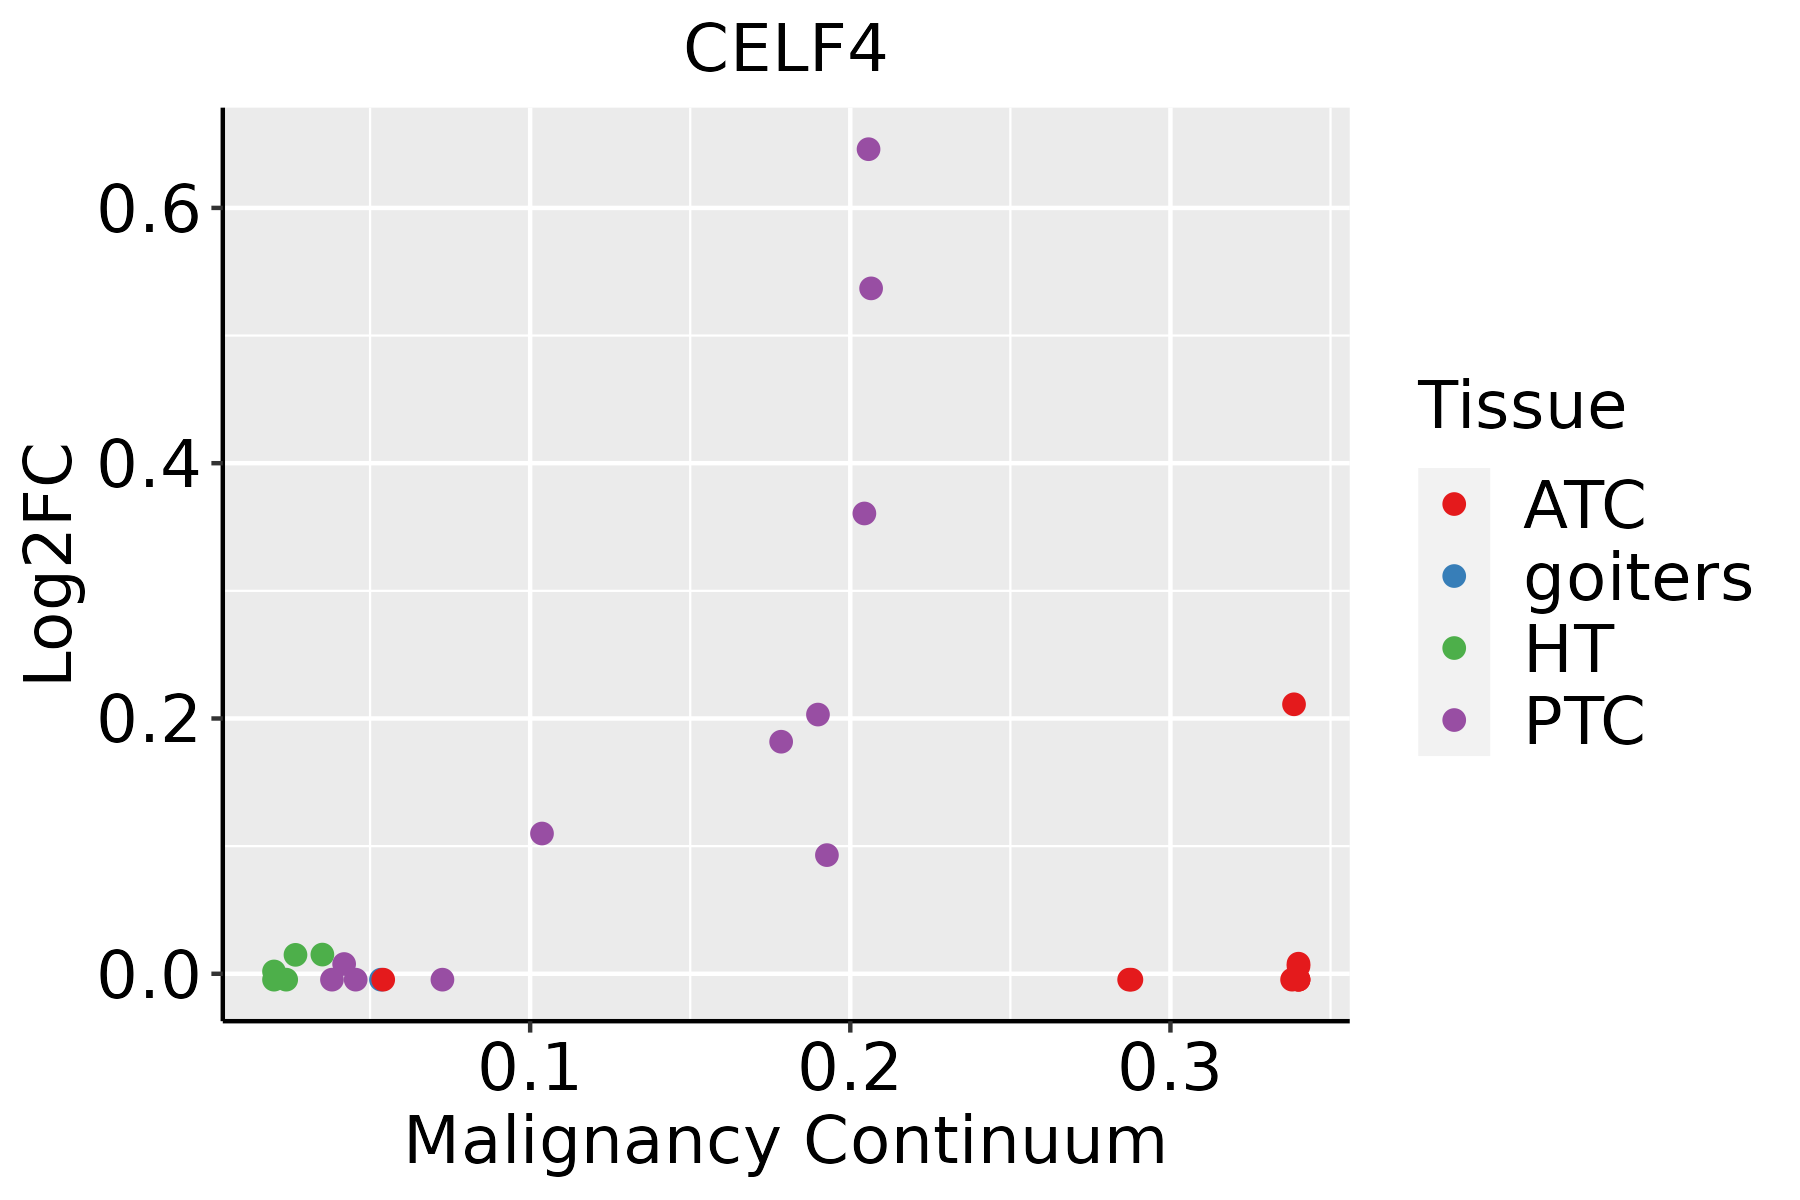 | ATC: Anaplastic thyroid cancer |
| HT: Hashimoto's thyroiditis | ||
| PTC: Papillary thyroid cancer |
| ∗log2FC in expression of this searched gene in stem-like cells from each diseased tissue sample relative to stem-like cells in normal samples in each tissue plotted against the malignancy continuum. Samples are colored based on if they are from different disease stage. |
Top |
Malignant transformation related pathway analysis |
| Find out the enriched GO biological processes and KEGG pathways involved in transition from healthy to precancer to cancer |
| Tissue | Disease Stage | Enriched GO biological Processes |
| Colorectum | AD |  |
| Colorectum | SER |  |
| Colorectum | MSS |  |
| Colorectum | MSI-H |  |
| Colorectum | FAP |  |
| ∗Top 15 enriched GO BP terms are showed in the bar plot of each disease state in each tissue. Each row represents a significant GO biological process which is colored according to the -log10(p.adjust). |
| Page: 1 2 3 4 5 6 7 8 9 |
| GO ID | Tissue | Disease Stage | Description | Gene Ratio | Bg Ratio | pvalue | p.adjust | Count |
| GO:0022613113 | Thyroid | PTC | ribonucleoprotein complex biogenesis | 292/5968 | 463/18723 | 3.24e-44 | 2.05e-40 | 292 |
| GO:0008380113 | Thyroid | PTC | RNA splicing | 273/5968 | 434/18723 | 4.44e-41 | 1.40e-37 | 273 |
| GO:0000375113 | Thyroid | PTC | RNA splicing, via transesterification reactions | 202/5968 | 324/18723 | 6.81e-30 | 3.91e-27 | 202 |
| GO:0000377113 | Thyroid | PTC | RNA splicing, via transesterification reactions with bulged adenosine as nucleophile | 199/5968 | 320/18723 | 2.96e-29 | 1.44e-26 | 199 |
| GO:0000398113 | Thyroid | PTC | mRNA splicing, via spliceosome | 199/5968 | 320/18723 | 2.96e-29 | 1.44e-26 | 199 |
| GO:1903311112 | Thyroid | PTC | regulation of mRNA metabolic process | 181/5968 | 288/18723 | 1.60e-27 | 5.94e-25 | 181 |
| GO:0050684112 | Thyroid | PTC | regulation of mRNA processing | 98/5968 | 137/18723 | 1.53e-21 | 3.10e-19 | 98 |
| GO:0043484113 | Thyroid | PTC | regulation of RNA splicing | 102/5968 | 148/18723 | 2.03e-20 | 3.21e-18 | 102 |
| GO:0071826113 | Thyroid | PTC | ribonucleoprotein complex subunit organization | 134/5968 | 227/18723 | 2.34e-17 | 2.24e-15 | 134 |
| GO:0006417113 | Thyroid | PTC | regulation of translation | 236/5968 | 468/18723 | 2.70e-17 | 2.52e-15 | 236 |
| GO:0022618113 | Thyroid | PTC | ribonucleoprotein complex assembly | 130/5968 | 220/18723 | 6.25e-17 | 5.47e-15 | 130 |
| GO:0048024113 | Thyroid | PTC | regulation of mRNA splicing, via spliceosome | 71/5968 | 101/18723 | 2.39e-15 | 1.71e-13 | 71 |
| GO:1903313110 | Thyroid | PTC | positive regulation of mRNA metabolic process | 76/5968 | 118/18723 | 3.60e-13 | 1.80e-11 | 76 |
| GO:0001701111 | Thyroid | PTC | in utero embryonic development | 175/5968 | 367/18723 | 1.40e-10 | 4.73e-09 | 175 |
| GO:0000380111 | Thyroid | PTC | alternative mRNA splicing, via spliceosome | 51/5968 | 77/18723 | 6.09e-10 | 1.92e-08 | 51 |
| GO:0033119113 | Thyroid | PTC | negative regulation of RNA splicing | 22/5968 | 25/18723 | 9.00e-09 | 2.18e-07 | 22 |
| GO:005068619 | Thyroid | PTC | negative regulation of mRNA processing | 24/5968 | 29/18723 | 2.26e-08 | 5.17e-07 | 24 |
| GO:0048025110 | Thyroid | PTC | negative regulation of mRNA splicing, via spliceosome | 18/5968 | 20/18723 | 1.05e-07 | 2.08e-06 | 18 |
| GO:1903312113 | Thyroid | PTC | negative regulation of mRNA metabolic process | 53/5968 | 92/18723 | 3.03e-07 | 5.13e-06 | 53 |
| GO:0033120112 | Thyroid | PTC | positive regulation of RNA splicing | 27/5968 | 37/18723 | 3.42e-07 | 5.75e-06 | 27 |
| Page: 1 2 |
| Pathway ID | Tissue | Disease Stage | Description | Gene Ratio | Bg Ratio | pvalue | p.adjust | qvalue | Count |
| Page: 1 |
Top |
Cell-cell communication analysis |
| Identification of potential cell-cell interactions between two cell types and their ligand-receptor pairs for different disease states |
| Ligand | Receptor | LRpair | Pathway | Tissue | Disease Stage |
| Page: 1 |
Top |
Single-cell gene regulatory network inference analysis |
| Find out the significant the regulons (TFs) and the target genes of each regulon across cell types for different disease states |
| TF | Cell Type | Tissue | Disease Stage | Target Gene | RSS | Regulon Activity |
| CELF4 | ISLET | Pancreas | ADJ | KIAA1324,PTPRN2,CACNA1A, etc. | 3.46e-01 |  |
| CELF4 | ISLET | Pancreas | PDAC | KIAA1324,PTPRN2,CACNA1A, etc. | 1.98e-01 |  |
| ∗The dot plots of a searched regulon are shown for all cell subpopulations in each disease state of each tissue based on the regulon specific score inferred using pySCENIC and by calculating the average expression. |
| Page: 1 |
Top |
Somatic mutation of malignant transformation related genes |
| Annotation of somatic variants for genes involved in malignant transformation |
| Hugo Symbol | Variant Class | Variant Classification | dbSNP RS | HGVSc | HGVSp | HGVSp Short | SWISSPROT | BIOTYPE | SIFT | PolyPhen | Tumor Sample Barcode | Tissue | Histology | Sex | Age | Stage | Therapy Types | Drugs | Outcome |
| CELF4 | SNV | Missense_Mutation | c.270C>A | p.Phe90Leu | p.F90L | Q9BZC1 | protein_coding | tolerated(0.25) | benign(0.034) | TCGA-AC-A23H-01 | Breast | breast invasive carcinoma | Female | >=65 | I/II | Unknown | Unknown | PD | |
| CELF4 | SNV | Missense_Mutation | c.707N>A | p.Arg236His | p.R236H | Q9BZC1 | protein_coding | deleterious(0) | probably_damaging(0.966) | TCGA-BH-A18G-01 | Breast | breast invasive carcinoma | Female | >=65 | I/II | Unknown | Unknown | SD | |
| CELF4 | SNV | Missense_Mutation | novel | c.1333N>T | p.Gly445Cys | p.G445C | Q9BZC1 | protein_coding | deleterious(0) | probably_damaging(1) | TCGA-EW-A3E8-01 | Breast | breast invasive carcinoma | Female | <65 | I/II | Hormone Therapy | anastrozole | SD |
| CELF4 | SNV | Missense_Mutation | c.554G>A | p.Arg185His | p.R185H | Q9BZC1 | protein_coding | deleterious(0) | possibly_damaging(0.745) | TCGA-MY-A5BF-01 | Cervix | cervical & endocervical cancer | Female | >=65 | I/II | Chemotherapy | cisplatin | CR | |
| CELF4 | SNV | Missense_Mutation | novel | c.144G>A | p.Met48Ile | p.M48I | Q9BZC1 | protein_coding | deleterious(0.03) | benign(0.354) | TCGA-ZJ-AAXN-01 | Cervix | cervical & endocervical cancer | Female | <65 | I/II | Unknown | Unknown | SD |
| CELF4 | SNV | Missense_Mutation | c.706C>T | p.Arg236Cys | p.R236C | Q9BZC1 | protein_coding | deleterious(0) | probably_damaging(0.998) | TCGA-AA-3492-01 | Colorectum | colon adenocarcinoma | Female | >=65 | I/II | Unknown | Unknown | SD | |
| CELF4 | SNV | Missense_Mutation | c.1085N>C | p.Ile362Thr | p.I362T | Q9BZC1 | protein_coding | deleterious(0.01) | benign(0.299) | TCGA-AA-3821-01 | Colorectum | colon adenocarcinoma | Female | >=65 | I/II | Unknown | Unknown | SD | |
| CELF4 | SNV | Missense_Mutation | c.707N>A | p.Arg236His | p.R236H | Q9BZC1 | protein_coding | deleterious(0) | probably_damaging(0.966) | TCGA-AZ-4315-01 | Colorectum | colon adenocarcinoma | Male | <65 | I/II | Unknown | Unknown | SD | |
| CELF4 | SNV | Missense_Mutation | c.622N>A | p.Ala208Thr | p.A208T | Q9BZC1 | protein_coding | deleterious(0) | probably_damaging(0.994) | TCGA-AZ-4615-01 | Colorectum | colon adenocarcinoma | Male | >=65 | III/IV | Chemotherapy | xeloda | PD | |
| CELF4 | SNV | Missense_Mutation | rs372830155 | c.923N>T | p.Ala308Val | p.A308V | Q9BZC1 | protein_coding | tolerated(0.73) | benign(0.001) | TCGA-AZ-5407-01 | Colorectum | colon adenocarcinoma | Female | <65 | I/II | Unknown | Unknown | SD |
| Page: 1 2 3 4 5 6 7 8 9 |
Top |
Related drugs of malignant transformation related genes |
| Identification of chemicals and drugs interact with genes involved in malignant transfromation |
| (DGIdb 4.0) |
| Entrez ID | Symbol | Category | Interaction Types | Drug Claim Name | Drug Name | PMIDs |
| 56853 | CELF4 | NA | iloperidone | ILOPERIDONE | 18521091 |
| Page: 1 |

Copyright 2023-Present -The University of Texas Health Science Center at Houston |